Abstract
Clinical studies have shown the evidence that the bladder wall thickness is an effective biomarker for bladder abnormalities. The clinical optical cystoscopy, the current gold standard, cannot show the wall thickness. The use of ultrasound by experts may generate some local thickness information, but the information is limited in field-of-view and is user dependent. Recent advances in magnetic resonance (MR) imaging technologies lead MR-based virtual cystoscopy or MR cystography toward a potential alternative to map the wall thickness for the entire bladder. From a high resolution structural MR volumetric image of the abdomen, a reasonable segmentation of the inner and outer borders of the bladder wall can be achievable. Starting from here, this paper reviews the limitation of a previous distance field-based approach of measuring the thickness between the two borders and then provides a solution to overcome the limitation by an electric field-based strategy. In addition, this paper further investigates a surface fitting strategy to minimize the discretization errors on the voxel-like borders and facilitate the thickness mapping on the three-dimensional patient-specific bladder model. The presented thickness calculation and mapping were tested on both phantom and human subject datasets. The results are preliminary but very promising with a noticeable improvement over the previous distance field-based approach.
Keywords: Bladder imaging, MR cystography, bladder wall thickness, iso-surface, distance field, electric field, surface fitting, moving least squares
I. Introduction
According to the most recent statistics from American Cancer Society, bladder cancer is estimated to be the eighth leading cause of cancer deaths in the United States [1]. In addition, bladder cancer is reported to have a high recurrence rate after resection of the tumors (as high as 80%) [2, 3]. Because of the high recurrence rate and lack of a convenient detection method, the cost associated with bladder cancer is probably the highest among all cancers [4]. An early detection of bladder abnormalities by a convenient procedure is crucial for effective treatment of bladder carcinoma [5, 6]. Currently the gold standard for evaluating the entire mucosa or inner surface of the bladder wall is the clinical optical cystoscopy. It is invasive and carries some degree of risk, such as infection [7]. Its utility is limited to the inspection of the surface and would not be able to visualize beyond the mucosa inside the wall. An alternative method is computed tomography (CT)-based virtual cystoscopy [8, 9]. It is also invasive to a lesser degree and carries the risk of radiation associated with X-ray exposure in CT imaging. Magnetic resonance (MR)-based virtual cystoscopy or MR cystography overcomes the above drawbacks. With the volumetric MR image data from the bladder wall, visualization of both the mucosa image geometry and the wall image textures is feasible [10, 11]. In addition to the visualization, computer-aided detection (CAD), based on the geometry and textures, of bladder abnormalities is also possible [12]. One critical factor for both visualization-based detection by experts and CAD schemes is the quality of the image features derived from the original image volume data. For this reason, efforts have been devoted to select meaningful features to improve the sensitivity and specificity of detecting bladder abnormality. Among many seemingly viable features, the bladder wall thickness (BWT) has been clinically recognized as a persuasive indicator or biomarker for bladder abnormality [13], because locally-thickened wall often appears around pathological abnormalities. Therefore, BWT is often regarded as a determinative feature for detection of abnormalities by human experts [14, 15, 16] and/or CAD schemes [17]. In addition to the local thickening feature, the global picture or the pattern of the thickness distribution on the entire wall can be another feature for early sign of abnormalities [18].
Extracting the BWT feature is not a trivial task [19]. There have been several challenges in obtaining the BWT measures by an objective or automated manner. For example, segmentation of the wall from the original image volume data by an automated manner is a challenge [20]. Given the segmented inner and outer borders, computing the thicknesses between the two arbitrary-shaped surfaces is another challenge. This work addresses the latter challenge. So far as we know, an initial study for the latter challenge [21] adopted a very rough method. Given the inner and outer borders of the bladder wall from manual or computer segmentation, it defined the thickness as the shortest distance between a voxel on the inner border to any voxel on the outer border. It works for simple cases such as a perfect sphere-like bladder volume, but is not robust for more general cases. In some clinical cases, a sharp inward bump on the outer border could cause the tip of the bump to be the closest point to many of the points on the inner border. Their subsequent work [14] adopted exactly the same strategy as in [21]. In a later work [15], a similar strategy was adapted onto the triangle mesh, where, instead of defining the distance on voxels, they measured the distance on the generated triangle mesh. Nevertheless, there was no essential improvement over [21]. Our recent work [17] turned to a more reasonable thickness model known as Distance Transform (DT) field model. The DT model aims to determine unique and non-intersecting paths between the inner and outer borders to measure the wall thickness. However, as investigated in our initial work [22], the DT-based method has several limitations that may lead to failure of determining unique and non-intersecting paths between the borders and losing sensitivities to local thickness variations. A remedy to the limitation is the use of electrostatic field model [22]. Based on the preliminary study [22], this paper gives the insight on the limitation and provides the details on the electrostatic field model and its implementation. This paper further gives a solution to minimize the voxel-like discretization error by local surface fitting the segmented inner and outer borders of the bladder wall.
The remainder of this paper is organized as follows. Section II reviews the limitations of DT-based methods, followed by an introduction of an alternative strategy or the electrostatic field-based method to calculate the thickness between the inner and outer borders of the bladder wall. A surface fitting is also introduced in this section, aiming to minimize the discretization error due to the voxel-made inner and outer borders. Section III reports results from both phantom experiments and human subject studies with comparisons to the DT-based methods. Conclusion, remarks and future work are given in section IV.
II. Method
Each MR bladder image volume dataset is first segmented for the bladder wall. The segmented inner and outer borders of the bladder wall are represented by connected single voxels in three-dimensional (3D) space [20]. Based on the segmented inner and outer borders, our next task or the objective of this study is to measure the “thickness” between the borders. As far as we know, there is no exact definition by theory of how thick it is between two arbitrarily-shaped surfaces at any point on either surface. In such situation, it is usually desired that an optimally-calculated thickness should reflect the expectation of the experts in the field. In our case of computing the bladder wall thickness between the segmented inner and outer borders, the wall structural variation due to all possible abnormality growths shall be considered. A reasonable and relatively formal definition of the wall thickness can be found in [17], where the thickness is defined as the length of a properly-defined path starting from a point on one border and ending at another point on the other border and the path is constrained by the local shape of the two borders. In the following presentation, we will follow this convention.
2.1. Previous implementation of the DT model for wall thickness calculation
The DT model [17] determines iso-distance surfaces between the inner and outer borders and defines the wall thickness based on the assumptions that (1) the iso-distance surfaces between the two borders are smooth and not self-intersecting and (2) there is only one path if tracing along the gradient directions of the iso-distance surfaces from one border to another. After the distance field is established, lines starting from the inner border to the outer border of the bladder wall are traced along the gradient directions of the DT field. Then the physical length of the traced line length from each voxel on the inner border to a position on the outer border is calculated and treated as the local thickness of the bladder wall at that voxel. The obtained thickness-mapping results are then superimposed on the extracted 3D bladder virtual model and provided an intuitive visualization of the bladder wall thickness. However, in our previous work [17], a DT map was made from the segmented inner border based on the assumptions that the inner border is more sensitive to abnormal growth than the outer border and the computation is efficient for one border only. This DT implementation has several limitations as illustrated below.
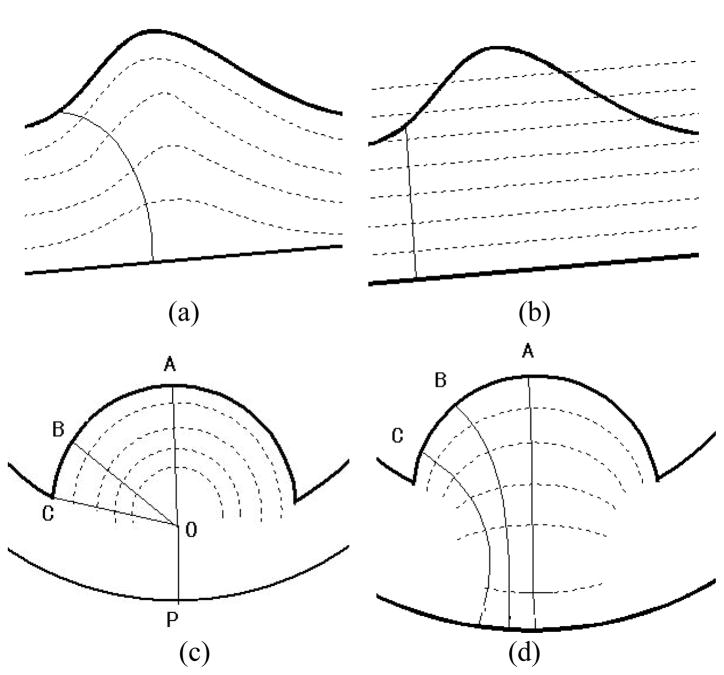
Regardless the assumptions of shape sensitivity and computing efficiency, the implementation [17] can lead to uncertainty by theory. For example, the DT field built from the inner border is often different from that from the outer border, resulting in inconsistency. In other words, the calculated thickness depends on which DT field being used and there is no preference to determine which DT mapping should be used. For instance, Fig. 1(a) shows a case where the DT map is made from the upper border, while Fig. 1(b) illustrates a case where the DT map is made from the lower border. Their results are very different. In the following presentation, we refer this limitation as “surface dependency”.
Fig. 1.
The thick curves represent the ideal inner and the outer borders. The dashed curves represent the iso-distance surfaces computed by the DT-based method between the two ideal borders. The thin curves indicate the paths from one border to the other. (a) It shows a path traced in the DT field built based on the inner border (higher curve). (b) It shows the same local shape of the bladder walls, but the DT field is built based on the outer border (lower curve). The path traced here differs from that in (a). (c) The “tumor” has a hemisphere shape. By the DT-based method, the thicknesses at A, B, C are calculated as along respectively, which are the same and do not reflect the true thickness changes. (d) The paths starting from A, B, C are computed by the electric-field line tracing method and have different lengths, i.e., the paths in (d) are more sensitive than that in (c) and more reasonable.
By an effort to overcome this surface dependency limitation, we firstly proposed an improved implementation of the DT model below.
2.2. Present implementation of the DT model for wall thickness calculation
The surface dependency issue of the previous implementation of the DT model is due to the problem that the distance field is solely determined by a single surface: either the inner border or the outer border, but not both. In this study, we proposed an improved DT model by building the distance field from both borders. The iso-surface field value on the inner border is guaranteed to be always 0, and the iso-surface field value on the outer border is guaranteed to be always 1. The iso-surface field values at positions in-between the two borders are always confined in range (0, 1). Thus all values are basically normalized. In short, our new implementation calculates an “iso-distance-ratio” field instead of the iso-distance field used in the previous implementation of the DT model. (Some illustrative results showing the gain of this new implementation are reported in Section 3.1, e.g., Fig. 3.)
Fig. 3.
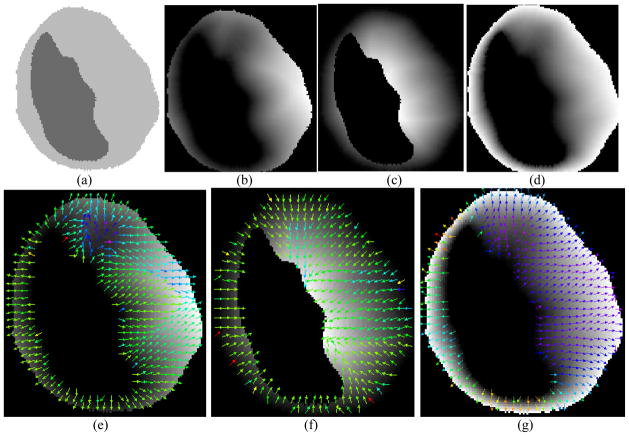
(a) A slice of the segmented bladder area of a patient dataset. (b) Distance field computed based on inner wall. The grey value of the image shows the distance from inner wall: the larger the grey value is the larger the distance is. (c) Distance field computed based on the outer wall. (d) Distance field computed based on both inner and outer walls. (e), (f) and (g) The sampled gradient directions used to trace paths in the distance field corresponding to (b), (c), and (d), respectively.
While the new implementation of the DT model resolved the surface dependency issue, it does not always offer sufficient sensitivity and may fail to reflect the local thickness variations in certain circumstances. Figure 1(c) describes one possible situation, where point “O” has the only shortest distance from point “P”, but it has the same shortest distance from all points on the hemisphere, e.g., points “A”, “B” and “C”. As a result, the paths of and will be the paths traced in the new DT model to measure the thickness at position “A”, “B”, “C”, respectively. They are of the same length (i.e. the thicknesses are identical at “A”, “B”, “C”), which disobeys the common sense of the “thickness” of that area, because the middle of the “tumor” (line A) should be considered thicker than the margin’s (line B and C). More reasonable ones shall be those in Fig. 1(d), where the electric potential field model (which will be detailed soon) is used to describe the iso-potential surfaces, rather than the iso-distance field model. The paths traced in Fig. 1(d), i.e., the thickness calculated from the paths in Fig. 1(d), also correctly reflect the real structural variations, whereas in Fig. 1(c) the whole “tumor” part turns out to be a constant thickness value. Based on the above reasons, though there is no exact definition of the “thickness” between two borders theoretically, the paths traced in Fig. 1(c) is considered less reasonable and less reliable than that in Fig. 1(d). In the following presentation, we refer this limitation as “distance dependency”. This limitation exists regardless the presence or absence of the other border. In other words, as long as the iso-surfaces are built based on the distances of a point (inside the wall) from the inner or outer borders, the distance dependency limitation could not be eliminated.
To eliminate the distance dependency limitation, the iso-potential surfaces, rather than the iso-distance surfaces or DT model, between the inner and outer borders shall be used. Building the iso-potential surfaces in general and tracing the paths along the gradient directions of the surfaces can be mathematically complicated and computationally intensive. In this application, we focus on a special case of iso-potential approaches, i.e., the electrostatic field model and trace the path along the electric field line as detailed below.
2.3. Presentation of the electric-field line tracing method
The electric-field line tracing (EFLT) method is inspired by the Charged Particle Model (CPM), which was initially brought up in [23], where the use of the CPM was mainly on image segmentation. It assigns positively charged particles into an external electrostatic field generated by fixed negative charges placed at each pixel position of an input image. Under the carefully designed Coulomb force and the Lorentz force, the positively charged particles will eventually converge to the borders (to be segmented). In this study, we adapted the CPM into the thickness calculation and introduced the EFLT method. For a purpose different from the CPM work [23], the EFLT method performs in dramatically different way. It initially assigns charged particles on the segmented inner and outer borders uniformly. The two borders are then treated as two iso-potential surfaces where one surface has positive charges and the other has negative charges. Then an electrostatic field is generated in-between these two surfaces. Inside this electrostatic field, for any given position on either surface, there is always a unique electric field line starting at that position and ending on the other surface. Using the terminology of DT model, other iso-potential surfaces can be specified inside the electrostatic field. Each electric field line or the path is perpendicular to all the iso-potential surfaces. The electrostatic field guarantees to generate unique and non-intersecting paths between the inner and outer borders to measure the wall thickness at any position at each border. The dotted lines between the two borders in Fig. 1(d) illustrate the iso-potential surfaces and the solid lines show the paths. The length of the path at any point on either border is measured as the wall thickness at that point.
The electrostatic field model is theoretically sound. However, in practice, it is nearly impossible to calculate the lengths of the theoretically exact electric field lines between two arbitrarily shaped surfaces. In the following presentation, we will elaborate our EFLT procedure of tracing and measuring the electric field lines in a discrete manner.
It is well-known that the contribution to the electric field at a point in space due to a single discrete charge located at another point in the space is given by the following equation:
| (1) |
where Q is the charge of the particle creating the electric force, R is the distance from the particle with charge Q to the concerned point in the E-field, r̂ is the unit vector pointing from the particle with charge Q toward the concerned point in the E-field, and ε0 is the electric constant.
So the total electrostatic field due to a quantity of point charges, nq, is simply the superposition of the contribution of each individual point charge:
| (2) |
In our implementation procedure, the “imaginary” charges are assigned uniformly in each image voxel on the borders. Supposing there is a moving unit electric charge starting from one position on the inner border, by the use of formula (2), we can integrate all electric forces generated by all charges in all voxels on both the inner and outer borders to calculate the sum force at the current position of the moving charge. Under this sum force, we move the unit charge one step forward and then hold its position, calculating the sum force at the new position to guide the next move. By doing this iteratively, the unit charge will eventually reach the outer border. We trace the path of the unit charge starting from a given position on the inner border and then obtain an electric field line which is uniquely defined for that position. The length of the electric field line segment represents the unique thickness of the wall for the corresponding positions on the borders.
A key parameter in this method is the step length along the electric field line. Each of the generated electric field lines basically consists of short polygonal line segments, of which each segment has the length of the step length. It is an approximation in discrete domain of the theoretical continuous path. We can verify its correctness by letting the step length approach to infinitesimal. Then the EFLT procedure is exactly how the continuous electric field lines are drawn theoretically. Thus, this method asymptotically converges to the theoretical model in the continuous domain.
The above discussion implies that we can approach arbitrarily close to the theoretical value by setting the step length arbitrarily small. However, it is obviously impractical to choose an arbitrarily small step length. To balance the accuracy and efficiency, an adaptive step length is considered. It is noticed that errors tend to happen when the local curvature of the electric line is large. Interestingly, the local curvature can be simply reflected by the proceeding directions of each intermediate position along an electric field line as they are actually gradient directions of the lines. So the adaptive step length is defined as follows:
| (3) |
where l is a predefined step length, u is a vector indicating the previous proceeding direction, and v is a vector indicating the current proceeding direction. By this way, a small step length is chosen when the electric field line turns sharply and a large one is chosen when it goes relatively straight.
A possible extreme case may occur when there is a sharp pit or hill on the inner border, as shown in Fig. 2. In this situation, the electric force at P is pointing up, rather than down (the inner border is shown by the solid curve with positive charges and the outer border with negative charges on the bottom is not shown). However, in our method, we expect the particle to move downward toward the outer border. Fortunately, in this extreme case we are actually only interested in the trend of the electric field line, not the direction itself for next move. So if such a situation happens, we should correct the direction to its opposite. To that end, we measure the angle between the current proceeding direction and the one of the previous step. If the angle is larger than a predefined threshold, it should be considered to be corrected.
Fig. 2.
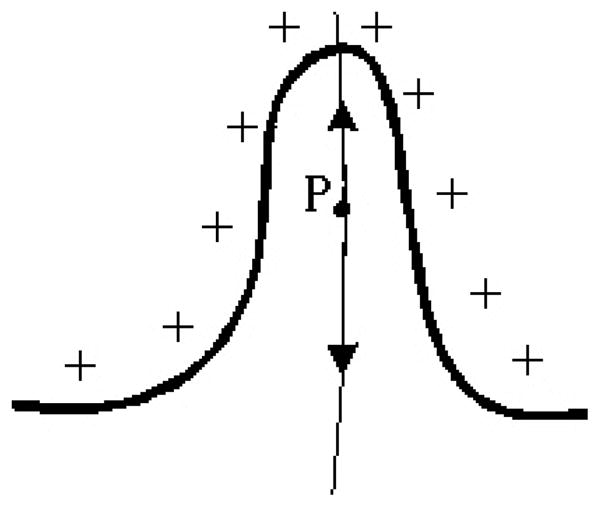
A particular case for the present method.
Based on the above description, apparently, the distance dependency issue from the DT model does not exist in this electric field model by nature. Furthermore, because both borders apply equal effects on the path traced for any given points, the surface dependency of the DT model does not exist in this new model either. Thus, the above presented EFLT method resolves both the limitations of surface dependency and distance dependency in the DT model.
2.4. Surface fitting strategy
Though it is possible to reduce the discretization error during the EFLT procedure by constantly reducing the step length, the discretization errors always happen on the two segmented voxel-made borders. Furthermore, as the bladder wall is often thin and generally occupies a small region of the whole MR abdominal image volume, the voxel size may appear relatively large in terms of calculating the wall thickness. As a result, this discretization error may be no longer negligible for the clinical task of measuring the wall thickness. In order to fundamentally eliminate the discretization errors, it is necessary to find a smooth surface that can approximate each of the two borders. For this purpose, we adopted the Moving Least Squares (MLS) strategy [24] to establish a polynomial for each voxel of interest and then join them together to complete a global surface of either the inner or outer border of the bladder wall. The resulting surface can reach C∞ smooth [25].
The general pipeline of MLS is summarized as follows: Let S be a (d − 1) dimensional manifold in ℝd, and {ri}i∈I be points on S or situated near S, e.g., points obtained from some measurements of S. An interpolating operation is a manifold passing through {ri}i∈I, while a smoothing operation is a manifold passing near the data points {ri}i∈I. With respect to our case, a smoothing operation is more suitable. The smoothing operation involves generally two steps:
Given a r near S, a local approximation to S is first made by a hyperplane in ℝd.
From the hyperplane, a new coordinate is defined. In the new coordinate, a local polynomial approximation of S is computed.
There are several implementations for the general MLS idea [26]. For practical issues, we prefer a fast and robust implementation. Our implementation is summarized as follows along the idea in [24]:
Step 1
Local hyperplane approximation:
Find a hyperplane Hr = {x|〈a, x〉 − D = 0, x ∈ ℝd}, a ∈ ℝd ||a|| = 1, D ∈ ℝ such that the following quantity is minimized:
| (4) |
where 〈·, ·〉 is the standard inner product in ℝd. Since the weights {θ(||ri − r||)} decrease as the distance ||ri − r|| increases, the resultant hyperplane approximates a tangent hyperplane to S near the point r. In our case, d = 3, and then the minimization problem is a standard orthogonal regression which can be solved by single value decomposition efficiently. The blue plane shown in Fig. 4(a) demonstrates the local approximating hyperplane of a phantom data.
Fig. 4.
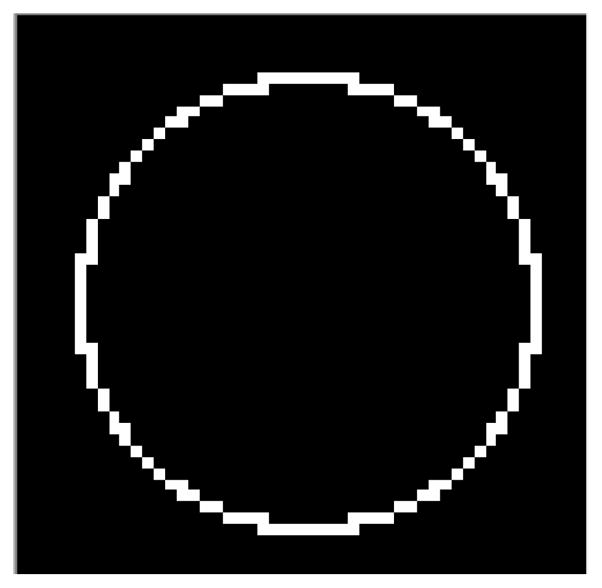
One slice from the middle of the phantom with one surface embedded. The border voxels are marked as value 2 and the other parts are all marked as 0.
Step 2
Local polynomial surface approximation:
Given the hyperplane computed in step 1 above, the datasets are transformed from the original coordinate system onto a new coordinate system defined by the hyperplane Hr. This new coordinate system is defined as follows: In our case d = 3, the traditional X, Y, Z symbols are used to denote the three orthogonal axes. The Z-axis is selected to be along the normal of Hr and let Hr be the Z = 0 plane. Let q be the orthogonal projection of r on Hr and chose q as the origin. A new local coordinate system around r is then established. Under this new coordinate system, a local approximation of degree m to S can be found by a polynomial which minimizes, among all , the weighted least squares error:
| (5) |
where xi is the translated coordinates of a voxel and fi is the translated z-coordinate of the voxel. This is a linear system and can be solved efficiently. The value p̄(0) approximates the height of S over Hr at the origin. Hence the point r = q + p̄(0) is defined to be the approximation of the projection of r on S. The green surface depicted in Fig. 5(a) illustrates a local approximating polynomial surface around a voxel in a sphere-like phantom.
Fig. 5.
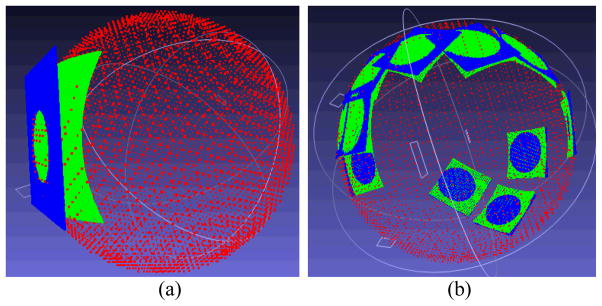
(a) The approximating surface obtained by the MLS method around the voxel at (23, 21, 5). Each voxel is corresponding to a red point. The blue plane is the fitted hyperplane (from the step 1 in Section 2.4) and the green one shows the fitted quadratic surface (from the step 2 in Section 2.4). (b) More samples at 10 random selected positions.
III. Results
In this section, we will first present the iso-distance fields generated from the DT model with one border and both borders of the bladder wall and show their limitation. Then the performance of the surface-fitting strategy will be reported. Given the fitted continuous surface for the inner and outer borders, we will optimize the step length in calculating the wall thickness along the electric field line path at any position on either border. Based on the fitted surface and optimized step length, the comparison of the DT-based method and the EFLT method will be made in terms of the wall thickness mapping. Both phantom experiments and clinical studies are performed in the comparison. Finally the thickness distribution of clinical studies is presented.
Nine datasets from seven patients and two volunteers were used to test the above presented methods. After informed consent, these subjects were scanned by either a 1.5 Tesla or 3.0 Tesla MRI scanner using parameters as shown in Table I.
TABLE I.
Data Information and Image Acquisition Parameters
| Dataset | Scanning Protocol | TR (ms) | TE (ms) |
|---|---|---|---|
| 1 | 3DFFE-SPIR CLEAR | 4.6666 | 2.2766 |
| 2 | 2500 FULL SCAN CLEAR | 4.6747 | 2.2818 |
| 3 | 3D 25 MIN CLEAR | 4.6679 | 2.2756 |
| 4 | MPR COR | 4.6679 | 2.2756 |
| 5 | THRI PELPRE SENSE | 4.3896 | 2.1181 |
| 6 | bSPIR 3nex CLEAR | 4.6750 | 2.2818 |
| 7 | SPIR 2nex CLEAR | 4.6747 | 2.2818 |
| 8 | 3DFFE-SPIR CLEAR | 4.6747 | 2.2818 |
| 9 | THRIVE PRE CLINICAL PROT SENSE | 3.7544 | 1.8869 |
The volumetric image data were segmented by the coupled level-set algorithm [20]. The outputs of the segmentation algorithm are the inner and outer borders of each bladder wall. Each border is the connection of many singe voxels and can be thought as a shell of one voxel thickness. The following studies were carried out based on these voxel-made borders.
3.1 Iso-distance field built from the DT model
The image shown in Fig. 3(a) is a slice of segmented bladder area of a patient dataset. The darker region is the lumen of the bladder and the brighter area is the bladder wall. Note that the right part of the bladder wall is much thicker than expected, because there is a tumor around that area. The following Figs. 3(b), 3(c) and 3(d) illustrate the iso-distance fields in terms of gray intensities on the image by the use of the DT model. The darker it is, the lower the field value is. Figures 3(b) and 3(c) are the iso-distance fields generated from the inner and outer border, respectively. They reveal the aforementioned surface dependency problem. For example, in Fig. 3(b), the DT field was computed based on the inner border only, thus the values on the inner border are same but vary greatly on the outer border. This is consistent with the illustration in Fig. 1(a). Similarly, Fig. 3(c) demonstrates that the values on the outer border are same but vary greatly on the inner border, because it is computed based on the outer border only. This is consistent with the demonstration in Fig. 1(b). This surface dependency problem was resolved in the DT field of Fig. 3(d) by the use of both borders. The values of the iso-distance filed in Fig. 3(d) are consistent along both the inner and outer borders.
Figures 3(e), 3(f) and 3(g) display a sampled gradient field computed from the iso-distance fields of 3(b), 3(c) and 3(d), respectively. (The colors indicate the magnitude of the gradient). In Fig. 3(e), each traced path starts perpendicularly to the inner border surface but ends in arbitrary direction, while Fig. 3(f) shows the opposite. In contrast, Fig. 3(g) shows that each line starts perpendicularly to the inner border and ends perpendicularly to the outer border as well. This is a desired property for the thickness measure and is guaranteed by the electrostatic field model.
3.2 Surface fitting by the MLS strategy
Firstly a 50×50×50 volumetric phantom dataset was generated, (see Fig. 4), to demonstrate the performance of the MLS surface fitting strategy. The border of Fig. 4 is a sphere surface (with a radius of 25 voxel units, which has a slightly smaller radius than the inner borders of the phantoms in Fig. 7 to consider the challenge in fitting the borders of small radius (higher local curvatures).
Fig. 7.
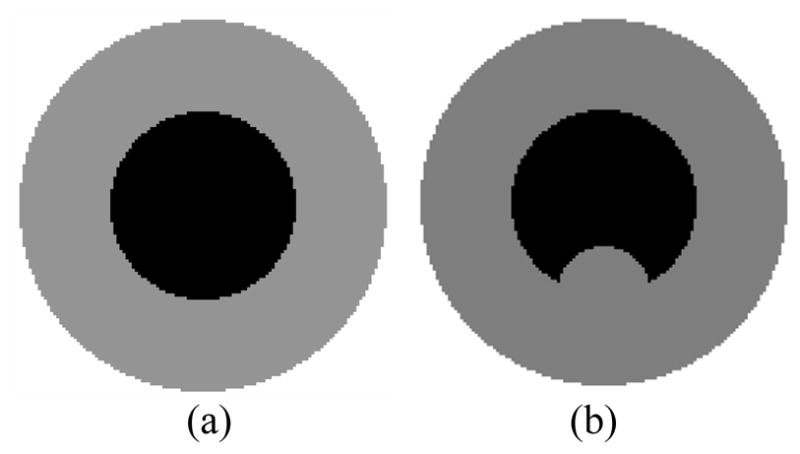
Two-dimensional presentations of normal and abnormal bladder wall models. (a) – Normal case where the phantom was made as a sphere. (b) – Abnormal case where the phantom was made as a sphere plus a “tumor” part at the bottom of inner border.
Figure 5(a) shows the approximating surface around the voxel at (23, 21, 5) obtained by the MLS method. The red point cloud is formed by the individual points corresponding to each voxel on the surface of the phantom. The blue hyperplane is the approximating hyperplane as mentioned in the Step 1 above. The resulting hyperplane can be expressed mathematically as: − 0.13586x − 0.245312y − 0.959877z + 14.0551 = 0.
The green surface indicates the approximating surface. In our implementation, we applied a second-degree approximation, i.e., we fitted the points into a quadratic surface mathematically described as: 0.0246x2 − 0.000855xy + 0.0273y2 − 0.0475x − 0.548y − 0.00848 = 0.
Figure 5(b) shows 10 randomly chosen points to illustrate the local smooth approximating surfaces.
Based on the phantom experiments above, we further tested the MLS strategy by nine subject datasets. Figure 6 shows the results from a subject dataset, where 20 points were randomly chosen to demonstrate the local smooth approximating surfaces.
Fig. 6.
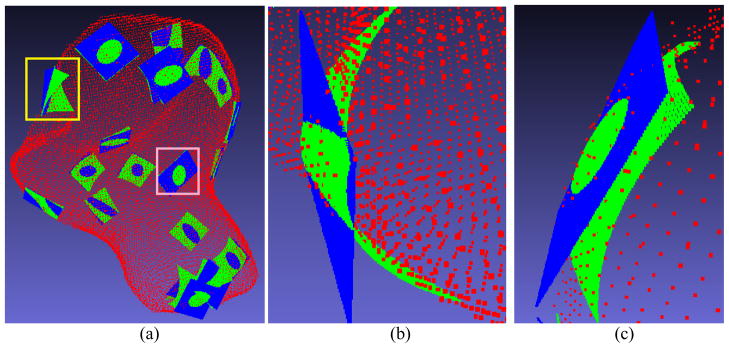
(a) An overview of 20 local approximating surfaces on a patient study. (b) A closer view of the local approximating surface marked by the yellow rectangle in (a). (c) A closer view of the local surface marked by the pink rectangle in (a).
To further quantitatively evaluate the MLS strategy, a phantom with known ground truth was created. The phantom data were volumetric. Figure 7 shows a slice of two versions of the phantom. One phantom version represents normal cases, see Fig. 7(a). The other phantom version represents abnormal cases where a “tumor” is present on the inner border; see Fig. 7(b). The thickness of the phantom was made larger than the routine cases in clinical virtual cystoscopy for the purpose to show the errors more visibly and therefore more convincingly. The parameters of the phantom data are shown in Table II and Table III.
Table II.
Parameters of Phantom in FIG. 7(a).
| Parameters | Value |
|---|---|
| Height | 130 voxels |
| Width | 130 voxels |
| Slices | 130 |
| Outer border center | (H:65, W:65, S:65) |
| Outer border radius | 60 voxels |
| Inner border center | (H:65, W:65, S:65) |
| Inner border radius | 30 voxels |
Table III.
Parameters of Phantom in FIG. 7(b).
| Parameters | Value |
|---|---|
| Height | 130 voxels |
| Width | 130 voxels |
| Slices | 130 |
| Outer border center | (H:65, W:65, S:65) |
| Outer border radius | 60 voxels |
| Inner border center | (H:65, W:65, S:65) |
| Inner border radius | 30 voxels |
| “Tumor” center | (H:95, W:65, S:65) |
| “Tumor” radius | 15 |
Two experiments were performed on the first phantom version (i.e., Fig. 7(a)) to study both the MLS surface fitting and the step lengths in the EFLT model. To more reliably evaluate the effect of the surface fitting at different step lengths, the adaptive step length (i.e., equation (3)) was turned off in both experiments. The MLS surface fitting approximation was turned off in the first experiment, but was applied in the second experiment for the purpose of comparison. The error curves at different step lengths are shown in Fig. 8 for the experiment without MLS surface fitting and Fig. 9 for the experiment with MLS surface fitting.
Fig. 8.
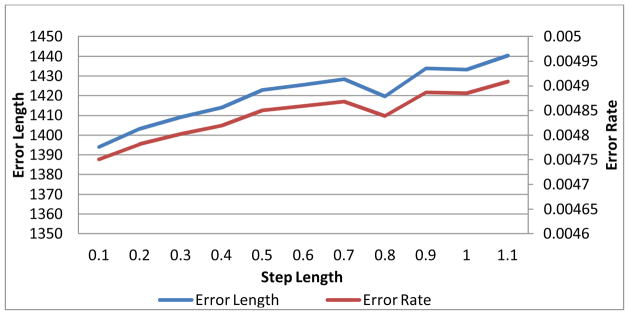
The errors v.s. the step length of the experiment without the MLS surface fitting.
Fig. 9.
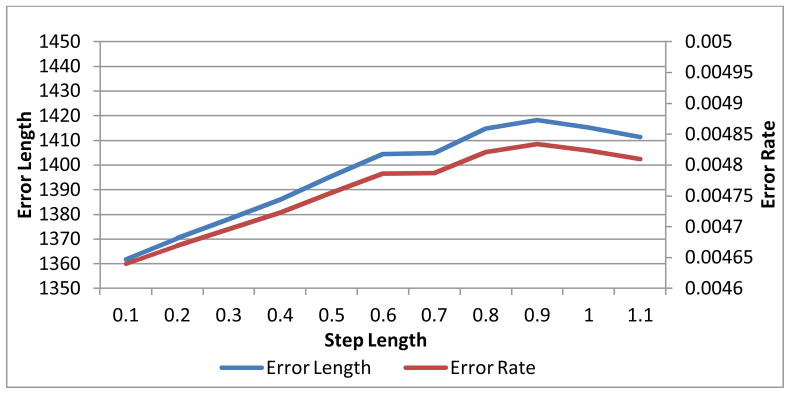
The errors v.s. the step length of the experiment with the MLS surface fitting.
Since the phantom is a sphere, it is trivial to calculate the true distance between each point on the inner border to its peer on the outer border. We summed up the absolute values of the difference between the true value and the calculated value as the error length. The error rate curve shows the percentage of the error length to the total length. By comparing Fig. 9 with Fig. 8, we can observe some difference between the thickness calculation with the MLS and the one without. It is observable that, at each step length, Fig. 9 indicates a little bit higher accuracy than Fig. 8 does, especially when the step length goes large, which implies that the thickness calculation with surface fitting tends to be more accurate than the one without, and it is probably more effective when the step length is large.
3.3 Step length optimization
A key parameter of the EFLT procedure that affects the computational accuracy and efficiency is the step length. In order to strike a balance between them, we studied the accuracy of the thickness calculation at different step lengths. The evaluations of different step lengths were effectively incorporated into the two experiments detailed in the last section above.
Both Fig. 8 and Fig. 9 show that the errors tend to rise when the step length increases. But there is a flat or drop along the curves at step length around 0.7, indicating that 0.7 is probably sufficient in practical use. This step length was used in the following subject studies on thickness mapping.
3.4 Comparison studies on the DT-based method and the EFLT method
As we have mentioned above, because there is no precise definition of the thickness between two arbitrary surfaces theoretically, a quantitative evaluation is not viable for the comparisons across different thickness calculation models. One alternate routine may be comparing the calculated thickness mapping against the experts’ drawing. However, this method is impractical due to the huge workload of manually marking ground truths of local thickness values at tens of thousands voxel positions in the 3D space. Nevertheless a reasonable criterion to evaluate them can be the basic requirement that the calculated thickness should obey the common sense and/or the expectation of experts in the field and can reflect the true structural variations of the bladder wall. The following comparisons follow this convention.
The comparison studies among the DT-based methods and the EFLT strategy were carried out on both phantom and subject datasets. Figure 10 shows the difference between the calculated thickness mappings of the three methods of (a) the previous DT-based method [17], (b) the presented DT-based method in Section 2.2 above, and (c) the presented EFLT method of Section 2.3 above, conducted on the same 3D bladder model of the phantom of Fig. 7(b). The different colors indicate different thickness values. The color mapping modules of the three methods are identical using the color bar of Fig. 10(d). Figures 10(a) and 10(b) demonstrate that the results of the DT-based methods are consistent with the analysis about Fig. 1(c). It also demonstrates that the DT-based methods cannot resolve the distance dependency as we explained in Section 2.1 above. From Fig. 10(c), it can be observed that the EFLT method provides a higher sensitivity of the local variation over the “tumor” part, whereas the values computed from the DT-based models are almost constant (red) over the entire “tumor” region, which is consistent with the analysis about Figs. 1(c) and 1(d).
Fig. 10.

Thickness mappings on the 3D bladder phantom model with abnormality using the three methods of (a) the previous DT-based method [17], (b) the presented DT-based method in Section 2.2, and (c) the presented EFLT method in Section 2.3. Picture (d) shows the color bar for the thickness values over the phantom, where the red end indicates a higher value (thicker) while the purple end indicates a smaller value (thinner).
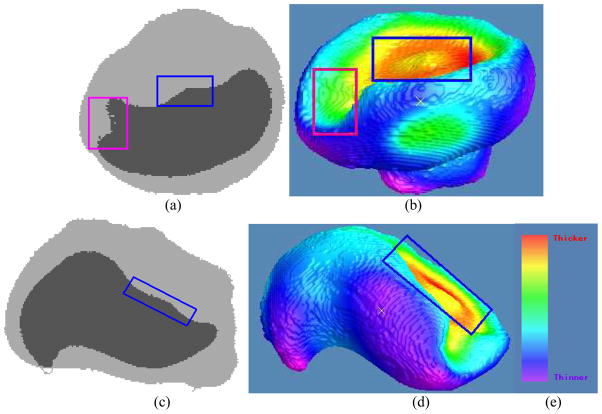
The three thickness calculating methods were then applied to nine subject datasets. An example of the subject studies is shown by Fig. 11. It is observable that the previous DT-based method has nearly the same thickness around the (possible) tumor region because it is solely computed based on the inner wall, while the presented DT-based method and the EFLT strategy show a noticeable variation of the thickness around the tumor. It is worth noting that although Figs. 11(b) and 11(c) are visually similar to each other, there is still some difference around the circular region between them. Keeping in mind that the color reflects the calculated thickness values, we can observe that Fig. 11(c) shows some smoother variations over the tumor area than Fig, 11(b) does. In spite of the somewhat difference between Figs. 11(b) and 11(c), they are both dramatically different from Fig. 11(a). Obviously, the result of nearly the same thickness around the tumor in Fig. 11(a) does not reflect the truth. The outcome of noticeable variation of the thickness around the tumor is expected and would more closely reflect the truth. This expectation is demonstrated by Fig. 12, where the left column shows two MR slice images of the segmented bladder (i.e., the truth) and the right column shows the thickness mapping of the EFLT method.
Fig. 11.
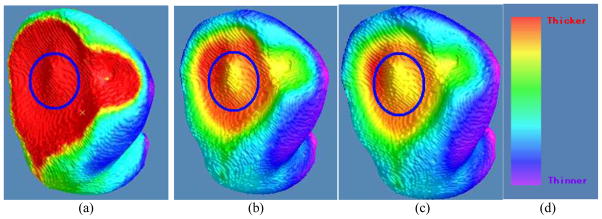
Thickness mappings on the 3D patient bladder, where the colors are superimposed on the inner surface mesh, by the three methods of (a) the previous DT-based method [17], (b) the presented DT-based method in Section 2.2, and (c) the presented EFLT method in Section 2.3. Note that the circled parts on the three pictures demonstrate that (b) and (c) have a much higher sensitivity to show the variation of the thickness around the tumor than (a), and furthermore (c) is some more sensitive than (b). (d) The same color bar as used in Fig. 10.
Fig. 12.
Demonstration of the consistency between the original segmented data and the visualization of the thickness mapping in Fig. 11. Picture (a) shows a section of an image slice along the X-Z plane. The boundary of the darker part is the bladder wall inner border. Picture (b) is the generated 3D view of the bladder wall inner border as shown in the pose corresponding to (a). Note that the regions marked by blue rectangles on both (a) and (b) indicate the same region as shown in Fig. 11(b). They together demonstrate the consistency: a small bump in a large basin. This consistency can also be observed by the region marked by the pink rectangles in both (a) and (b). By rotating the image volumes to another orientation for an image slice of (c) along the Y-Z plane, the generated 3D view of the bladder wall inner border is then shown by (d) in the pose corresponding to (c). The regions marked by blue rectangles in (c) and (d) indicate the same region as the one marked in (a), (b) and Fig. 11(b). This further demonstrates the consistency among them. (e) is the color bar same as used in Fig. 10 and 11.
In order to further compare the performances of the previous DT-based method and the presented EFLT method, three experts interpreted the nine bladder image volumes and scored their thickness mapping results. Each expert was presented with nine pairs of 3D visualization of the bladder wall thickness mapping results similar to those shown in Fig. 11(b) and 11(c), where each pair is regarding to a subject dataset. Within each pair, one is the outcome of the previous DT-based method and the other is from the EFLT method, but they were placed in random order and their identities are blinded from the experts. When each pair was displayed on the computer screen, the corresponding original image volume data was also displayed on side. The experts can inspect all the image slices in matched orientation to the 3D mapping result. The 3D thickness mapping results were then scored by the experts based on their consistencies against the original images, especially the consistencies of the local details and variations.
The scale for expert scoring is designed to be in the range of 0 (the worst) to 10 (the best) in order to quantify experts’ judgment of how accurately the 3D color mappings reflect the wall thickness variations on the bladder wall in the MR images. The experts were asked to score the results based on two aspects: (1) The correctness of both methods for the bladder wall thickness mappings. This is to see if a method miscalculates a thinner area as a thicker area and vice versa. (2) The accuracy of both methods for the thickness calculations. This is to see which method better reflects the details of the thickness, e.g., which method could differentiate the tiny thickness changes over an area while another one may treat them as a same thickness value. After inspecting the displayed three windows (two for the two methods and one for the raw images) on the computer screen and using some mouse/keyboard actions to review the image slices, the experts gave a final score to indicate their judgment on the results as a whole. The scores were then collected and compared.
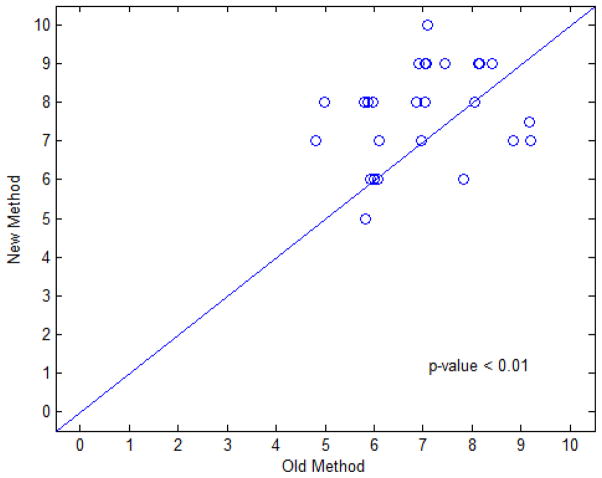
Figure 13 illustrates the pair-wise scatter plot of the scores for comparison of the EFLT method against the previous DT-based method. Among the 27 pairs of scores, there are 17, 5, and 5 pairs that the presented method was given greater, equal, and smaller scores than the previous method, respectively. Since most of the data points fall above the 45 degree concordance line in the scatter plot, thus it can be concluded that the presented EFLT method gets higher scores than the previous DT method and, therefore, has a better performance. The five pairs with smaller or inferior scores can be explained as follows. Though we explained to the experts to score based mainly on how accurately the 3D color mappings reflect the wall thickness variations on the bladder wall in the MR images, the experts (who have no related technical backgrounds but deep clinical medical image reading experience) tend to have a better overall impression on the ones with more uniform colors and thus give a higher score to them. In other words, the experts put more weights on the criterion of thickness uniformity, which led to some biased judgments over the sharpness of the thickness calculated from the new method. Also, the judgments from human reading are always subjective, so it is possible some unexpected bias occurs. The corresponding examples of the 5 pairs (with one overlap) are shown in the figure below. Overall the number of these inferior scores are much small than the number of favorable scores.
Fig. 13.
Scatter plot of experts’ scores on both thickness calculation methods. The horizontal axis represents the score of the DT-based method and the vertical axis represents the score of the EFLT method. Each point represents a pair of scores for both methods. The scatter plot used a Jitter plot technique, which allows multiple observations with the same plotted values to be observable on the plot by adding a small amount of random noises to the values [27].
In addition to the jitter plot of Fig. 13, the scores were also analyzed using a liner mixed effects model [28]. The random subject effect helps account for the correlations between evaluation scores from the same dataset. Fixed effects include two main effects of expert and method. This statistical analysis generated the p-values as shown in Fig. 13. The new method generated highly-significant higher score than the old method (p < 0.01). The corresponding difference between these two methods and its 95% confident interval are 0.72 (0.14, 1.30). The expert effect is not statistically significant (p = 0.69) and it seems that the variability due to different experts is relatively small and the scores from the three experts are consistent. It is noted that, given the small sample size limitation of available patient datasets, the above statistical power of the linear mixed effects model may be constrained. However, a retrospective study showed that the power of hypothesis testing on the effect of our new thickness calculation method could achieve at least 85% at a significance level of 0.05. In general, a statistical power of above 80% is sufficient for us to draw the conclusion that the proposed method is superior to the previous DT-based method.
The above phantom and clinical experiments reveal two important outcomes. Firstly, the phantom data study indicates that the DT-based methods (both the previous one [17] and the presented one in Section 2.2) are less sensitive in general cases and may completely lose sensitivities in some situations due to the distance dependency limitation, while the EFLT method tends to be more reliable in general cases. Secondly, the clinical data study demonstrates that because the presented DT-based method resolves the severe surface dependency limitation, its performance is noticeably improved. However, because of the distance dependency limitation, the presented DT-based method still shows some less sensitivity as compared to the presented EFLT method. Therefore, based on the two outcomes, two conclusions can be made: first, the presented EFLT method is more reliable than the DT-based methods; second, the presented DT-based method resolves the surface dependency limitation and therefore improves the sensitivity, but it still faces the distance dependency limitation and could not be competitive to the presented EFLT method.
3.5 Thickness distribution of a patient dataset
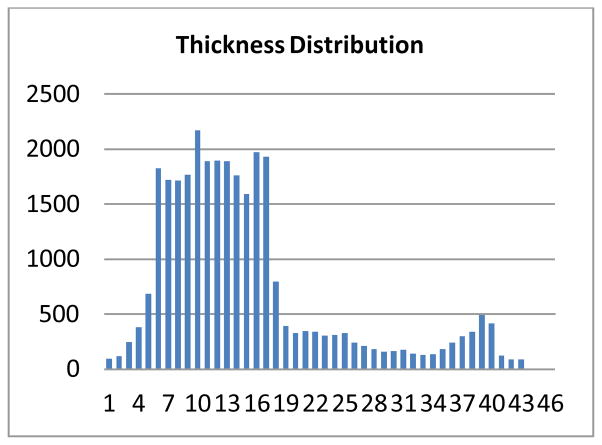
To help interpret the demonstrations in the above sections, we recorded the frequency of each thickness for all the calculated thicknesses by the EFLT method and computed the statistics for the patient dataset in Fig. 11. Figure 14 shows the computed statistics or histogram. Note that the calculated thicknesses are real numbers, so in order to obtain the statistics, we floored the real values to integers, i.e., the frequency at a thickness value n in the figure is actually representing a sum of all counts at the thickness values within the range [n, n + 1.0). The max thickness value is 47.55 voxel units. There are two peaks in the distribution. The one between 6 and 17 voxel units indicates the general thickness of the normal bladder wall. The other peak around 40 voxel units indicates the thickness of the tumor plus the wall.
Fig. 14.
The thickness distribution of the patient dataset of Fig. 10.
IV. Conclusion and Discussion
In this study, we analyzed in detail the limitations of the Distance Transform (DT)-based methods for bladder wall thickness calculation. The first limitation is referred as surface dependency and the second is referred as distance dependency. While the use of two surfaces will overcome the first limitation, the second limitation is inherent to the DT-based methods because of its utility on the iso-distance field model. To overcome all the limitations, we investigated an electrostatic iso-potential field model, which is inspired by the Charged Particle Model (CPM) [23] but is essentially different. In our case, the two segmented wall borders are assumed to have uniform distribution of charged particles: one border has positive charges and the other negative charges. In the implementation of the electrostatic iso-potential field model for the wall thickness calculation in discrete space, we used an Electric-field Line Tracing (EFLT) method. The accuracy of the EFLT depends on the step length of moving along the electric field lines. The smaller the step length, the smaller the discretization error it produces during the calculation procedure. An infinitesimal step length would produce the theoretical value, but requires infinite computational resources. To strike a balance between the calculation accuracy and computation efficiency, we proposed an adaptive step length strategy (equation (3)). We also conducted phantom experiments to determine an optimal step length, which suggests that 0.7 would be a potentially proper value for practical use. In addition, we further explored the use of Moving Least Squares (MLS)-based surface-fitting scheme [24] to minimize the discretization error caused by the discrete voxels on the two borders. The subsequent experiments on both phantom and clinical data demonstrated the feasibility of the EFLT with the adaptive step length strategy and the MLS-based surface-fitting scheme. Two conclusions can be drawn from the experiments. Firstly, the EFLT produces unique and non-intersecting paths that are sensitive to local structural variation between the inner and outer borders to measure the wall thickness at any position on each border. Secondly, the MLS surface-fitting produces a continuous border to facilitate the thickness mapping on a patient-specific bladder in a relatively efficient manner.
As our future research tasks, efforts will be devoted to increase the computational efficiency by either optimizing the calculation scheme (e.g., limiting charged particles to local geometry) or parallelizing the program execution (and use of GPU acceleration). Besides, efforts will be devoted to investigate more accurate or efficient surface-fitting methods. More importantly, efforts will be devoted to evaluate the presented thickness mapping on clinical studies for detection of abnormality by either experts or computer observers (or CAD).
Acknowledgments
This work was supported in part by the NIH/NCI under Grant #CA082402 and #CA120917, and by the NSF CCF-1081424: Volumetric Mesh Mapping, and IIS:III-0916286: Conformal Geometry for Computer Vision. C. Duan and H. Lu also were supported by the China NSFC under Grant #81230035 & #81271664, and the China Postdoctoral Science Foundation under Grant # 201104115. We appreciate Dr. Lihong Li, Mr. Qin Lin, Mr. Lin Chen and Mr. Yihuan Lu for their assistance on image segmentation and processing, and Ms. Donna Carroll for English editing.
References
- 1.Siegel R, Naishadham D, Jemal A. Cancer statistics, 2013. A Cancer Journal for Clinicians. 2013;63:11–30. doi: 10.3322/caac.21166. [DOI] [PubMed] [Google Scholar]
- 2.Shaw ST, Poon SY, Wong ET. Routine urinalysis: Is the dipstick enough? The Journal of the American Medical Association. 1985;253:1596–1600. doi: 10.1001/jama.253.11.1596. [DOI] [PubMed] [Google Scholar]
- 3.Grossfeld GD, Carroll PR. Evaluation of asymptomatic microscopic hematuria. Urologic Clinics of North America. 1998;25:661–676. doi: 10.1016/s0094-0143(05)70055-0. [DOI] [PubMed] [Google Scholar]
- 4.Sievert K, Amend B, Nagele U, Schilling D, Bedke J, Horstmann M, Hennenlotter J, Kruck S, Stenzl A. Economic aspects of bladder cancer: what are the benefits and costs? World Journal of Urology. 2009;27:295–300. doi: 10.1007/s00345-009-0395-z. [DOI] [PMC free article] [PubMed] [Google Scholar]
- 5.Steiner GD, Trump DL, Cummings KB. Metastatic bladder cancer: Natural history, clinical course, and consideration for treatment. Urologic Clinics of North America. 1992;19:735–746. [PubMed] [Google Scholar]
- 6.Lamm DL, Torti FM. Bladder cancer. A Cancer Journal for Clinicians. 1996;46:93–112. doi: 10.3322/canjclin.46.2.93. [DOI] [PubMed] [Google Scholar]
- 7.Stav K, Leibovici D, Goren E, Livshitz A, Siegel YI, Lindner A, Zisman A. Adverse effects of Cystoscopy and its impact on patients’ quality of life and sexual performance. The Israel Medical Association Journal. 2004;6:474–478. [PubMed] [Google Scholar]
- 8.Vining DJ, Zagoria RJ, Liu K, StELTs D. CT cystoscopy: An innovation in bladder imaging. American Journal of Roentgenology. 1996;166:409–410. doi: 10.2214/ajr.166.2.8553956. [DOI] [PubMed] [Google Scholar]
- 9.Fenlon HM, Bell TV, Ahari HK, Hussain S. Virtual cystoscopy: Early clinical experience. Radiology. 1997;205:272–275. doi: 10.1148/radiology.205.1.9314998. [DOI] [PubMed] [Google Scholar]
- 10.Liang Z, Chen D, Button T, Li H, Huang W. Feasibility studies on extracting bladder wall from MR images for virtual cystoscopy. Proc International Society of Magnetic Resonance in Medicine. 1999;3:2204. [Google Scholar]
- 11.Chen D, Li B, Huang W, Liang Z. A multi-scan MRI-based virtual cystoscopy. Proc SPIE Medical Imaging. 2000;3978:146–152. [Google Scholar]
- 12.Li L, Wang Z, Harrington D, Huang W, Liang Z. A Mixture-based computer aided detection system for virtual cystoscopy. Proc International Society of Magnetic Resonance in Medicine. 2003;1:146. [Google Scholar]
- 13.Hakenberg OW, Linne C, Manseck A, Wirth MP. Bladder wall thickness in normal adults and men with mild lower urinary tract symptoms and benign prostatic enlargement. Neurourol Urodyn. 2000;19(5):585–93. doi: 10.1002/1520-6777(2000)19:5<585::aid-nau5>3.0.co;2-u. [DOI] [PubMed] [Google Scholar]
- 14.Fielding JR, Hoyte L, Okon SA, Schreyer A, Lee J, Zou KH, Warfield S, Richie JP, Loughlin KR, O’Leary MP, Doyle CJ, Kikinis R. Tumor detection by virtual cystoscopy with color mapping of bladder wall thickness. The Journal of Urology. 2002;167:559–562. doi: 10.1016/S0022-5347(01)69085-2. [DOI] [PubMed] [Google Scholar]
- 15.Jaume S, Ferrant M, Macq B, Hoyte L, Fielding JR, Schreyer A, Kikinis R, Warfield SK. Tumor detection in the bladder wall with a measurement of abnormal thickness in CT scans. IEEE Transactions on Biomedical Engineering. 2003;50(3):383–390. doi: 10.1109/TBME.2003.808828. [DOI] [PubMed] [Google Scholar]
- 16.Kuhn A, Bank S, Robinson D, Klimek M, Kuhn P, Raio L. How should bladder wall thickness be measured? A comparison of vaginal, perineal and abdominal ultrasound. Neurourol Urodyn. 2010;29(8):1393–1396. doi: 10.1002/nau.20876. [DOI] [PubMed] [Google Scholar]
- 17.Zhu H, Duan C, Jiang R, Li L, Fan Y, Yu X, Zeng W, Gu X, Liang Z. Computer-aided detection of bladder tumors based on the thickness mapping of bladder wall in MR images. Proc SPIE Medical Imaging. 2010;7623:76234H1–8. [Google Scholar]
- 18.Jiang R, Zhu H, Zeng W, Yu X, Fan Y, Gu X, Liang Z. Bladder wall flattening with conformal mapping for MR cystography. Proc SPIE Medical Imaging. 2010;7625:76230E1–9. [Google Scholar]
- 19.Oelke M, Mamoulakis C, Ubbink DT, de la Rosette JJ, Wijkstra H. Manual versus automatic bladder wall thickness measurements: A method comparison study. World J Urology. 2009;27:747–753. doi: 10.1007/s00345-009-0392-2. [DOI] [PMC free article] [PubMed] [Google Scholar]
- 20.Duan C, Liang Z, Bao S, Zhu H, Wang S, Zhang G, Chen J. A coupled level-set framework for bladder wall segmentation with application to MR cystography. IEEE Transactions on Medical Imaging. 2010;29(3):903–915. doi: 10.1109/TMI.2009.2039756. [DOI] [PMC free article] [PubMed] [Google Scholar]
- 21.Schreyer A, Fielding JR, Warfield SK, Lee JH, Loughlin K, Dumanli H, Jolesz F, Kikinis R. Virtual CT cystoscopy: Color mapping of bladder wall thickness. Investigative Radiology. 2000;35(5):331–334. doi: 10.1097/00004424-200005000-00008. [DOI] [PubMed] [Google Scholar]
- 22.Zhao Y, Zhu H, Duan C, Gu X, Liang Z. A Precise calculation of bladder wall thickness for detection of bladder abnormalities via MR cystography. Nuclear Science Symposium and Medical Imaging Conference (NSS/MIC), 2011 IEEE; 2011. pp. 3153–3157. [Google Scholar]
- 23.Jalba AC, Wilkinson MHF, Roerdink JBTM. CPM: A deformable model for shape recovery and segmentation based on charged particles. IEEE Transactions on Pattern Analysis and Machine Intelligence. 2004;26(10):1320–1335. doi: 10.1109/tpami.2004.84. [DOI] [PubMed] [Google Scholar]
- 24.Levin D. Mesh independent surface interpolation. Geometric Modeling for Scientific Visualization. 2003;3:37–49. [Google Scholar]
- 25.Levin D. The approximation power of moving least-squares. Mathematics of Computation. 1998;67(224):1517–1531. [Google Scholar]
- 26.Lancaster P, Salkauskas K. Surfaces generated by moving least squares methods. Mathematics of Computation. 1981;37(155):141–158. [Google Scholar]
- 27.Chambers JM, Hastie TJ. Statistical Models in S. Wadsworth & Brooks/Cole; Pacific Grove, California: 1992. pp. 15–44. [Google Scholar]
- 28.Pinheiro JC, Bates DM. Mixed-Effects Models in S and S-PLUS. Springer; New York: 2000. pp. 4–52. [Google Scholar]


