

Abstract
We report the development of split-less nano-flow liquid chromatography mass spectrometric analysis of glycans chemically cleaved from glycoproteins in plasma. Porous graphitized carbon operating under reverse-phase conditions and an amide-based stationary phase operating under hydrophilic interaction conditions are quantitatively compared for glycan separation. Both stationary phases demonstrated similar column efficiencies and excellent retention time reproducibility without an internal standard to correct for retention time shift. The 95% confidence intervals of the mean retention times were ±4 seconds across 5 days of analysis for both stationary phases; however, the amide stationary phase was observed to be more robust. The high mass measurement accuracy of less than 2 ppm and fragmentation spectra provided highly confident identifications along with structural information. In addition, data are compared amongst samples derived from 10 healthy controls, 10 controls with a differential diagnosis of benign gynecologic tumors, and 10 diseased epithelial ovarian cancer patients (EOC). Two fucosylated glycans were found to be up-regulated in healthy controls and provided an accurate diagnostic value with an area under the receiver operator characteristic curve of 0.87. However, these same glycans provided a significantly less diagnostic value when used to differentiate EOC from benign tumor control samples with an area under the curve of 0.73.
Introduction
In disease research, the need for more sensitive and specific clinical markers and the modest success of proteomic and metabolomic studies to identify such markers has lead to the development of other more targeted avenues such as glycomics. Glycosylation, occurring in an estimated 50% of all translational products1, is one of the most critical post-translational modifications as glycosylation is known to regulate numerous biological processes including: adhesion, cellular recognition, and control of cell division, among others. In the late 1970’s Rostenberg et al.2 were the first to link aberrant protein glycosylation patterns to cancer. Later Gehrke and coworkers3 implicated changes in glycan abundance in epithelial ovarian cancer (EOC) by gas-liquid chromatography (GLC). More recently, other reports have further linked the critical role of glycosylation to cancer.4–8
Due to the asymptomatic nature of early-stage EOC (stage I and stage II), the disease is often diagnosed in the late stages (stage III and stage IV) where only 1 in 5 patients survive longer than 5 years. Although 80% of cases are diagnosed in the later stages, if detected early the disease is rendered more treatable and 5 year survival rates increase to ~90%.9, 10 The highly glycosylated CA-125 protein11 is a FDA approved blood test for the diagnosis of EOC; however, this marker lacks the sensitivity and specificity to be used either as an early warning marker or for population screening. Advancements in diagnosis are both critical for early intervention as well as a more in-depth understanding of this gynecologic malignancy such that therapeutic targets can be elucidated.
Recently investigations have taken a global glycan approach for biomarker discovery in which glycans from glycoproteins in serum were chemically or enzymatically released and purified. These samples were then analyzed by matrix-assisted laser desorption ionization (MALDI) mass spectrometry and studies have shown differences in the glycan patterns when comparing data from healthy and epithelial ovarian cancer,12 breast cancer,13, 14 as well as liver cancer serum.15 Preliminary studies by our research group, have also shown aberrant glycosylation in ovarian cancer plasma by matrix-assisted laser desorption ionization Fourier transform ion cyclotron resonance mass spectrometry (MALDI-FT-ICR-MS). However, the potential for post or in-source fragmentation of labile monomers by MALDI mass spectrometry is well known in the literature.16, 17 While this fragmentation aids in structural elucidation of a single component, it is detrimental to glycan profiling and discovery research where a multitude of species in complex biological matrixes already can complicate data interpretation. Concerned by observations of only neutral glycans comprised of hexoses (Hex) and N-acetylhexosamines (HexNAc) with no detection of glycans containing labile monomers by MALDI-FT-ICR-MS (e.g., sialic acids, fucose residues),13, 18 we directed our efforts towards the development of a nanoLC mass spectrometric method for profiling glycans in plasma. Variation in fucosylated and sialyated glycans have been thought to have direct implications on biological activity.19 Therefore, it is critical that the ability exists to detect, identify, and structurally characterize these species in biomarker discovery research. NanoLC coupled to orbitrap mass spectrometry provides a promising platform to accomplish such goals.
It is important to emphasize the necessity of nano-flow rates in glycan biomarker discovery. MALDI has long been the ionization source of choice for glycan analysis and has several advantages including higher throughput, more tolerance for contaminants, and, until recently, much more sensitive when compared to ESI. The lack of detectability in ESI is contributed to the hydrophilic nature and lack of basic sites characteristic of glycan structure. The hydrophilicity limits the surface activity of the species inside the electrospray droplet and ultimately leads to low ionization efficiency. This problem is mitigated by glycan derivatization by permethylation20, 21 or peracetylation.21, 22 Although these procedures increase ion abundance, they limit throughput and often lead to sample loss or contamination. With the continued development in pump technology, highly precise split-less nano-flow rates can be achieved, creating much smaller ESI droplets than conventional micro-spray. Smaller droplets lead to increased surface to volume ratios which corresponds to higher ionization efficiency and sensitivity for glycan analysis.23–27 Therefore, in glycan biomarker discovery research, where biologically relevant species may be at significantly low concentrations, low limits of detection are a necessity.
Although on-line liquid chromatography of glycans coupled to mass spectrometry is much less robust than the separation and analysis of peptides, the majority of literature reports the use porous graphitized carbon (PGC) for glycan separation.23, 24, 28–35 In addition, hydrophilic interaction chromatography (HILIC)36 a variant of normal phase chromatography and anion exchange chromatography have both shown potential for separation of glycans.36, 37 HILIC, an increasing popular separation technique, recently has been used for numerous glycan applications including: solid phase sample preparation of N-linked glycans38 and glycopeptides39, site specific glycosylation40, analysis of glycosaminoglycans41, 42 and glycosphingolipids.43
Herein, we report the development of a split-less nanoLC LTQ orbitrap mass spectrometric method for profiling underivatized glycans chemically cleaved from glycoproteins in plasma. Porous graphitized carbon operating under reverse phase conditions and an amide stationary phase operating under hydrophilic interaction conditions are quantitatively compared for the separation of glycans in plasma. High mass measurement accuracy along with MS/MS spectra afforded by the LTQ orbitrap provides confident identification and structural information. Glycan profiles of plasma proteins from 10 epithelial ovarian cancer patients, 10 controls with benign gynecologic tumors, and 10 completely normal individuals are compared using receiver operator characteristic (ROC) curves.
Experimental
Materials
Sodium borohydride (NaBH4), trifluoroacetic acid (TFA), 2,5-dihydroxybenzoic acid (2,5-DHB), formic acid, sodium chloride (NaCl), hydrochloric acid (37% HCl), sodium hydroxide (NaOH), mucin (porcine stomach; M1778), ammonium bicarbonate (NH4HCO3) and pronase E (6 U/mg) were purchased from Sigma Aldrich (St. Louis, MO). HPLC grade acetonitrile (ACN) and water were obtained from Burdick & Jackson (Muskegon, MI) and used as received. The N-linked glycan standard was purchased from Sigma Aldrich (St. Louis, MO). All plasma samples were provided by the Mayo Clinic (Rochester, MN).
Methods
Glycan Release
The procedure for glycan cleavage from glycoproteins using reductive β-elimination44 and purification of glycans has been described in detail elsewhere.18, 45 Briefly, 100 μL of plasma were injected into a dialysis cassette (Pierce, Rockford, IL) and dialyzed against 300 mL of nanopure water for 24 hours to remove salt and low molecular weight contaminants. The sample was then lyophilized at 35° C and 4 mg of dried plasma was transferred to a Falcon tube. The sample was subjected to reductive β-elimination (1 M NaBH4: 0.1 M NaOH) for 16 hours at 42° C. The reaction was quenched by adding 1 M HCl (pH~5).
Glycans were enriched using solid-phase extraction (SPE) with graphitized carbon cartridges (Alltech, Deerfield, IL). The plasma sample was loaded onto the SPE column and washed with water and glycans were then eluted with a 10% aqueous acetonitrile solution. Glycan elutions were dried and reconstituted in 40 μL of water. Finally to remove further peptide contamination, 5 μL of sample were subjected to pronase digestion for 4 hours at 37° C. Samples were then drop dialyzed (Millipore, Burlington, MA) against nanopure water for 2 hours. Resulting purified samples were stored at −20° C until analysis. This procedure is targeted towards O-linked glycans; however, as observed in our laboratory and reported in the literature, N-linked glycans are also released.13, 46–48
MALDI-FT-ICR Mass Spectrometry
Mass spectrometric analyses by MALDI were achieved using a ProMALDI ion source equipped with a 9.4 Tesla superconducting magnet (Varian Corporation, Palo Alto, CA). An Nd-YAG frequency tripled laser promoted desorption and ionization of analyte. All data processing and signal generation were performed by the Varian ZXP data station. The standard broadband sequence was utilized. Analyte was mixed with a solution of 2,5-DHB (100 mg/mL in 1:1: ACN/50 mM NaCl) in a 1:1 (v/v) ratio and 0.8 μL of the resulting mixture was placed onto a MALDI target (Applied Biosystems, Foster City, CA) and dried under a cold stream of air.49 The addition of NaCl to the MALDI matrix promoted sodium adducted glycan species which effectively enhances ionization efficiency.
NanoLC LTQ Orbitrap Mass Spectrometer
Nano-flow liquid chromatography was performed using an Eksigent nanoLC-2D system (Dublin, CA). Sample was injected into a 10 μL loop using the autosampler. To desalt the sample, material was flushed out of the loop and washed onto a trap at 2 μL/min. After approximately 10 trap washes the 10-port valve (VICI, Houston, TX) switched inline with the gradient. Concurrent to the 10-port valve switching, both the gradient (500 nL/min) and data collection commenced.
For separation using reverse-phase porous graphitized carbon (RP-PGC), glycans were washed and subsequently eluted from a Hypercarb 30 mm × 180 μM I.D. trap column (catalog # 35005-030215, Thermo Fischer Scientific, San Jose, CA) onto a 10 cm × 100 μm I.D. analytical Hypercarb column (catalog # 35005-100165, Thermo Fischer Scientific, San Jose, CA). Solvents A and B were 98/2 water/ACN and 2/98 water/ACN respectively; both contained 0.2 % formic acid. Solvent B was held at 2% for 3 minutes, ramped to 20% at 8 minutes, and held constant at 20 % for 32 minutes. At 45 minutes, solvent B increased to 80%, held constant for 5 minutes and ramped back down to re-equilibrate the column. The increase to 80% solvent B was performed to remove species that had a high affinity towards PGC.
For separation under hydrophilic interaction liquid chromatography (HILIC) conditions, glycans were eluted from a 75 μM ID PicoFrit capillary column (New Objective, Woburn, MA) with a 15 μM tip packed in-house (~10 cm) with 5 micron TSKgel Amide-80 material (Tosoh Biosciences, San Francisco, CA). For trapping, a ~4.5 cm self-packed, 15 cm total length, IntegraFrit (New Objective, Woburn, MA) was placed into the 10-port valve. Solvents A and B consisted of a 50 mM ammonium acetate buffer (pH 4.5) and 100% acetonitrile, respectively. The LC gradient was held at initial conditions (20/80 aqueous buffer/acetonitrile) for 3 minutes and ramped to 50% solvent A over 40 minutes where it was held constant for 5 minutes and brought down to initial conditions for equilibration for an additional 5 minutes. The total gradient time was 55 minutes.
The 10 healthy, 10 benign tumor control and 10 cancer samples (3 stage I, 3 Stage II, 2 Stage III, 2 Stage IV) were distributed throughout the run in order to minimize any measurement biases. The different stages were run in random order and were chosen for this experiment based on the ultimate goal of finding an accurate diagnostic marker regardless of disease progression. After every 4th sample, a standard mixture of glycans was run to evaluate both trapping efficiency and peak shape. A blank (mobile phase A) was run between each standard and sample to ensure no sample carry-over.
Mass spectrometric analyses were performed using a hybrid LTQ orbitrap mass spectrometer (Thermo Fischer Scientific, Brehmen, Germany). Electrospray ionization was initiated by applying 1.8 kV to a liquid junction pre-column. The capillary voltage and temperature were 42 V and 250°C respectively. Tube lens voltage was set to 150 V. External calibration was performed using the manufacture’s calibration mix. Lock mass calibration was implemented using m/z 610.1841, corresponding to the ammonium adducted polysiloxane [Si(CH3)2O]8 found in ambient air.50 For full scans, performed in the orbitrap, the AGC was set to 1×10⁶ with a maximum injection time of 1 s and a resolving power @ m/z 400 of 60,000. For MS/MS settings, five scans were performed in the ion trap per full scan at a normalized collisional energy of 24 with an AGC setting of 1 × 10⁴ and a maximum injection time of 400 ms. Dynamic exclusion time of 120 seconds was used to avoid repeated interrogation of abundant peaks.
Glycan identifications were performed using OSCAL software provided by Lebrilla and co-workers (Personal Communication) and GlycoWorkbench.51 SimGlycan 2 version 2.5.5 from Premier Biosoft International was used to aid in structural elucidation. Tandem MS spectra in conjunction with the intact masses were searched against all possible N- and O-linked glycans from glycoproteins in human plasma. Xcalibur software version 2.0.5 was used for data analysis and peak integration. In addition box plots were constructed using Analyze-It®, which is an add-in for Microsoft Excel®. ROC curves were generated using JMP® software version 7.0 from SAS Inc.
Results and Discussion
As mentioned, the analysis of glycans containing labile monomers (e.g., sialic acid and fucose residues) by MALDI, often results in fragmentation whether it be in-source or post-source decay. In FT-ICR mass analyzers, this event is more severe due to the long detection times associated with analysis relative to other mass analyzers. Reports have attempted to mitigate this problem in MALDI-FT-ICR-MS using high pressure nitrogen to collisionally cool the ions during the ionization event52, 53 or post-ionization in a high pressure hexapole region. However, Figure 1A demonstrates that fragmentation of glycans still remains a significant problem in MALDI-FT-ICR-MS as the analysis of a glycan standard yields no detectable intact species. Instead several losses of monomers from the intact molecule are observed and thus, yield a complicated mass spectrum. Several of these glycan fragments (Figure 1A) are also observed in the MALDI-FT-ICR mass spectrometric analysis of plasma12, 13, 18 indicating that these species in plasma are potentially fragments from higher molecular weight glycans. In addition, the plasma glycans identified by MALDI-FT-ICR mass spectrometry correspond to [M-H20+Na]+ species.12, 13, 18 The loss of water also suggest that these glycans correspond to B or Z fragment ions54 from a larger species. Under the same experimental conditions and across a similar molecular weight range, the analysis of glycans cleaved from Mucin, correspond to the intact sodiated species with no loss of water.45 It is important to note that laser power and voltages corresponding to detection were optimized for the MALDI mass spectrum shown in Figure 1A. It should be stated that matrices other than 2,5-DHB have been reported for more efficient desorption and ionization of intact acidic glycans by MALDI.55, 56
Figure 1.

The analysis of a standard tri-sialyated glycan is compared between (A) MALDI-FT-ICR mass spectrometry and (B) nanoLC mass spectrometry. Even with hexapole cooling external to the ICR cell, no intact species is observed by MALDI-FT-ICR MS. The base peak corresponds to the loss of the three sialic acid residues. The fragmentation of the intact ion affords a complicated mass spectrum. Under LC conditions the intact species is present with no observed fragmentation.
The nanoLC orbitrap mass spectrum displays a signal corresponding to the 2+ and 3+ charge states of the intact species, with no observed fragmentation (Figure 1B). There were several ammonium adducts observed due to the ammonium acetate buffer used for analysis. This analysis was conducted under HILIC conditions using the amide stationary phase. Interestingly, this glycan was not observed under RP-PGC possibly due to the high affinity of anionic species with PGC as previously reported.30
Considering the fragmentation observed by MALDI and the softness of ESI it was essential that nano-flow liquid chromatographic methods be developed for glycan biomarker discovery. The importance of nano-flow rates cannot be overstated as reports indicate dramatic increase in glycan sensitivities by nano-flow ESI as opposed to higher flow rates.23–26 Figure 2 displays a comparison between hydrophilic interaction liquid chromatography (HILIC) (Figure 2A) and reverse-phase porous graphitized carbon (RP-PGC) (Figure 2B) for the analysis of glycans from plasma proteins. Even after the extensive sample preparation procedure, there were numerous peptide peaks in the glycan samples as shown by the base ion chromatograms for both stationary phases. We attribute the peaks to both the complex nature of plasma and to the possibility of pronase enzymatically digesting itself in the final stage of the sample preparation protocol. However, as shown by the extracted ion chromatograms (EIC), glycans were detected well above the limit of detection of the instrument. Also displayed are the numbers of theoretical plates, calculated using the Foley-Dorsey equation57 accounting for peak asymmetry, for each glycan peak between the different stationary phases. The column efficiencies were similar among the different glycans present. This is attributed to the increased retention and wider peak widths observed under HILIC conditions which offset each other in the theoretical calculation. Peak widths, at 10% height, eluted under reverse-phase conditions were between 0.5–0.75 minutes; while the same peaks had widths of between 0.75–1.25 minutes under HILIC conditions. Sialic acid containing glycans tended to give split peaks under RP-PGC conditions, as shown in Figure 2C. In addition, the glycan containing two sialic acids eluted over a much broader time window when compared to other glycan peaks under RP-PGC. This problem potentially could be rectified by further gradient and solvent optimization; however, Pabst et al. has recently reported issues with elution of sialyted glycans using RP-PGC.30
Figure 2.

A comparison between (A) an amide-based stationary phase operating under HILIC conditions with (B) PGC operating under RP conditions for the analysis of glycans derived from late stage EOC plasma. The complexity of the sample is demonstrated by the base ion chromatograms. The axis on the far left represents the relative abundance while the one on the right represents the gradient. Glycans eluted later under HILIC conditions than RP PGC. Extracted ion chromatograms for various glycans are also displayed along with the number of theoretical plates calculated using the Foley-Dorsey equation for each stationary phase.
Figure 3 compares the retention time reproducibility of two glycans in plasma between the different stationary phases. The data (n=20) used for construction of the box plots for comparison between the stationary phases were collected over a 5 day period. Overall, both stationary phases exhibited exceptional RT reproducibility given the complexity of the sample (Figure 2). The diamond represents the mean and the 95% confidence interval of the mean. The median of the data is represented by the line crossing the box while the notches in the box show the 95% confidence interval of the median. The box also displays the upper and lower quartiles. The solid lines connect the nearest data points within 1.5 interquartile ranges (IQRs) of the lower and upper quartiles. The crosses (+) display the near outliers (between 1.5 and 3.0 IQRs away).
Figure 3.

Box plots comparing the retention time reproducibility of two different glycans in plasma. Overall both stationary phases exhibited excellent RT reproducibility given the complexity of the sample. For relative comparisons, each x-axis spans 0.5 minutes. Under HILIC conditions, the 95% confidence interval of the average retention times for peaks with m/z 813 and 966 were 30.75 min ± 2.2 sec and 33.51 min ± 1.8 sec, respectively. These species (m/z 813 and 966) under RP-PGC conditions, had averages and intervals of 11.93 min ± 2.5 sec and 16.14 min ± 4.1 sec respectively. Twenty points were used to construct each box plot and data were collected over a 5 day period. See text for further description of the box plots.
For direct comparisons amongst the data in Figure 3, each x-axis spans a time of 0.5 minutes. The 95% confidence interval of the average retention times for peaks with m/z 813 and 966, under HILIC conditions, were 30.75 min ± 2.2 sec and 33.51 min ± 1.8 sec, respectively. These species (m/z 996 and 813) under RP-PGC conditions, had averages and intervals of 11.93 min ± 2.5 sec and 16.14 min ± 4.1 sec, respectively. It is worth noting the importance of retention time reproducibility in glycan biomarker discovery research as it can be used for qualitative identifications and aid in structural elucidation.29 For example, glycans eluting later ~16 minutes under RP-PGC conditions usually indicated that the species contained at least 1 sialic acid. Due to the well known response biases in ESI of analytes in various solvent compositions, it is critical, for semi-quantitation studies that analytes elute in the same solvent composition across an experimental sample set.
Prior to discussing further results, the authors feel it is worth commenting on their experiences with the different stationary phases. As previously discussed, the majority of the literature reports the use of RP-PGC for glycan separation. However, we found two major problems with RP-PGC. In more than a few different situations and after several successful LC-runs, the subsequent run revealed an introduction of air bubbles into the system. These air bubbles had detrimental effects on the analyses as signal was lost for at least tens of seconds and often the ESI tip had to be cleared of solvent accumulation using compressed air. The only dynamic part of the system was the 10-port valve and autosampler and after ruling these parts out as the potential cause of air, we believe that the air may be a result of solvent out-gassing. This out-gassing may be a result of the porous nature of the stationary phase which created a significantly lower back pressure compared to a typical silica-based column. Efforts to thoroughly de-gas the solvents did not alleviate this problem.
The second problem discovered was the limited life-time of the PGC column, which leads to significant peak tailing and poor peak shape in our analyses. This limited life-time may be a result of the strong affinity of PGC towards various species. Attempts to clean and re-equilibrate the column using the manufacture’s organic wash were moderately successful. Interestingly, others have recently reported a similar finding.30 Due to these observations and to the comparable performance of the TSKgel AMIDE-80 stationary phase, all further results were collected under HILIC separation conditions.
Table I displays the compositions and mass measurement accuracies (MMA) of glycans identified in plasma. As shown several glycans were identified containing the labile fucose and sialic acid residues. Confident identifications were provided by both MS/MS spectra and by high MMA. For the majority, utilization of the lock mass feature50 provided MMAs of averages less than 1.6 ppm with upper confidence limits less than 1.8 ppm. It is important to note that all mass errors were positive, indicating some type of systematic error. Without the utilization of lock mass the MMA of standard glycans (n=60) were found to be significantly lower with an average and 95% confidence interval of 6.19 ± 0.23 ppm (data not shown). Similar glycan peaks were observed in healthy controls, benign tumor controls and EOC samples.
Displayed in Figure 4A is an extracted ion chromatogram (EIC) corresponding m/z 813 (4Hex:4HexNAc:1Fuc) from a healthy control sample. Overlaid on this spectrum is the EIC of m/z 813 from an EOC sample. Likewise, Figure 4B displays the same EOC sample overlaid with a benign tumor control. These spectra display the possibility that this fucosylated glycan is down-regulated in disease and benign tumor controls when compared to completely healthy controls. In addition, the MS/MS spectra displayed aid in the identification, provide structural information and due to their high similarity, ensure that the same species is being measured across all samples. The proposed structure of the glycan is also displayed and is consistent with the MS/MS spectra. Often times the core structure is fucosylated; however, due to the presence of a fragment at m/z 512 which corresponds to 1HexNAc:1Hex:1Fuc, we believe the fucose is attached to the non-reducing end of the glycan. The data was searched using SimGlycan 2 version 2.5.5 from Premier Biosoft International. This search program helped confirm our initial structural assignment as the proprietary search algorithms listed the structure shown in Figure 4 as the most likely match to the data.
Figure 4.

An example comparing the extracted ion chromatograms (m/z 813.3 ± 0.5) between healthy, benign tumor control and EOC plasma. The fucosylated glycan seems to be down-regulated in EOC and benign tumor control samples when compared to healthy. The MS/MS spectra provide structural information and ensure that the same species is measured across all samples. The structure is consistent with the MS/MS spectra. Fucose (triangle), Hexose (circle), N-acetylhexosamine (square).
Receiver operator characteristic (ROC) curves for two fucosylated glycans, both up-regulated in healthy samples, were constructed and are displayed in Figure 5A. Between healthy and EOC patients, m/z 813 (4HexNAc:4Hex:1Fuc) and m/z 914 (4Hex:5HexNAc:1Fuc) provided a moderately accurate diagnosis with areas under the curve (AUC) of 0.74 and 0.80 respectively. If both glycans are used to construct the ROC curve then the AUC increases to 0.87 and provides a sensitivity and specificity of 80% and 90%, respectively. This finding is significant as it suggests that utilizing multiple glycan markers increases diagnostic value. In addition, similar diagnostic accuracies were achieved when healthy was compared to benign tumor controls (Figure 5B). Interestingly, the fucose content of prostate specific antigen (PSA) has recently been reported to be higher in healthy plasma when compared to prostate cancer patients.58
Figure 5.
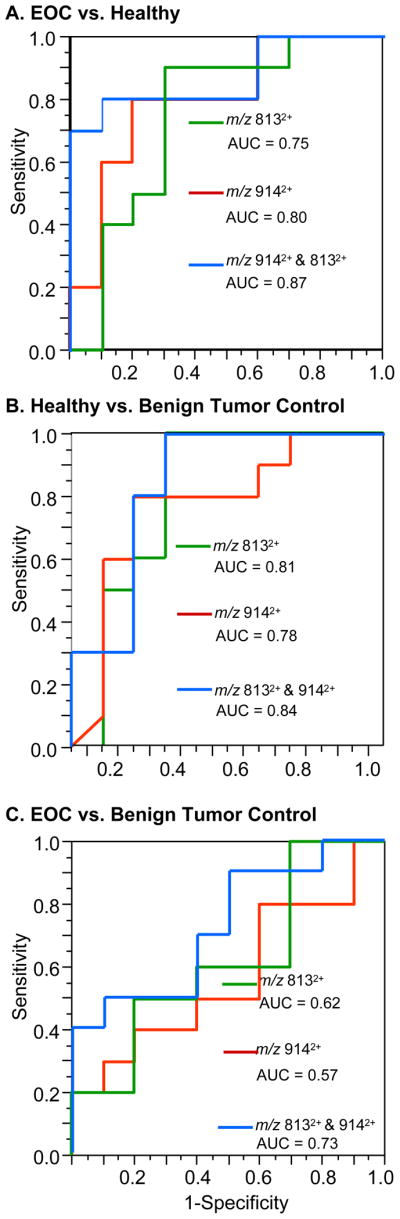
ROC analysis of (A) healthy vs. EOC, (B) healthy vs. benign tumor control, (C) benign tumor control vs. EOC samples for m/z 813 and m/z 914. These two glycans demonstrated accurate diagnostic values for distinguishing between healthy and both benign tumor control and EOC samples. Using both glycans significantly improved the area under the curve and thus the accuracy of the test. However poor values were observed when these species were used to distinguish benign tumor control and EOC sample.
However, these glycans demonstrated poor diagnostic values when used to compare the data between benign tumor controls and EOC samples as shown in Figure 5C. Glycans of m/z 813 and 914 gave AUCs of 0.62 and 0.57, respectively. Given these data, the glycans provide little accuracy in distinguishing EOC from benign tumor control. These results suggest that the markers may not be indicative of cancer but to some type of abnormal physiological process occurring within the body. The authors believe this finding is critical as it suggests that diagnostic markers discovered between healthy and disease states may not have the same value when used to diagnose cancer versus benign tumor controls, potentially leading to a false positive diagnosis. Nonetheless, if a tumor is present it would likely be removed regardless of whether it is benign or malignant.
Conclusions
In this work PGC and TSKgel Amide-80 stationary phases have been compared for the separation of glycans derived from plasma glycoproteins. Both RP-PGC and HILIC demonstrated excellent retention time reproducibility and similar column efficiencies. However, the amide stationary phase was found to be more robust. The high MMA afforded by the lock mass feature in addition to the MS/MS data provided confident identifications. Glycan patterns were similar across all disease, benign tumor control and healthy control samples. However, it was found that two fucosylated glycans were likely up-regulated in healthy samples when compared to cancerous and benign tumor control samples. These same glycans showed no diagnostic value when used to distinguish EOC from benign samples. Future work will entail a broader study and the analysis of glycans enzymatically released from plasma glycoproteins.
Table 1.
Summary of glycans Identified in plasma
| Measured m/z | Composition | MMA (ppm) 95 % CI N = 20 |
|---|---|---|
| *1235.4435a | 5Hex:2HexNAc | 2.12 ± 0.19 |
| 732.2802a | 3Hex:4HexNAc:1Fuc | 0.88 ± 0.16 |
| 782.312b | 2Hex:6HexNAc | 0.76 ± 0.17 |
| 813.3069a | 4Hex:4HexNAc:1Fuc | 1.01 ± 0.17 |
| 833.8203a | 3Hex:5HexNAc:1Fuc | 1.17 ± 0.14 |
| 863.3386b | 3Hex:6HexNAc | 1.01 ± 0.20 |
| 883.8521b | 2Hex:7HexNAc | 1.20 ± 0.22 |
| 914.847a | 4Hex:5HexNAc:1Fuc | 1.50 ± 0.16 |
| 964.8789b | 3Hex:7HexNAc | 1.26 ± 0.10 |
| 966.8528a | 5Hex:4HexNAc:1NeuAc | 1.50 ± 0.16 |
| 1045.9058b | 4Hex:7HexNAc | 1.59 ± 0.21 |
| 1112.4006a | 5Hex:4HexNAc:2NeuAc | 1.52 ± 0.13 |
Aldehyde form.
Alditol form. Masses correspond to 2+ charge state
1+ charge state
Acknowledgments
We thank Dr. Carlito Lebrilla’s laboratory for use of their glycan identification software (OSCAL) and for their assistance with β-elimination chemistry for O-glycan release from standard glycoproteins. We gratefully appreciate the financial support provided by National Institutes of Health (R33 CA105295), the W.M. Keck Foundation and North Carolina State University.
Literature Cited
- 1.Apweiler R, Hermjakob H, Sharon N. BBA-Gen Subjects. 1999;1473:4–8. doi: 10.1016/s0304-4165(99)00165-8. [DOI] [PubMed] [Google Scholar]
- 2.Rostenberg I, Guizarvazquez J, Penaloza R. J Natl Cancer Inst. 1978;61:961–965. [PubMed] [Google Scholar]
- 3.Gehrke CW, Waalkes TP, Borek E, Swartz WF, Cole TF, Kuo KC, Abeloff M, Ettinger DS, Rosenshein N, Young RC. J Chromatogr. 1979;162:507–528. [PubMed] [Google Scholar]
- 4.Casey RC, Oegema TR, Skubitz KM, Pambuccian SE, Grindle SM, Skubitz APN. Clin Exp Metastasis. 2003;20:143–152. doi: 10.1023/a:1022670501667. [DOI] [PubMed] [Google Scholar]
- 5.Dennis JW, Granovsky M, Warren CE. BioEssays. 1999;21:412–421. doi: 10.1002/(SICI)1521-1878(199905)21:5<412::AID-BIES8>3.0.CO;2-5. [DOI] [PubMed] [Google Scholar]
- 6.Hollingsworth MA, Swanson BJ. Nat Rev Cancer. 2004;4:45–60. doi: 10.1038/nrc1251. [DOI] [PubMed] [Google Scholar]
- 7.Hakomori S. Proc Natl Acad Sci U S A. 2002;99:10231–10233. doi: 10.1073/pnas.172380699. [DOI] [PMC free article] [PubMed] [Google Scholar]
- 8.Gorelik E, Galili U, Raz A. Cancer Metast Rev. 2001;20:245–277. doi: 10.1023/a:1015535427597. [DOI] [PubMed] [Google Scholar]
- 9. [Accessed October 2, 2008]; http://www.seer.cancer.gov/statfacts/html/ovary.html.
- 10.Williams TI, Toups KL, Saggese DA, Kalli KR, Cliby WA, Muddiman DC. J Proteome Res. 2007;6:2936–2962. doi: 10.1021/pr070041v. [DOI] [PubMed] [Google Scholar]
- 11.Wong NK, Easton RL, Panico M, Sutton-Smith M, Morrison JC, Lattanzio FA, Morris HR, Clark GF, Dell A, Patankar MS. J Biol Chem. 2003;278:28619–28634. doi: 10.1074/jbc.M302741200. [DOI] [PubMed] [Google Scholar]
- 12.An HJ, Miyamoto S, Lancaster KS, Kirmiz C, Li BS, Lam KS, Leiserowitz GS, Lebrilla CB. J Proteome Res. 2006;5:1626–1635. doi: 10.1021/pr060010k. [DOI] [PubMed] [Google Scholar]
- 13.Kirmiz C, Li BS, An HJ, Clowers BH, Chew HK, Lam KS, Ferrige A, Alecio R, Borowsky AD, Sulaimon S, Lebrilla CB, Miyamoto S. Mol Cell Proteomics. 2007;6:43–55. doi: 10.1074/mcp.M600171-MCP200. [DOI] [PubMed] [Google Scholar]
- 14.Kyselova Z, Mechref Y, Kang P, Goetz JA, Dobrolecki LE, Sledge GW, Schnaper L, Hickey RJ, Malkas LH, Novotny MV. Clin Chem. 2008;54:1166–1175. doi: 10.1373/clinchem.2007.087148. [DOI] [PubMed] [Google Scholar]
- 15.Isailovic D, Kurulugama RT, Plasencia MD, Stokes ST, Kyselova Z, Goldman R, Mechref Y, Novotny MV, Clemmer DE. J Proteome Res. 2008;7:1109–1117. doi: 10.1021/pr700702r. [DOI] [PMC free article] [PubMed] [Google Scholar]
- 16.Zaia J. Mass Spectrom Rev. 2004;23:161–227. doi: 10.1002/mas.10073. [DOI] [PubMed] [Google Scholar]
- 17.Harvey DJ. Mass Spectrom Rev. 1999;18:349–450. doi: 10.1002/(SICI)1098-2787(1999)18:6<349::AID-MAS1>3.0.CO;2-H. [DOI] [PubMed] [Google Scholar]
- 18.Williams TI, Saggese DA, Muddiman DC. J Proteome Res. 2008;7:2562–2568. doi: 10.1021/pr800066e. [DOI] [PubMed] [Google Scholar]
- 19.Viseux N, de Hoffmann E, Domon B. Anal Chem. 1998;70:4951–4959. doi: 10.1021/ac980443+. [DOI] [PubMed] [Google Scholar]
- 20.Ciucanu I, Kerek F. Carbohydr Res. 1984;131:209–217. [Google Scholar]
- 21.Dell A. Methods Enzymol. 1990;193:647–660. doi: 10.1016/0076-6879(90)93443-o. [DOI] [PubMed] [Google Scholar]
- 22.Bourne EJ, Stacey M, Tatlow JC, Tedder JM. J Chem Soc. 1949:2976–2979. [Google Scholar]
- 23.Karlsson NG, Wilson NL, Wirth HJ, Dawes P, Joshi H, Packer NH. Rapid Commun Mass Spectrom. 2004;18:2282–2292. doi: 10.1002/rcm.1626. [DOI] [PubMed] [Google Scholar]
- 24.Barroso B, Dijkstra R, Geerts M, Lagerwerf F, van Veelen P, de Ru A. Rapid Commun Mass Spectrom. 2002;16:1320–1329. doi: 10.1002/rcm.723. [DOI] [PubMed] [Google Scholar]
- 25.Bahr U, Pfenninger A, Karas M, Stahl B. Anal Chem. 1997;69:4530–4535. doi: 10.1021/ac970624w. [DOI] [PubMed] [Google Scholar]
- 26.Karas M, Bahr U, Dulcks T. Fresenius J Anal Chem. 2000;366:669–676. doi: 10.1007/s002160051561. [DOI] [PubMed] [Google Scholar]
- 27.Wuhrer M, Koeleman CAM, Deelder AM, Hokke CN. Anal Chem. 2004;76:833–838. doi: 10.1021/ac034936c. [DOI] [PubMed] [Google Scholar]
- 28.Koizumi K, Okada Y, Fukuda M. Carbohydr Res. 1991;215:67–80. doi: 10.1016/0008-6215(91)84013-5. [DOI] [PubMed] [Google Scholar]
- 29.Pabst M, Bondili JS, Stadlmann J, Mach L, Altmann F. Anal Chem. 2007;79:5051–5057. doi: 10.1021/ac070363i. [DOI] [PubMed] [Google Scholar]
- 30.Pabst M, Altmann F. Anal Chem. 2008;80:7534–7542. doi: 10.1021/ac801024r. [DOI] [PubMed] [Google Scholar]
- 31.Davies MJ, Smith KD, Carruthers RA, Chai W, Lawson AM, Hounsell EF. J Chromatogr. 1993;646:317–326. doi: 10.1016/0021-9673(93)83344-r. [DOI] [PubMed] [Google Scholar]
- 32.Itoh S, Kawasaki N, Hashii N, Harazono A, Matsuishi Y, Hayakawa T, Kawanishi T. J Chromatogr A. 2006;1103:296–306. doi: 10.1016/j.chroma.2005.11.043. [DOI] [PubMed] [Google Scholar]
- 33.Itoh S, Kawasaki N, Ohta M, Hyuga M, Hyuga S, Hayakawa T. J Chromatogr A. 2002;968:89–100. doi: 10.1016/s0021-9673(02)00951-2. [DOI] [PubMed] [Google Scholar]
- 34.Kawasaki N, Itoh S, Ohta M, Hayakawa T. Anal Biochem. 2003;316:15–22. doi: 10.1016/s0003-2697(03)00031-9. [DOI] [PubMed] [Google Scholar]
- 35.Hashii N, Kawasaki N, Itoh S, Hyuga M, Kawanishi T, Hayakawa T. Proteomics. 2005;5:4665–4672. doi: 10.1002/pmic.200401330. [DOI] [PubMed] [Google Scholar]
- 36.Alpert AJ. J Chromatogr. 1990;499:177–196. doi: 10.1016/s0021-9673(00)96972-3. [DOI] [PubMed] [Google Scholar]
- 37.Simpson RC, Fenselau CC, Hardy MR, Townsend RR, Lee YC, Cotter RJ. Anal Chem. 1990;62:248–252. doi: 10.1021/ac00202a005. [DOI] [PubMed] [Google Scholar]
- 38.Ruhaak LR, Huhn C, Waterreus WJ, de Boer AR, Neususs C, Hokke CH, Deelder AM, Wuhrer M. Anal Chem. 2008;80:6119–6126. doi: 10.1021/ac800630x. [DOI] [PubMed] [Google Scholar]
- 39.Tajiri M, Yoshida S, Wada Y. Glycobiology. 2005;15:1332–1340. doi: 10.1093/glycob/cwj019. [DOI] [PubMed] [Google Scholar]
- 40.Wuhrer M, Koeleman CAM, Hokke CH, Deelder AM. Anal Chem. 2005;77:886–894. doi: 10.1021/ac048619x. [DOI] [PubMed] [Google Scholar]
- 41.Hitchcock AM, Yates KE, Costello CE, Zaia J. Proteomics. 2008;8:1384–1397. doi: 10.1002/pmic.200700787. [DOI] [PMC free article] [PubMed] [Google Scholar]
- 42.Naimy H, Leymarie N, Bowman MJ, Zaia J. Biochemistry. 2008;47:3155–3161. doi: 10.1021/bi702043e. [DOI] [PMC free article] [PubMed] [Google Scholar]
- 43.Zarei M, Kirsch S, Muthing J, Bindila L, Peter-Katalinic J. Analytical and Bioanalytical Chemistry. 2008;391:289–297. doi: 10.1007/s00216-008-1932-0. [DOI] [PubMed] [Google Scholar]
- 44.Schiffman G, Kabat EA, Thompson W. Biochemistry. 1964;3:113. doi: 10.1021/bi00889a018. [DOI] [PubMed] [Google Scholar]
- 45.Williams TI, Saggese DA, Toups KL, Frahm JL, Joo An H, Lebrilla CB, Muddiman DC. J Mass Spectrom. 2008;43:1215–1223. doi: 10.1002/jms.1398. [DOI] [PMC free article] [PubMed] [Google Scholar]
- 46.Li B, Joo An H, Kirmiz C, Lebrilla CB, Lam KS, Miyamoto S. J Proteome Res. 2008;7:3776–3788. doi: 10.1021/pr800297u. [DOI] [PubMed] [Google Scholar]
- 47.Guerardel Y, Balanzino L, Maes E, Leroy Y, Coddeville B, Oriol R, Strecker G. Biochem J. 2001;357:167–182. doi: 10.1042/0264-6021:3570167. [DOI] [PMC free article] [PubMed] [Google Scholar]
- 48.Ogata S, Lloyd KO. Anal Biochem. 1982;119:351–359. doi: 10.1016/0003-2697(82)90597-8. [DOI] [PubMed] [Google Scholar]
- 49.Williams TI, Saggese DA, Wilcox RJ, Martin JD, Muddiman DC. Rapid Commun Mass Spectrom. 2007;21:807–811. doi: 10.1002/rcm.2904. [DOI] [PubMed] [Google Scholar]
- 50.Olsen JV, de Godoy LMF, Li GQ, Macek B, Mortensen P, Pesch R, Makarov A, Lange O, Horning S, Mann M. Mol Cell Proteomics. 2005;4:2010–2021. doi: 10.1074/mcp.T500030-MCP200. [DOI] [PubMed] [Google Scholar]
- 51.Ceroni A, Maass K, Geyer H, Geyer R, Dell A, Haslam SM. J Proteome Res. 2008;7:1650–1659. doi: 10.1021/pr7008252. [DOI] [PubMed] [Google Scholar]
- 52.O’Connor PB, Mirgorodskaya E, Costello CE. J Am Soc Mass Spectrom. 2002;13:402–407. doi: 10.1016/S1044-0305(02)00351-3. [DOI] [PubMed] [Google Scholar]
- 53.O’Connor PB, Costello CE. Rapid Commun Mass Spectrom. 2001;15:1862–1868. doi: 10.1002/rcm.447. [DOI] [PubMed] [Google Scholar]
- 54.Domon B, Costello CE. Glycoconjugate J. 1988;5:397–409. [Google Scholar]
- 55.Papac DI, Wong A, Jones AJS. Anal Chem. 1996;68:3215–3223. doi: 10.1021/ac960324z. [DOI] [PubMed] [Google Scholar]
- 56.Snovida SI, Rak-Banville JM, Perreault H. J Am Soc Mass Spectrom. 2008;19:1138–1146. doi: 10.1016/j.jasms.2008.04.033. [DOI] [PubMed] [Google Scholar]
- 57.Foley JP, Dorsey JG. Anal Chem. 1983;55:730–737. [Google Scholar]
- 58.Tabares G, Radcliffe CM, Barrabes S, Ramirez M, Aleixandre RN, Hoesel W, Dwek RA, Rudd PM, Peracaula R, de Llorens R. Glycobiology. 2006;16:132–145. doi: 10.1093/glycob/cwj042. [DOI] [PubMed] [Google Scholar]