

Abstract
Ribonucleotide reductases (RNRs) utilize radical chemistry to reduce nucleotides to deoxynucleotides in all organisms. In the class Ia and Ib RNRs, this reaction requires a stable tyrosyl radical (Y•) generated by oxidation of a reduced dinuclear metal cluster. The FeIII2-Y• cofactor in the NrdB subunit of the class Ia RNRs can be generated by self-assembly from FeII2-NrdB, O2, and a reducing equivalent. By contrast, the structurally homologous class Ib enzymes require a MnIII2-Y• cofactor in their NrdF subunit. MnII2-NrdF does not react with O2, but it binds the reduced form of a conserved flavodoxin-like protein, NrdIhq, which, in the presence of O2, reacts to form the MnIII2-Y• cofactor. Here we investigate the mechanism of assembly of the MnIII2-Y• cofactor in Bacillus subtilis NrdF. Cluster assembly from MnII2-NrdF, NrdIhq, and O2 has been studied by stopped flow absorption and rapid freeze quench EPR spectroscopies. The results support a mechanism in which NrdIhq reduces O2 to O2•− (40-48 s−1, 0.6 mM O2), the O2•− channels to and reacts with MnII2-NrdF to form a MnIIIMnIV intermediate (2.2 ± 0.4 s−1), and the MnIIIMnIV species oxidizes tyrosine to Y• (0.08-0.15 s−1). Controlled production of O2•− by NrdIhq during class Ib RNR cofactor assembly both circumvents the unreactivity of the MnII2 cluster with O2 and satisfies the requirement for an “extra” reducing equivalent in Y• generation.
1. INTRODUCTION
Ribonucleotide reductases (RNRs) catalyze the reduction of nucleotides to their corresponding deoxynucleotides and serve as the only de novo source of the deoxynucleotides required for DNA replication and repair for all organisms.1 RNRs are classified2 on the basis of the stable metallocofactor required for transient generation of a cysteine thiyl radical3,4 that initiates nucleotide reduction. In the cases of the structurally homologous class Ia and Ib RNRs, the oxidizing equivalent necessary for reversible thiyl radical generation is stored as a stable tyrosyl radical (Y•) in the enzymes’ β2 subunits. The essential Y• is generated by reaction of a reduced, dinuclear metal cofactor with an oxidant. In class Ia RNRs, the active cofactor is a diferric-Y• (FeIII2-Y•), which can be assembled in vitro and in vivo using O2 as oxidant.5,6 Although class Ib RNRs can also assemble an active FeIII2-Y• cofactor in vitro in their β2 subunits (NrdFs), we recently discovered that an active dimanganese(III)-Y• (MnIII2-Y•) cofactor can be generated as well.7 The relevance of the MnIII2-Y• cofactor in vivo has been demonstrated recently by purification of the NrdFs of Corynebacterium ammoniagenes,8 Escherichia coli,9 and Bacillus subtilis10 from their native organisms; this result is likely extendable to most or all class Ib RNRs.9 Unlike the FeII2 forms of the class Ia and Ib RNRs, the MnII2 form of NrdF is unreactive with O2,7,11 and MnIII2-Y• assembly in vitro requires a flavodoxin-like protein, NrdI, conserved in class Ib systems, in addition to O2.7 Here we report our efforts to elucidate the mechanism of, and essential role of NrdI in, MnIII2-Y• cofactor assembly in the B. subtilis class Ib RNR using stopped flow (SF) absorption and rapid freeze quench (RFQ) EPR spectroscopies.
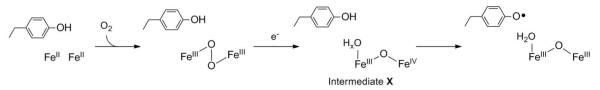
Extensive studies of the mechanism of FeIII2-Y• cofactor assembly12 in class Ia RNRs (Scheme 1) have provided a framework for thinking about the mechanism of MnIII2-Y• cofactor assembly. The FeIII2-Y• cofactor can be self-assembled in vitro from apo-β2, FeII, O2, and a reducing equivalent (Scheme 2A). The diferrous form of the protein reacts with O2 to generate a μ-peroxodiferric intermediate.13,14 This intermediate is reduced by a neighboring tryptophan residue to form a FeIIIFeIV intermediate, termed X,15-19 and a tryptophan cation radical (W+•).15,20,21 X is the species responsible for oxidation of the catalytically essential tyrosine (Y122 in E. coli class Ia RNR). In the presence of excess reducing equivalents (FeII, ascorbate, or thiols), this W+• does not accumulate.15 A protein factor, the ferredoxin YfaE in E. coli, is proposed to act as the donor of the extra electron in vivo.22
Scheme 1.
Mechanism of diferric-Y• cofactor assembly in class Ia RNRs.
Scheme 2.
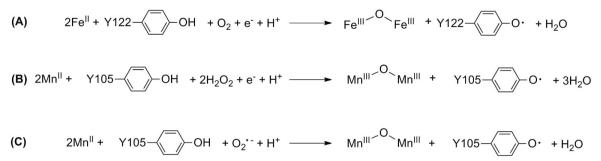
(A) Stoichiometry of diferric-Y• cofactor assembly in the E. coli class Ia RNR. (B) and (C) Proposed stoichiometries of dimanganese-Y• cofactor assembly in E. coli and B. subtilis class Ib RNRs with H2O2 and O2•− as oxidants.
Our previous results have provided the first and, to date, only insight into the mechanism of MnIII2-Y• cofactor assembly by demonstrating that this cofactor’s reconstitution in vitro requires the presence of MnII, O2, and the reduced (hydroquinone, hq) form of NrdI.7 Our studies of MnIII2-Y• assembly in E. coli suggested that NrdI reacts with O2 to generate an oxidant competent to oxidize the MnII2 cluster, and that this oxidant channels within a NrdI•NrdF complex from its site of production at the FMNH− cofactor of NrdI to the metal site in NrdF.7 The channeling proposal is supported by the crystal structure of the E. coli NrdI•MnII2-NrdF complex.23 NrdI can conceivably generate either HOO(H) (represented as H2O2 in Scheme 2B) or O2•− (Scheme 2C) as oxidant; previous experiments were unable to distinguish between these options.2,7
MnIII2-Y• cluster is assembled in vitro with the highest yields to date in B. subtilis NrdF (0.6 Y•/β2),10 providing an opportunity to monitor cluster assembly in this system by SF absorption and RFQ-EPR spectroscopies. The results of these studies, presented in this manuscript, strongly suggest that the oxidant is O2•−, produced by reaction of NrdIhq with O2, oxidizing NrdI to its neutral semiquinone form, NrdIsq. The first metal-centered intermediate observed is a MnIIIMnIV species, which is kinetically competent to oxidize tyrosine Y105 to Y•. This is the first catalytically relevant MnIIIMnIV dimer in biology, and the analogue to X in FeIII2-Y• cofactor assembly. With O2•− as oxidant, the exact number of oxidizing equivalents necessary for tyrosine oxidation is provided, and the neighboring W residue does not appear to be oxidized during this process. Thus, O2•− is an elegant solution to both the unreactivity of the MnII2 cluster with O2 and the need for three oxidizing equivalents for MnIII2 formation and tyrosine oxidation.
2. EXPERIMENTAL SECTION
2.1. General considerations
Chemical reagents and CuZn superoxide dismutase from bovine erythrocytes (SOD, 4000 U/mg) were obtained from Sigma-Aldrich at the highest purity available. Manganese concentrations were determined using a Perkin-Elmer AAnalyst 600 atomic absorption (AA) spectrometer and a Mn standard solution (Fluka). Iron quantification was carried out using the ferrozine method.24 SF experiments were carried out using an Applied Photophysics DX 17MV instrument with the Pro-Data upgrade, using a PMT detector. RFQ experiments were performed using an Update Instruments 1019 syringe ram unit and a model 715 syringe ram controller. In both cases, the temperature was maintained at 25 °C using a Lauda circulating water bath. The temperature of the isopentane bath for RFQ was maintained using a liquid N2 jacket and monitored using a Fluke 52II thermometer with an Anritsu Cu thermocouple probe. Calibrated EPR tubes (3.20 ± 0.01 inner diameter) were from Wilmad Labglass. For anaerobic experiments, protein solutions and buffers were degassed on a Schlenk line with 5-6 cycles (protein) or 3 cycles (buffer) of evacuation and refilling with Ar and then brought into an anaerobic chamber (MBraun) in a cold room at 4 °C. A small amount of precipitation of both NrdI and NrdF was observed upon degassing; the solutions were centrifuged in the anaerobic chamber before use.
2.2. Protein purification
N-terminally His6-tagged apoNrdF (tag: MGSSH6SSGLVPRGSH) was purified as previously described,10 with 1,10-phenanthroline added to the culture medium at 100 μM 20 min prior to induction.25 An additional chromatographic step was added to the published procedures to increase purity and remove minor DNA contaminants. Purifications were typically carried out starting from ~24 g cell paste (16-18 L growth). The eluent following Ni-NTA chromatography (10 mL column, 2.5 × 2 cm) was diluted 4-fold in 50 mM Tris, 5% glycerol, pH 7.6 (Buffer A) and loaded onto a Q Sepharose column (30 mL, 2.5 × 6.5 cm) equilibrated in Buffer A containing 150 mM NaCl, washed with 2 column volumes of the same buffer, and eluted with a 100 × 100 mL gradient of Buffer A containing 150-450 mM NaCl, and 2.5-3 mL fractions were collected. ApoNrdF eluted at 280-380 mM NaCl. The pooled fractions were concentrated and exchanged into 50 mM HEPES, 5% glycerol, pH 7.6 (Buffer B) using an Amicon Ultra 30 kDa MWCO centrifugal filtration device, yielding 7-8 mg/g cell paste. ApoNrdF concentrations (expressed per β2) were assessed using ε280 = 110 mM−1 cm−1.10 ApoNrdF contained <0.01 Mn/β2 and 0.02 Fe/β2 as purified.
N-terminally His6-tagged NrdI (tag: MGSSH6SSGLVPRGSH) was purified as described10 with minor modifications. Following Ni-NTA chromatography, the eluent was diluted 4-fold in 50 mM sodium phosphate, 5% glycerol, pH 7.6 and loaded onto an SP Sepharose column (10 mL, 2.5 × 2 cm), which was washed with 4 column volumes of Buffer B and eluted with Buffer B containing 200 mM NaCl. The eluted protein was concentrated and exchanged into Buffer B using an Amicon Ultra 10 kDa MWCO centrifugal concentrator.
2.3. Determination of the UV-visible spectra of NrdI in the oxidized (ox), sq, and hq forms
The extinction coefficient of oxidized NrdI at 449 nm in Buffer B was determined to be 12.3 mM−1 cm−1 by trichloroacetic acid precipitation as described.26,27 From this value, the spectra of the hq and sq forms were determined as described for E. coli NrdI.26
2.4. Preparation of NrdIhq, MnII-loaded NrdF, and O2-saturated buffer
Anaerobic solutions of NrdI (350-450 μM) were reduced by titration with a solution of sodium dithionite (5-6 mM in Buffer B), in a septum-sealed anaerobic cuvette fitted with a gastight syringe with repeating dispenser.26 Sodium dithionite was added in 1 μL aliquots and monitored spectrophotometrically (300-800 nm) until no further change occurred. There was <5% excess dithionite in the resulting NrdIhq solutions.
To a solution of ~450 μM apoNrdF, a solution of 3-10 mM MnCl2 in Buffer B (Mn concentration determined by AA spectroscopy) was added to a final concentration of 3.5 MnII/β2. The protein was incubated >5 min before use. For SF experiments, the solutions were aerobic, while for RFQ-EPR experiments, the procedure was carried out in an anaerobic chamber. We denote this protein “MnII-loaded NrdF” rather than “MnII2-NrdF” because titrations of apoNrdF with MnII monitored by EPR spectroscopy (Figure S3A) show that not all of the added MnII is bound under these conditions.
O2-saturated Buffer B (nominally 1.3 mM O228) was prepared immediately prior to use at 23 °C by sparging with 100% O2 in a vented container for 0.5-1 h. Where noted, SOD (section 2.1) was added to the buffer at a final concentration of 100-500 U/mL.
2.5. Fluorometric determination of the Kd for NrdIhq binding to MnII2-NrdF
Fluorescence titration studies were carried out using a Photon Technology International QM-4-SE spectrofluorometer equipped with FELIX software and 0.5 mm excitation and 0.75 mm emission bandwidth slits. The excitation wavelength was 380 nm and the emission data were acquired at 475-625 nm, with 1 nm steps and 0.5 s integration time.
All solutions were prepared in the anaerobic chamber. A typical experiment contained in a final volume of 700 μL: 1 μM apo-NrdF, 4 μM MnCl2, and 100 μM dithionite in Buffer B. Excess dithionite was added to ensure anaerobicity throughout the duration of the titration. This solution was placed in a semi-micro quartz fluorometer cell (10 mm pathlength, Starna Cells), which was sealed with a septum and screw cap. An airtight 50 μL Hamilton syringe containing 240 μM NrdIhq and 100 μM dithionite in Buffer B, fitted to a repeat dispenser, was inserted into the cuvette. The apparatus was removed from the glovebox and equilibrated at 23 °C for 5 min, and a baseline spectrum was recorded. NrdIhq was then added in 1 or 2 μL aliquots, the sample was mixed and equilibrated for 1 min, and the spectrum was recorded. The shutter was opened just before each scan and closed immediately after to minimize photobleaching. The final concentration of NrdIhq was 15 μM. Data were analyzed by the method of Eftink,29 described in detail in the Supporting Information (SI, section S1.1), and provided the stoichiometry of NrdI binding (n) and the Kd for its interaction with NrdF.
2.6. Kinetics of MnIII2-Y• cofactor assembly monitored by SF absorption spectroscopy
SF kinetics experiments were carried out at 25 ± 1 °C, maintained using a Lauda circulating water bath. The SF apparatus is in the open air; to minimize O2 contamination, the connections of the syringes were purged continuously before and during the experiment with N2, and prior to the experiment, the SF lines were rinsed with 10 mL 300 mM dithionite followed by 25-30 mL anaerobic Buffer B. In a typical experiment, 20 μM NrdIhq in Buffer B, prepared anaerobically in one gastight Hamilton syringe, was mixed in a 1:1 ratio with O2-saturated Buffer B (1.3 mM O2) and 500 U/mL (~0.1 mg/mL) SOD (section 2.1), or O2-saturated Buffer B and 50 μM MnII-loaded NrdF (3.5 MnII/NrdF), in a second syringe. The reaction was monitored at single wavelengths (340, 410, or 610 nm), 4-5 shots were collected and averaged, and the experiments were repeated 2 or 3 times. Reactions were also monitored from 310 to 700 nm in 10 nm intervals (one shot per wavelength, performed on five separate occasions and each data set analyzed independently). After blanking the instrument at each wavelength, a zero timepoint spectrum was obtained by mixing 20 μM NrdIhq 1:1 with anaerobic Buffer B. Global analysis of the multiwavelength SF data was carried out in KinTek Explorer v 3.0 with SpectraFit.30,31
For studies of the O2 dependence of the cluster assembly reaction, 25%, 50%, and 75% O2-saturated buffer (0.3, 0.6, and 0.9 mM O2) was prepared by drawing the appropriate amount of O2-saturated buffer into a gastight syringe containing anaerobic buffer. The contents were mixed and loaded immediately to the SF apparatus.
2.7. Kinetics of MnIII2-Y• cofactor assembly monitored by RFQ-EPR spectroscopy
In a typical experiment, MnII2-NrdF (150 μM, 3.5 MnII/β2) and NrdIhq (100 μM)32 in Buffer B in one syringe, prepared in the anaerobic box, was mixed with O2-saturated Buffer B in the second syringe in a 1:1 ratio at 25 °C and aged for a pre-determined time period (6 ms – 60 s) in the reaction loop. The reaction mixture (350-400 μL) was sprayed, using a drive ram velocity of 1.25-3.2 cm/s,33 into liquid isopentane at −140 ± 5 °C in a glass funnel attached to an EPR tube.34 The samples were packed into the EPR tubes using a stainless steel rod and stored in liquid N2 until analysis. Under these conditions, no decay of NrdIsq and the MnIIIMnIV intermediate was observed during storage for 1 month, but ~20-30% decay of both signals was observed over 7 months. The quench times stated in the Results (12 ms – 60 s) include the time required to pass through the reaction loop after mixing plus 6 ms for quenching (estimated as described in ref. 35). The packing factor for NrdF was determined to be 0.55 ± 0.03, using FeIII2-Y• NrdF in Buffer B, prepared as described.10
2.8. Determination of the UV-visible absorption spectra of the MnIII2 cluster and the Y•
2.8.1. Preparation of MnIII2-Y• NrdF
Protein solutions from 12-13 RFQ reactions quenched at ≥48 ms (section 2.7, 7 mL total volume) were recovered from the reaction loops, pooled, and incubated on ice for 30 min with 5 mM EDTA. The mixture was then loaded onto a Q Sepharose column (3 mL, 1 × 3.5 cm) preequilibrated in Buffer B containing 100 mM NaCl, and the column washed with 9 mL of the same buffer. NrdI eluted in the loading and wash fractions. NrdF eluted with 4 mL Buffer B containing 500 mM NaCl. Protein-containing fractions were pooled/concentrated and repeatedly diluted with Buffer B so that the concentration of NaCl was <10 mM. The isolated MnIII2-Y• NrdF contained 1.0 Mn/β2 and 0.36 ± 0.01 Y•/β2. Thus, for a reaction mixture containing 75 μM MnII-loaded NrdF and 50 μM NrdI, 75 μM Mn is oxidized, 27 μM Y• is generated, and 21 μM MnIII is not associated with Y•.
2.8.2. Reduction of Y• using hydroxylamine and extinction coefficient determination of MnIII2 cluster
Hydroxylamine and hydroxyurea reduce Y• and, albeit more slowly, the MnIII2 cluster.7 Thus, determination of the individual spectra of the MnIII2 cluster and Y• requires measurement of the UV-vis spectra of NrdF before and after hydroxylamine treatment, accompanied by determination of the Y• concentration by EPR spectroscopy and the Mn concentration by AA spectroscopy. The detailed procedure is given in section S1.2.
2.9. EPR spectroscopy
The concentrations of Y• and NrdIsq were determined on a Bruker EMX X-band spectrometer at 77 K using a quartz finger dewar. Analysis of Y• has been described.7 Analysis of the sq was carried out at 77 K using the following parameters: 9.34 GHz frequency, 5 μW power, 5 × 10⁴ gain, 100 kHz modulation frequency, 0.15 mT modulation amplitude, 5.12 ms time constant, 20.48 ms conversion time. Spin quantitation of both Y• and sq was carried out using an E. coli FeIII2-Y• NrdF standard calibrated against a CuII perchlorate standard.36
Other EPR spectra were measured at the CalEPR Center at the University of California, Davis. Continuous-wave (CW) X-band spectra were acquired with an ECS106 or E-500 spectrometer (Bruker, Billerica, MA) under non-saturating slow-passage conditions using a Super-High Q resonator (ER 4122SHQE). Cryogenic temperatures were achieved and maintained using an Oxford Instruments ESR900 liquid helium cryostat in conjunction with an Oxford Instruments ITC503 temperature and gas flow controller. Spectral simulations were performed with Matlab using the EasySpin 4.0 toolbox.37
Quantitation of the unpaired spin concentration within a sample was achieved by comparison of the double integral of the EPR intensity to that of a 308 μM CuII in 100 mM EDTA, pH 6.2. Due to the presence of multiple paramagnetic species in the RFQ samples, double integration of each of the individual components was not possible. In the case of the transiently generated MnIIIMnIV species, a simulated spectrum was scaled until the integrated intensity of peaks 11-14 (ca. 349, 358, 365, 373 mT, Figure 6) matched that of the experimental spectrum. The entirety of the scaled simulated spectrum was then doubly integrated and compared to the spin standard.
Figure 6.

Simulation of the EPR spectrum of the MnIIIMnIV intermediate. The spectrum was obtained by subtraction of a scaled spectrum of the MnII-loaded NrdF starting material from the spectrum of the RFQ mixture of 75 μM NrdF, 50 μM NrdI, and oxygenated buffer after 2 s aging time. Simulation of the spectrum was performed as described (section 2.9). Peaks 11-14 are labeled. Spectrometer settings: temperature: 10 K; microwave frequency = 9.38 GHz; power = 20 μW; modulation amplitude = 0.5 mT; modulation frequency = 100 kHz; sweep rate = 5.3 mT/s. The off-scale feature at ~330 mT is due to NrdIsq.
2.10. Determination of rate constants of NrdI comproportionation and disproportionation by SF absorption spectroscopy
NrdI was reduced by anaerobic titration with sodium dithionite as described26 and the SF apparatus was prepared as described in section 2.6. In a typical experiment, one syringe contained 20 μM NrdIhq in Buffer B and the second contained 20 μM NrdIox either alone or with 80 μM apoNrdF. The reactions were monitored at 25 °C at 610 nm from 1.5 ms – 15 s or 1.5 ms – 200 s, respectively. At least three replicate traces were collected and averaged in three separate experiments and analyzed using KinTek Explorer v. 3.0 according to eq. 4 (section 3.5).
2.11. Analysis of kinetics data
Nonlinear least-squares fitting of single wavelength data from SF and RFQ-EPR experiments to sums of single exponentials was carried out using Origin (Microcal) or KaleidaGraph (Synergy Software). All other kinetic analysis used KinTek Explorer v. 3.0 with SpectraFit.30,31
3. RESULTS
3.1. Proposed model for MnIII2-Y• assembly
Here, we describe rapid kinetics studies using SF absorption and RFQ-EPR spectroscopies, to determine the mechanism by which NrdI is involved in MnIII2-Y• cofactor assembly in the B. subtilis class Ib RNR. Our studies have led to the working model in Scheme 3. Specifically, our evidence described subsequently supports 1) rapid one-electron reduction of O2 by NrdIhq to generate O2•− (40-48 s−1); 2) slower formation of a MnIIIMnIV intermediate (2.2 ± 0.4 s−1) subsequent to O2•− production; and 3) decay of the MnIIIMnIV intermediate concomitant with Y• generation (0.08-0.15 s−1).
Scheme 3. Proposed mechanism of MnIII2-Y• cofactor assembly in B. subtilis NrdFa.

a Rate constants were measured in this study. The detailed structures of the proposed MnIIMnIII-OO(H) and MnIIIMnIV intermediates, as well as the oxidation state of NrdI when it dissociates from NrdF, are unknown. Mn at site 1 (Mn1) is closest to the Y that is oxidized, Mn2 is indicated in red.
3.1.1. Information required for experimental design and spectral deconvolution
To design the SF and RFQ-EPR experiments that led to Scheme 3, a number of parameters were determined for the NrdI/NrdF system. First, the UV-vis absorption and EPR spectra (where appropriate) of starting materials and products were obtained. Second, a knowledge of the affinity between NrdIhq and MnII2-NrdF is required to maximize complex formation. Third, because minimal studies of the reaction of flavodoxins, and no studies of the reaction of NrdIs, with O2 have been reported, the reaction of NrdIhq with O2 was assessed. The results of these experiments are described first.
3.2. UV-visible absorption spectra of NrdI, MnIII2-NrdF, and Y•
Analysis of the SF data requires knowledge of the UV-vis absorption spectra of the stable redox states of NrdI and NrdF. The UV-vis absorption spectra of NrdI in hq, sq, and ox states are shown in Figure 1A. Because NrdI accumulates only 30% sq during anaerobic titration with sodium dithionite,10 the spectrum of NrdIsq was estimated by correlation of UV-vis and EPR spectra of solutions of NrdI partially reduced with known amounts of dithionite. The spectrum is similar to those of flavodoxins and other NrdIs.26,27,38 NrdIsq is entirely in the neutral form under the conditions used in all experiments (pH 7.6), based on UV-vis, EPR, and SF absorption experiments (section S2.1, Table S1, and Figure S1).
Figure 1.
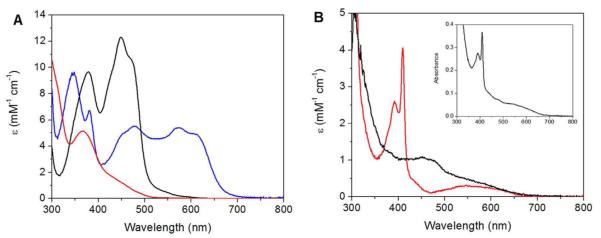
UV-vis absorption spectra of NrdI and NrdF. A) NrdIox (black), NrdIsq (neutral form, blue), and NrdIhq (red). The sq spectrum was estimated as described in section 2.3. B) The Y• (red) and MnIII2 cluster (black, εs given for cluster following Y• reduction) in NrdF, after removal of the the contribution of protein end absorption. Inset: 200 μM MnIII2-Y• NrdF, containing 1.0 Mn/β2 and 0.36 Y•/β2.
The UV-vis absorption spectrum of NrdF reconstituted with MnIII2-Y• cofactor is shown in the inset of Figure 1B. Figure 1B also shows the spectrum resolved into its two components, the MnIII2 cluster and the Y•. To obtain these spectra, MnIII2-Y• NrdF (200 μM) was incubated with hydroxylamine (0.5 mM) (sections 2.8 and S1.2). The deconvolution is complicated as Y• reduction is accompanied by slower reduction of the MnIII2 cluster.7 By 10 min, when Y• is fully reduced, ~60% of the Mn is also reduced, based on AA analysis of NrdF subsequent to chelation with EDTA and Sephadex G25 chromatography to remove MnII-EDTA. The spectrum of Y• was then determined by spectral subtractions and the quantification of Y• by EPR spectroscopy. The spectrum of the MnIII2 cluster exhibits a weak, broad feature at 460 nm with a shoulder at 485 nm, similar to the MnIII2 form of Mn catalase, whose active site is structurally related to that of the class I RNRs.39 The spectrum of Y• exhibits a diagnostic, sharp peak at 410 nm, a shoulder at 392 nm, and a broad feature from 470 to 670 nm. The analysis indicated that the UV-vis absorption spectrum intensity of the MnIII2 cluster increased by 190% upon reduction of MnIII2-Y• cofactor to MnIII2 cluster (Figure S2). Similar 2-3 fold changes in absorption intensities of biological Mn complexes have also been reported for anion binding to Mn superoxide dismutase40 (SOD) and for mutation of a tyrosine in the second coordination sphere of Mn catalase.41 These changes have been assigned to structural reorganizations, which suggests that, in NrdF, Y• reduction may alter the coordination sphere of the accompanying MnIII2 cluster. The absorption spectrum of MnII-loaded NrdF (not shown) is identical to that of apo-NrdF, featureless in the visible region.
3.3. EPR spectra of MnII-loaded NrdF, MnIII2-Y• NrdF, and NrdIsq
Characterization of the EPR spectra of MnII-loaded and MnIII2-Y• NrdF is important for the RFQ-EPR analysis of the cluster assembly reaction described below. The EPR spectrum of NrdIsq (77 K, Figure S1) is similar to previously described flavodoxin neutral sqs.42
3.3.1. MnII-loaded NrdF
Initially, NrdF was loaded with MnII following the protocol reported for E. coli NrdF,7 by incubation of the apoprotein with 4 MnII/β2 followed by passage through a Sephadex G25 column to remove unbound MnII. For E. coli NrdF, this procedure yielded protein with a complex, multiline (~40 lines) EPR signal with negligible amounts of mononuclear MnII.7 However, when this same protocol was followed for B. subtilis NrdF, its EPR signal revealed a substantial contribution from mononuclear MnII in addition to a signal associated with a coupled MnII2 cluster. Titrations of 75 μM apoNrdF with MnII, monitored by EPR spectroscopy at 10 K, show that the mononuclear MnII is present even at 1 MnII/β2 (Figure S3A). Measurements at 293 K, where only unbound MnII is detectable, suggest that <10% of the total MnII is unbound at 3.5 MnII/β2, whereas 20% is unbound at 4.0 MnII/β2. Therefore, to minimize the unbound MnII present, EPR samples were generally prepared using 3.5 MnII/β2 (Figure 2A). Similar titrations of E. coli apoNrdF exhibit negligible unbound MnII unless the MnII/β2 was greater than 3.5, indicating much stronger MnII binding than to B. subtilis NrdF (Figure S3B).
Figure 2.

X-band EPR spectra of (A) MnII-loaded NrdF (150 μM NrdF, 3.4 MnII/β2, acquired at 0.1 mW, 10 K), (B) MnIII2-Y• NrdF (0.1 mW, 10 K). Other acquisition parameters are described in section 2.9.
As for the MnII2 cluster of B. subtilis NrdF itself, the low-temperature X-band CW EPR spectrum possesses several resonances (Figures 2A, S4) across the explored field range (0—900 mT). The features at 270-300 and 380-440 mT show evidence of hyperfine structure with splittings of approximately 4.2 mT. Such a splitting pattern is consistent with nearly equal hyperfine interactions from two exchange-coupled 55MnII (I = 5/2) ions [A(55Mn) = 285 MHz, typically].43,44 As the temperature is raised, the total integrated intensity of the EPR spectrum increases (Figure S4, inset). This behavior indicates that the two MnII ions are antiferromagnetically coupled (i.e., that J < 0; using the Heisenberg-Dirac-van Vleck Hamiltonian for exchange Ĥ = —2JS1S2) and, at higher temperatures, higher energy spin manifolds on the spin-ladder become thermally populated at the expense of the EPR-silent ST = 0 ground spin level.
3.3.2. MnIII2-Y• NrdF
The EPR spectrum of B. subtilis MnIII2-Y• NrdF (10 K, Figure 2B) is similar to that of E. coli NrdF.7 The five-line pattern present in the low-temperature EPR spectra of the MnIII2-Y• cofactors of class Ib RNRs has been attributed to the interaction of Y• with the MnIII2 cluster.45 As the temperature is increased, the signal appears to collapse, yielding, at 100 K, what appears to be a spectrum of solely a Y• (Figure S5). Similar temperature-dependent behavior has been observed for a nitroxide coupled to a ferric-heme complex46 and for the acetate-inhibited S2-form of photosystem II (in this case, a Y• is coupled to a paramagnetic tetranuclear Mn cluster).47 With increasing temperature, the rate of electronic relaxation of the metal-based paramagnet increases and decouples this spin center from the nearby organic radical. This decoupling removes any contribution to the spectrum from dipolar and/or exchange interactions between the two spin centers. Thus, the high-temperature spectrum of NrdF described here is essentially that of Y• isolated from the MnIII2 cluster.
As a result of this decoupling, the structure evident in the 100 K spectrum can be assigned as hyperfine interaction (HFI) of the unpaired electron on tyrosine with four protons: those at the 3 and 5 positions of the phenoxyl ring, and the two bound to the β-carbon of the sidechain. To simulate this spectrum, the HFI for H3/5 were held fixed at values typically found for Y•s in class Ib RNRs (section S2.2).{Tomter, 2013 #132} The contribution to the spectrum by the two β-protons was determined using the McConnell relations by varying the value of the dihedral angle Θ49 until the simulated spectrum best-agrees with the experimental one.50 This was achieved with an angle of 44 (±2)°, slightly larger than the dihedral angles of 25 and 32° observed in the two chains of the crystal structure of B. subtilis MnII2-NrdF (see Figure S6 for a comparison of simulations achieved using these other values of Θ).51 This increase in dihedral angle observed for MnIII2-Y• compared to that found in the structure of the MnII2 form suggests that the phenoxyl plane has rotated with respect to the β-carbon upon oxidation of NrdF in the presence of NrdI and O2. Interestingly, in the crystal structure of the MnIII2 form of C. ammoniagenes NrdF, the tyrosine adjacent to the Mn cluster (Y115) has a dihedral angle of 40° and 42°, in the first and second chains, respectively.
3.4. Kd for NrdIhq and MnII2-NrdF
Knowledge of the affinity of NrdIhq for MnII2-NrdF is also important to maximize complex formation in the rapid kinetics studies described subsequently. To make this measurement, we took advantage of the previous observation that the hq forms of flavodoxins display weak fluorescence with a broad excitation maximum centered at ~370 nm and emission maxima in the 500-530 nm region.52 Our initial experiments demonstrated that the NrdIhq FMNH− cofactor displays similar fluorescence properties and that the intensity of its fluorescence emission spectrum is sensitive to the presence of NrdF (Figure S7A); this property was exploited to determine the Kd for NrdIhq binding to MnII2-NrdF. A control titration of B. subtilis NrdIhq with E. coli MnII2-NrdF exhibited no change in fluorescence, demonstrating that this method reports on specific NrdI-NrdF interaction. Titrations of MnII-loaded B. subtilis NrdF (1 μM, 4 MnII/β2) with NrdIhq were analyzed using a non-cooperative binding model, as described in the SI (section S1.1, Figure S7B). The analysis gives 1.6 ± 0.1 NrdIs per NrdF dimer with a Kd of 0.6 ± 0.2 μM. Figures 2A and S3A suggest that NrdF is not fully loaded with MnII under these conditions, but a similar Kd was obtained with apoNrdF. The unusual binding stoichiometry may therefore indicate error in the computationally derived extinction coefficient of NrdF,53 or that a fraction of NrdF is incompetent to bind NrdI. This Kd value is significantly lower than that previously reported for B. anthracis NrdIox•NrdF, 23 μM.54 The sequence similarity between the B. subtilis and B. anthracis systems (75% for NrdF, 63% for NrdI) suggests that the difference in Kds reflects tighter binding of NrdF to NrdIhq than to NrdIox. The Kd of 0.6 μM indicates that at the concentrations of NrdF and NrdIhq used in subsequent rapid kinetics experiments, >95% of NrdIhq is complexed.
3.5. Reaction of NrdIhq with O2 (± NrdF) monitored by SF absorption
Typical flavodoxins react with O2 to produce O2•−;55,56 however, based on the unusual redox properties of E. coli26 and B. subtilis10 NrdIs, we previously proposed that NrdIhq would react with O2 to produce H2O2. To resolve this issue, and as a prelude to our investigation of the kinetics of MnIII2-Y• cofactor assembly from NrdIhq, MnII2-NrdF, and O2, we initially investigated the kinetics of the reaction of NrdIhq alone with O2.
In these experiments, 20 μM NrdIhq and O2-saturated buffer (1.3 mM O2) were mixed in a 1:1 ratio at 25 °C, in the presence of 250 U/mL SOD, and the reaction was monitored by SF absorption spectroscopy from 310 to 700 nm at 10 nm increments. SOD was included to minimize kinetic complexity associated with production of O2•−, which can also react with NrdIhq and NrdIsq (section S2.3).56 Singular value decomposition (SVD) analysis of the data indicated significant contribution from three absorbing species: NrdIhq (E-FMNH− ), NrdIsq (E-FMNH•), and NrdIox (E-FMN). The data were fit using the global analysis software KinTek Explorer with SpectraFit in order to extract the spectra of these species. The ability to reproduce the known NrdIsq spectrum (Figure 1A) was one of the criteria used to judge the appropriateness of the kinetic model. The full analysis is described in section S2.3 (Figures S8A and S9). Three reactions (eq. 1-3) were required in the kinetic model to reproduce the known NrdIsq spectrum.
| (1) |
| (2) |
| (3) |
This model gives rate constants of k = 1.6 ± 0.1 mM−1 s−1, k2 = 2.0 ± 0.1 mM−1 s−1, and k3 = 0.7 ± 0.1 mM−1 s−1, for eq. 1, 2, and 3, respectively. Based on this model and the relative values of k1 and k3, 70% of NrdIhq reacts with O2 to initially form NrdIsq and O2•−. The NrdIsq then goes on to react with O2 to produce NrdIox and O2•−. Thirty percent of NrdIhq reacts by a second pathway to form NrdIox and H2O2.
To investigate whether complexation with NrdF affects the kinetics of NrdIhq oxidation, SF experiments were also carried out with NrdIhq (20 μM) mixed in a 1:1 ratio with O2-saturated buffer containing NrdF (50 μM, 98% complex), apo or MnII-loaded, and SOD. Unlike the reaction of NrdIhq with O2, these SF data could not be satisfactorily modeled by the reactions in eq. 1-3, although SVD again indicated the presence of only three spectrally distinct species. Therefore, we instead focused on the pseudo-first-order rate constants for NrdIsq formation and decay, which can be extracted directly from SF traces acquired at 610 nm, where only NrdIsq contributes significantly (Figures 1A and 3). NrdIsq formation is accelerated in the presence of apoNrdF and even further accelerated in the presence of MnII-loaded NrdF (Figure 3). Whereas the A610 SF traces for reaction of NrdIhq alone with O2 can be fit to a sum of two exponentials, those in the presence of NrdF are best fit to three exponentials, with two phases required for sq formation and one phase for sq decay (Table 1, Figure S10). We attribute the presence of two phases for sq formation to interaction of NrdI with conformationally heterogeneous populations of NrdF (note that even in the presence of MnII-loaded NrdF, only 80% of NrdF contains MnII2 cluster). The rate constants for the major phases (75-80% of total amplitude) of sq formation in the presence of apo- and MnII-loaded NrdF were 5 and 25 times faster, respectively, than that for NrdIsq formation in the absence of NrdF. The sensitivity of the rate constants for NrdIsq formation to the presence of NrdF and MnII suggests the relevance of eq. 1 to MnIII2-Y• cofactor assembly, discussed subsequently. By contrast, the rate constant for NrdIsq decay (eq. 2) was very similar in the presence and absence of NrdF (Table 1).
Figure 3.

Comparison of representative A610 traces for reaction of 20 μM NrdIhq mixed 1:1 with O2-saturated buffer containing no NrdF (black), 50 μM apo-NrdF (red), and 50 μM MnII-loaded NrdF (blue, 3.5 MnII/β2). The first and second reaction also contained SOD (100 U/mL). The reactions were carried out at 25 °C, pH 7.6. The small increase at >5 s in the blue trace is due to MnIII2-Y• cofactor assembly.
Table 1.
Apparent rate constants (amplitudes in parentheses) for the fits to the SF traces shown in Figure 3.
| Phase | k (s−1) | ||
|---|---|---|---|
|
| |||
| NrdIa | NrdI + apoNrdFa | NrdI + MnII-loaded NrdFb | |
| Sq formation (phase 1) | 1.6 (0.052) | 7.4 (0.026) | 42 (0.039) |
| Sq formation (phase 2) | NAc | 18 (0.009) | 5.4 (0.008) |
| Sq decay (eq. 2) | 1.1 (−0.053) | 0.93 (−0.035) | 0.85 (−0.049) |
100 U/mL SOD.
No SOD.
NA: not applicable (phase not observed)
Control experiments indicated that comproportionation and disproportionation reactions (eq. 4) of NrdI’s FMN cofactor were too slow to contribute significantly to the overall reactions of NrdI with O2 in the presence and absence of NrdF (section S2.4, Figure S11, Table S2). This observation indicates that the acceleration in NrdIsq formation in the presence of NrdF is due to an increase in k1, rather than a large increase in k3 followed by comproportionation. Therefore, the data suggest that the reaction of NrdIhq with O2 to produce NrdIsq and O2•− also predominates in the presence of apo- or MnII-loaded NrdF.
| (4) |
3.6. MnIII2-Y• cofactor assembly monitored by SF absorption and RFQ-EPR spectroscopies
The experiments described above provided the information required to design the central experiment: the reaction of NrdIhq with O2 in the presence of MnII-loaded NrdF, monitored by SF absorption and RFQ-EPR spectroscopies.57 The experimental design is challenging as it is necessary to minimize excess MnII, which interferes with the EPR analysis, and to maximize NrdIhq-NrdF complex formation, to avoid free NrdIhq reacting with O2. As described in section 3.3 (Figure S3A), adding 3.5 MnII/β2 to 75 μM apoNrdF strikes a balance between high metal loading of NrdF (3.2 MnII/β2 bound) and minimizing unbound MnII. With 75 μM MnII-loaded NrdF and 50 μM NrdIhq immediately after 1:1 mixing with O2-saturated buffer, >97% of NrdIhq is complexed to NrdF. As noted above, 0.36 Y•/β2 and 1.0 MnIII/β2 are produced (27 μM MnIII2-Y•, 11 μM MnIII2 not associated with Y•), whereas 2.2 MnII/β2 is not oxidized. These yields are important in interpreting the kinetics results. The same conditions were used for both SF and RFQ-EPR analyses.
Given the number of absorbing species and the complexity of their spectra, in the initial SF experiments, the reaction was monitored between 310 and 700 nm in 10 nm increments, as well as at 405 and 415 nm (to better resolve the Y•). The spectra reconstructed from the individual SF traces are shown in Figure 4 in three time regimes for clarity. Based on these results, we carried out a more detailed analysis of the kinetic traces at 610, 340, and 410 nm (Figure S12). At 610 nm, NrdIsq formation and disappearance predominated, along with a small contribution (~5% of total amplitude) from MnIII2 cluster and Y•. Analysis at 340 nm allowed detection of a MnIIIMnIV intermediate, and 410 nm was chosen as it is the λmax of the Y•; all three oxidation states of NrdI also contribute at these two wavelengths. In the following sections these results are used to formulate the mechanistic proposal for MnIII2-Y• cofactor assembly in Scheme 3 (all rate constants and amplitudes are in Table S3).
Figure 4.
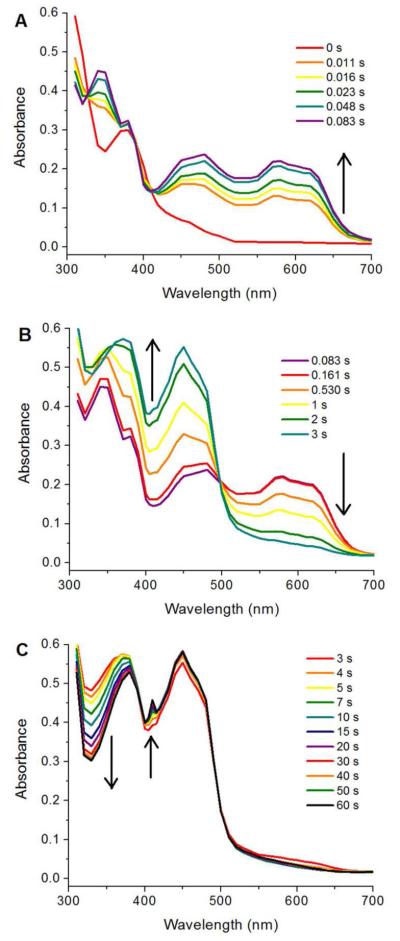
Reaction of 50 μM NrdIhq and 75 μM MnII-loaded NrdF with 0.6 mM O2, as monitored by SF absorption spectroscopy, divided into three time regimes: 0 – 0.083 s (A), 0.083 – 3 s (B), and 3 – 60 s (C). The spectra are point-by-point reconstructions from kinetic traces acquired every 10 nm between 310 and 700 nm, as well as 405 and 415 nm. One shot per wavelength is shown, but the data is representative of further experiments conducted at this and lower concentrations (10 μM NrdIhq, 25 μM MnII2-NrdF).
3.6.1. NrdIsq production and decay
The full spectrum analysis of the first time regime (83 ms) revealed NrdIsq formation at 610 nm and three isosbestic points, at 330, 390, and 415 nm, indicating direct conversion of NrdIhq to NrdIsq (Figure 4A). In the second and third regimes, NrdIsq decays by ~4 s to NrdIox, with an isosbestic point at ~500 nm. The plot of A610 (Figure 5, red trace, fit in black line), is fit best to four exponentials (Table 2, Figure S12A) – two increasing phases at 610 nm (NrdIsq formation), with rate constants of 40 s−1 (~75% of total NrdI) and 8 s−1 (~20%),58 followed by a decreasing phase of 0.65 s−1 (NrdIsq oxidation to NrdIox), and finally a small increase of 0.15 s−1 (MnIII2 and Y• formation, section 3.6.3).59
Figure 5.

Formation and decay of NrdIsq in the reaction of NrdIhq and MnII-loaded NrdF with O2, monitored by SF absorption and RFQ-EPR spectroscopies. NrdIsq was monitored by SF absorption spectroscopy at 610 nm (right axis, red line) and the trace fit to four exponentials (black line, Table 2). NrdIsq was quantified in RFQ timepoints (left axis, black squares) quenched at the indicated times by EPR spectroscopy (77 K, 5 μW). Note that NrdIsq does not reach zero concentration due to a contribution from Y• at >2 s timepoints, resulting in the smaller than expected amplitude for sq decay as determined by RFQ (Table 2). The two y-axes are scaled for direct comparison of the SF and RFQ-EPR data according to the extinction coefficient of NrdIsq at 610 nm, 4.9 ± 0.7 mM−1 cm−1.10
Table 2.
Apparent rate constants and amplitudes for the reaction of NrdIhq and MnII-loaded NrdF with O2, determined by fits to single-wavelength SF (610 nm) or RFQ-EPR (77 K) data in Figure 5.a
| Phase | SF, 610 nm | RFQ-EPR | |||
|---|---|---|---|---|---|
| k (s−1) | ΔA | Amplitude (μM) | k (s−1) | Amplitude (μM)b | |
| sq formation (phase 1) | 40 | 0.18 | 37 | 88 ± 38c | 34 ± 16c |
| sq formation (phase 2) | 8 | 0.05 | 10 | ||
| sq decay | 0.65 | −0.24 | 49 | 0.8 ± 0.2 | 27 ± 2 |
| MnIII2- Y• formation | 0.15 | 0.012 | 27 d | ||
Values represent the data from 3 traces (SF) or 2-4 experiments (RFQ-EPR). Similar rate constants were obtained in SF studies at lower NrdIhq and NrdF concentrations (Figure S13 and Table 1).
Adjusted for packing factor
The reaction is ~50% complete by the first timepoint, explaining the large uncertainty in these values (see text).
MnIII not associated with Y• is also produced in the assembly reaction. Assuming 27 μM MnIII2-Y• and 11 μM MnIII2 (section 2.8.1) gives ΔA = 0.011, in good agreement with the observed ΔA.
For comparison with the SF results, the reaction of NrdIhq with MnII-loaded NrdF and O2 under identical conditions was monitored by the RFQ method (12 ms – 60 s) and analyzed by EPR spectroscopy. NrdIsq can be quantified at 77 K, even in the presence of multiple Mn-derived signals and Y•, because its signal saturates at microwave powers orders of magnitude below the other paramagnetic species. The samples from 12 ms to 7 s were analyzed at 5 μW at 77 K and the results overlaid on the A610 trace of the SF reactions (Figure 5). The data show accumulation of 31 ± 5 μM sq at 83 ms – 20% lower than the maximal accumulation of NrdIsq as determined from the SF trace at 610 nm (38 μM).
The RFQ data can be fit to a two-exponential model with k1 = 88 ± 38 s−1 and k2 = 0.8 ± 0.2 s−1. The larger than expected value of k1 based on the SF data, and the large uncertainty in k1 and its amplitude, reflect the observation that the NrdIsq formation reaction is 50% complete by the first timepoint (Figure 5).60 k2 agrees well with the rate constant for sq decay determined by SF absorption (Scheme 3). Thus, the SF and RFQ-EPR data are in agreement that ~60-70% NrdIhq reacts with O2 at ~40-60 s−1 61 to form NrdIsq and O2•−. This rate constant is ~5 times faster than that of the major phase of NrdIsq formation in the presence of apoNrdF (7.4 s−1) and ~40 times faster than the rate constant for NrdIsq formation in the absence of NrdF (1.6 mM−1 s−1; 1 s−1 at 0.6 mM O2).
3.6.2. Formation and decay of a MnIIIMnIV intermediate
The reconstructed spectra in Figure 4B in the 83 ms – 3 s regime are dominated in the visible region by the conversion of NrdIsq to NrdIox, with an isosbestic point at ~500 nm. Absence of the NrdIsq/NrdIox isosbestic point at ~350 nm (Figure 1A) indicates formation of an additional, UV-absorbing species; the 300-350 nm region displays significantly higher absorbance than can be attributed to NrdIox (Figure 1A). This absorbance is more clearly observed in the spectra from the 3-60 s regime, in which features in the 300-350 nm region decay as the sharp feature of the Y• grows in at 410 nm (arrows, Figure 4C). The A340 SF traces (Figure S12B, Table 3) suggest formation and decay of this UV absorbing feature at 2.5 and 0.08 s−1, respectively.
Table 3.
Apparent rate constants and amplitudes for MnIIIMnIV formation and decay in the reaction of NrdIhq, MnII-loaded NrdF, and O2, determined by fits to single-wavelength SF (340 and 410 nm) or RFQ-EPR (10 or 77 K) data.a
| Phase | 340 nm | 410 nm | RFQ-EPR | |||||
|---|---|---|---|---|---|---|---|---|
|
k (s−1) |
ΔA | Amplitude (μM) |
k (s−1) |
ΔA | Amplitude (μM) |
k (s−1) | Amplitude (μM) |
|
| MnIIIMnIV formation |
2.5 | 0.17 | 13 ± 4 b | NAc | NA | NA | 2.2 ± 0.4 | 19 ± 6d |
| MnIIIMnIV decay |
0.08 | −0.16 | 19 ± 8 e | 0.09 | 0.054 | 25 ± 8 e | 0.12 ± 0.02 |
22 ± 7d |
Values represent the data from 3 traces (SF) or 2-4 experiments (RFQ-EPR). Similar rate constants were obtained in SF studies at lower NrdIhq and NrdF concentrations (Figure S13).
For phases involving MnIIIMnIV formation or decay, we have assumed ε340 = 13 ± 4 mM−1 cm−1 and ε410 = 3 ± 1 mM−1 cm−1. These values were determined from Figure S14 on the basis of the estimated UV-vis spectrum of the intermediate and the quantification of the EPR spectrum of MnIIIMnIV by simulation at 3 timepoints (section 2.9).
NA: not applicable (not observable at this wavelength). Given that the MnIIIMnIV intermediate should contribute ~+0.07 to ΔA410 (Figure S14), it is probable that this phase was not resolved from that of sq decay in the fits because its rate constant for formation is somewhat similar to that for sq decay, and of the same sign (see Table S3).
Uncertainty includes uncertainties in fit and in concentration of MnIIIMnIV (~30%)
Concentrations of MnIII2-Y• (27 μM) and MnIII2 (11 μM) are taken as given (section 2.8.1)
The UV-visible spectrum of this species was estimated from the spectrum of the 2 s timepoint reconstructed from the SF data. At this timepoint, substantial intermediate is present, little Y• is apparent (Figure 4B) and NrdI is entirely in the sq and ox forms. After subtraction of the contributions of NrdIsq (13 μM, Figure 5), NrdIox (37 μM), and protein scattering, the relatively featureless spectrum with little visible absorption shown in Figure S14 was obtained. This spectrum is similar to that of the MnIIIMnIV form of Mn catalase62 and synthetic models.63
The identity of the intermediate was determined by analysis of the RFQ samples at 10 K, where possible EPR-active intermediates in cofactor formation (MnIIMnIII and MnIIIMnIV) may be observable. A spectral component that has 16 resonance lines is present in the X-band EPR data of RFQ reaction intermediates trapped between 12 ms and 30 s (Figure S15). These features are very similar to those of strongly exchange-coupled MnIIIMnIV dimers.64 Indeed, the best fit of this contribution to the 2 s spectrum (obtained after subtraction of a scaled spectrum of the starting material to remove the contribution from unreacted MnII-loaded NrdF) requires two 55Mn ions with effective HFI of [—465 —435 —310] MHz and [230 230 240] MHz for the MnIII and MnIV centers, respectively (Figure 6, section S2.5). These values are nearly identical to those determined for the superoxidized form of Mn catalase.64 Importantly, there is no spectroscopic evidence for the presence of a MnIIMnIII form of the cluster at any point in the reaction. Owing to the large intrinsic HFI for MnII centers as well as the larger projection factors, the EPR spectrum of an antiferromagnetically-coupled MnIIMnIII dimer is expected to be spread over a much larger field range than that typically observed for a MnIIIMnIV dimer.64
For the lowest field feature of the MnIIIMnIV multiline signal, there is a noticeable shift upfield from 270.1 mT to 271.3 mT as the reaction progresses (see Figure S15). Additional changes in spectral lineshape are also observed for the highest field features. These small perturbations of the effective 55Mn HFI likely result from changes in either the exchange coupling parameter J, or in the MnIII zero-field splitting constant, possibly due to a change in protonation state of a bridging oxo group or a solvent-derived ligand to the MnIII ion, respectively.
In order to quantify the MnIIIMnIV intermediate and determine its rates of formation and decay, we first used the intensity of peak 14 at ~373 mT (Figure 6) to estimate the relative concentrations of the MnIIIMnIV species at each timepoint. The results of this analysis are plotted in Figure 7, fit to rate constants of 2.2 ± 0.4 s−1 and 0.12 ± 0.02 s−1. The similarity of these rate constants to those from the SF analysis strongly suggests that the UV-absorbing intermediate and the EPR-active MnIIIMnIV are the same species. Interestingly, the rate constant for formation of MnIIIMnIV is 20 times slower than the rate of NrdIsq generation (section 4.3).
Figure 7.

Concentration of the MnIIIMnIV intermediate, followed by the peak to trough intensity of peak 14 (Figure 6). The data (black, mean ± SD for 2-4 independent experiments) are fitted to a two phase model (red) with rate constants given in Table 3.
The relative concentrations of the intermediate were then converted to absolute concentrations (Figure S16) by determination of a scaling factor between the peak intensities in Figure 7 and the concentrations of MnIIIMnIV obtained by quantitative simulations (30% uncertainty) of three of the RFQ samples (section 2.9). The presence of multiple paramagnetic species in the reaction mixture – MnII2-NrdF, MnII, NrdIsq, and Y• – requires that, before simulation of MnIIIMnIV, the contribution from unreacted MnII-loaded NrdF be subtracted from the spectra using the broad features centered at ~290 and 410 mT, outside the envelope of MnII, Y•, and NrdIsq (Figure 2A). As shown in Table 3 and Figure S16, the maximal concentration of MnIIIMnIV estimated by this method was 19 ± 8 μM, at ~1.5 s. While MnIIIMnIV could, in principle, be on pathway to form MnIII2-Y•, MnIII2 cluster, or both, the 19 ± 8 μM value most likely underestimates the amount of MnIIIMnIV formed, as the RFQ-EPR result underestimated the concentration of NrdIsq by 20% (Figure 5). This is consistent with the intermediate being a precursor to the 27 μM MnIII2-Y• cofactor formed under these conditions. This conclusion is supported by the kinetics of Y• formation, as described below.
In an effort to facilitate characterization and quantification of the MnIIIMnIV species, we also generated the Y105F mutant of B. subtilis NrdF (sections S1.3 and S2.6). This mutant bound MnII more tightly than wt NrdF did (Figure S17), but little fluorescence change was observed in titrations to determine NrdIhq/Y105F-NrdF affinity, indicating that NrdIhq bound MnII2-Y105F NrdF either weakly or incorrectly (Figure S18). SF studies monitoring reaction of NrdIhq and MnII2-Y105F NrdF with O2 revealed no evidence of a MnIII MnIV intermediate (Figure S19).
3.6.3. Y• generation
To determine the kinetics of Y• generation and whether the MnIIIMnIV intermediate is kinetically competent for its formation, the single wavelength trace at 410 nm, the λmax of the Y•, was fit to three exponentials (Figure S12C, Table 3, Table S3). The fastest phase, a small decrease at 48 s−1, is attributed to the oxidation of NrdIhq to NrdIsq (ε410s of these species differ by only 0.35 mM−1 cm−1, Figure 1A). The second and major phase is an increase with k = 0.74 s−1 and an amplitude consistent with oxidation of NrdIsq to NrdIox. The slowest phase (k = 0.09 s−1) is associated with the appearance of the sharp feature of Y• (Figure 4C). The observed amplitude of this phase is consistent with decay of 25 ± 8 μM MnIIIMnIV (Table 3). Because NrdIsq and/or MnIIIMnIV contribute significantly to the 77 K EPR spectra of all but the 30, 40, and 60 s RFQ samples, independent determination of the rate constant for Y• formation by EPR spectroscopy is problematic. However, the rate constants for MnIIIMnIV decay by RFQ-EPR (0.12 ± 0.02 s−1) and SF (0.09-0.15 s−1 at 340 and 610 nm) and Y• formation by SF (0.08 s−1 at 410 nm) are in agreement (Table 3). Therefore, despite the somewhat lower than expected maximal concentration of MnIIIMnIV determined by simulation of the RFQ-EPR data, the kinetic results together strongly suggest that the MnIIIMnIV intermediate is responsible for tyrosine oxidation to Y•.
3.6.4. Interpretation of the rate constant for NrdIsq decay
In all rapid kinetics experiments, regardless of the presence/absence of NrdF and as long as SOD is present, the rate constant for reaction of NrdIsq with O2 (eq. 2) is ~1 s−1 (Table 2). This rate constant is lower than that for MnIIIMnIV formation (2.2 ± 0.4 s−1), which suggests that the O2•− produced by NrdIsq oxidation is not involved in MnIIIMnIV generation and that O2•− generated by NrdIhq oxidation is predominantly responsible for MnII2 oxidation. Furthermore, the observation that the rate of NrdIsq oxidation is not accelerated in the presence of MnII-loaded NrdF also suggests that no further reducing equivalents, such as those required to reduce a tryptophan radical,20,21 are needed for cluster assembly. Thus O2•− provides the three oxidizing equivalents required for MnIII2-Y• cofactor generation.
4. DISCUSSION
4.1. Kinetic complexity in MnIII2-Y• cofactor assembly
Together, the SF and EPR results described in this manuscript strongly support the mechanistic model of MnIII2-Y• cofactor assembly in Scheme 3. Following a treatment of several of the complexities that have been encountered in the course of the analysis, we discuss each reaction in Scheme 3 in turn.
Interestingly, 31-37 μM NrdIsq is generated in the fastest phase of the cluster assembly reaction, in conditions that give 27 μM Y• and 75 μM Mn oxidized. Thus ~2 MnII are oxidized for every O2•− produced in the fast phase, which may suggest that all of the Mn oxidized is present in dinuclear MnIII2 clusters. It is not clear why Y• is only generated in ~70% of these clusters – but the analogous question in class Ia diferric-Y• assembly, in which only 1.2 Y•/β2 are generated despite oxidation of 3.6 Fe/β2, is also unanswered despite twenty years of mechanistic study.
The formation of substoichiometric levels of NrdIsq could be related to heterogeneity in NrdF due to incomplete/incorrect MnII binding or to NrdI’s ability to react with O2 by two pathways (eq. 1-3). Approximately 70% of NrdIhq reacts with O2 to form NrdIsq in the absence or presence of MnII-loaded NrdF, suggesting that the complexity may be the result of using NrdI stoichiometrically, whereas it likely acts catalytically in vivo based on the reported amounts of NrdI and NrdF in B. subtilis and E. coli.9,10 In vivo, NrdIhq can be rapidly regenerated by a NrdI reductase. This reductase has not been identified, but NrdI’s role as a one electron donor suggests that the reductant is likely flavodoxin (ferredoxin) reductase. A flavodoxin reductase has yet to be identified in B. subtilis. Interaction with the reductase may also influence the reaction of NrdIhq with O2 to favor O2•− production.
4.2. Reaction of NrdIhq with O2
The rate acceleration of NrdIhq oxidation in the presence of NrdF and O2 may be caused by positively charged residues we have previously noted on NrdF at the NrdI binding site (R196 and K27 in B. subtilis NrdF).23,51 Positively charged groups in the vicinity of the reactive C4a position of the flavin, thought to facilitate formation of the sq-O2•− pair, are key features of the active sites of many flavoproteins that react with O2 as part of their catalytic cycles.65 Our observed rate constants for reaction of NrdIhq with O2 in the presence of NrdF to form O2•− are comparable to the rate constants for reaction of many flavoprotein oxidases with O2.65
The reaction of NrdIsq with O2 in B. subtilis NrdI (0.65-0.8 s−1, 0.6 mM O2) is nearly two orders of magnitude slower than the reaction of the hq and insensitive to the presence of NrdF. The hq and neutral sq forms of NrdI (and flavodoxins in general) are protonated at the N5 position of the flavin, whereas the ox form is deprotonated at this position. Crystal structures of flavodoxins66 and NrdIs23,38,67 have revealed that a peptide loop region (the “40s loop” in B. subtilis) in the vicinity of C4a undergoes a conformational change upon flavin reduction to allow a hydrogen bond between N5H and a peptide backbone carbonyl. The proton transfer and accompanying conformational change are reasonable sources of a kinetic barrier to sq oxidation (e.g. ref. 68). This hypothesis is supported by the decrease in the rate constant for sq decay with decreasing pH (Table S1). The observation that the rate constant for NrdIsq oxidation is not significantly changed in the presence of NrdF indicates either that the conformational change and proton transfer are rate limiting even if NrdIsq is bound to NrdF, or that NrdIsq dissociates from NrdF before reacting with O2. Further studies are required to determine when in the course of the cluster assembly reaction NrdI dissociates from NrdF, as sq or ox.
4.3. Formation of the MnIIIMnIV intermediate
Having identified O2•− as the oxidant in our current studies, we suggest that O2•− oxidizes the MnII2 cluster by inner- or outer-sphere electron transfer, possibly coupled with proton transfer. It is also possible that superoxide is transported to the metal site in the protonated form, HO2• (pKa 4.9), analogous to the case of azide binding to hemerythrin, in which HN3 (pKa 4.75) is proposed to be the species that binds to the metal site.69 From our biochemical7 and crystallographic23 data on the E. coli class Ib system, we proposed that the oxidant channels from NrdI to the metal site via a hydrophilic tunnel within the NrdI•NrdF complex. The orientation of the channel suggests that (H)O2• would first encounter Mn2, the MnII site farthest from Y105.23,51 Therefore, we propose initial formation of a MnIIMnIII intermediate or MnIIMnIII-OO(H) adduct, with MnIII being at site 2. To cleave the O-O bond and generate a MnIIIMnIV intermediate similar to superoxidized Mn catalase (μ-oxo, μ-hydroxo bridged),64,70 a (hydro)peroxo-bridged MnIIMnIII species, possibly analogous to the μ-1,2-peroxodiferric intermediate proposed in class Ia RNR FeIII2-Y• cofactor assembly (Scheme 1),13 may be formed at least transiently.
A MnIIMnIII species that forms and accumulates should be detectable by UV-vis absorption and EPR spectroscopy. The UV-vis spectrum of the MnIIMnIII would be expected to be similar to that of the MnIII2 cluster (Figure 1B) but with half the extinction coefficient; the weak absorption features would be difficult to detect in our SF absorption experiments, overwhelmed by the flavin absorption bands. We see no evidence of a coupled MnIIMnIII intermediate from our RFQ-EPR analysis. Because of the presence of free MnII in the starting material, we cannot rule out the possibility of an uncoupled MnIIMnIII species, which would give rise to a signal resembling mononuclear MnII. However, there is a long window as MnIIIMnIV is formed an order of magnitude more slowly than the fast, major phase of NrdIsq generation. If the oxidation of the site 2 MnII to generate a MnIIMnIII intermediate occurs and is similar to the analogous reaction in SOD, it is expected to be very fast (109 M−1 s−1 for MnII-SOD71). One explanation for our inability to detect this type of intermediate is that all steps between O2•− production and MnIIIMnIV formation may be rate-limited by a conformational change associated with the O2•− reaching the metal site. Based on crystal structures of MnII2-, FeII2-, MnIII2-, and FeIII2-NrdFs, and of the E. coli MnII2-NrdF•NrdIhq complex, we propose that this conformational change may be a reorganization of the αE helix of NrdF (Figure S20). This helix contains three completely conserved residues that undergo rearrangements accompanying oxidation of the metal site – two residues near the metal site (F162/168 and E158/164, E.coli/B.subtilis numbering), the latter being a ligand to Mn2, and one residue in the oxidant channel (Y163/Y169) that also forms part of the NrdI binding site. Movement of this helix connecting the metal site, channel, and NrdI binding site could ensure both that NrdI remains bound while O2•− is in the channel and that NrdI dissociates once O2•− reaches the metal site.
In our model, an important consequence of O2•− encountering and reacting with Mn2 initially is that the MnIV is at site 2 (Scheme 3), where the FeIV is proposed to reside in intermediate X,72 providing a close analogy between the tyrosine-oxidizing intermediates in FeIII2-Y• and MnIII2-Y• cluster assembly in class Ia and Ib RNRs. In addition, an analogy can be drawn to the formation of a MnIVFeIII cofactor in the class Ic RNR from Chlamydia trachomatis, in which the Y•−forming tyrosine is replaced by phenylalanine.73 In the class Ic RNR, a MnIIFeII cluster reacts with O2 to generate a MnIVFeIV intermediate, which decays slowly to the active MnIVFeIII cofactor.74 Recent studies suggest that Mn occupies site 1 and Fe site 2 in this cofactor.75,76 Thus, despite using different metallocofactors, all three class I RNRs have engineered their metal sites such that the site 2 metal is reduced by one electron in the conversion between the final intermediate and the active cofactor.
4.4. Tyrosine oxidation
The kinetic data indicate that MnIIIMnIV decays concomitant with Y• generation, suggesting that it is the oxidant directly responsible for tyrosine oxidation. This reaction is notable for its slow rate constant: 0.1 s−1 (25 °C), compared to 1 s−1 and 5 s−1 (both at 5 °C) for oxidation of tyrosine by X in E. coli and mouse class Ia RNRs, respectively.15,77 Although it is not known whether electron, proton, or coupled electron/proton transfer is rate-limiting for tyrosine oxidation in these systems, the very slow oxidation of tyrosine to Y• by a MnIIIMnIV intermediate may reflect its lower reduction potential compared to X, as has been suggested on the basis of calculations on other RNR systems.78
4.5. Concluding remarks
Comparison of the general mechanisms of MnIII2-Y• and FeIII2-Y• cofactor assembly (Schemes 1 and 3) demonstrates Nature’s elegant and efficient strategy to balance two inherent problems in enzymatic Y• generation: how to activate O2 and the need for an odd number of electrons for Y• generation. In FeIII2-Y• cofactor assembly, reaction of O2 with a FeII2 center is facile, but an extra electron is delivered after O2 activation to form the stable FeIII2-Y• cofactor. To our knowledge, only one biological MnII center has been suggested to be transiently oxidized by O2 at a physiologically relevant rate,79 and it does so with the help of an electron-donating co-substrate. In NrdF, the most efficient strategy for circumventing this problem is to deliver the extra electron as the first step in the process in the form of O2•−, with which MnII reacts readily. Reduction of O2 requires NrdIhq; efforts to assemble MnIII2-Y• using exogenous O2•− have been unsuccessful (section S2.7). Once O2•− is generated, the three oxidizing equivalents necessary for formation of the MnIIIMnIV intermediate and, subsequently, a Y• are present. This is a more economical mechanism than use of H2O2 as oxidant, which would require 2 O2 and 5 added reducing equivalents to form one Y• (Scheme 2).
An important question stemming from these results is how class Ib RNRs assemble both MnIII2-Y• and FeIII2-Y• cofactors, whereas class Ia RNRs assemble only FeIII2-Y• cofactors. The structural51 and mechanistic similarities between these systems suggest that the most incisive answer to this question may not be found at the metal site, but instead in the ways in which the unique difficulties of O2•− production and transport to the metal site have been solved for cluster formation in class Ib RNRs. Production of O2•− requires a specific accessory protein, NrdI. The oxidant channels23 in class Ib RNRs appear configured for transport of a hydrophilic molecule like O2•− or HO2• – distinct from the proposed O2 access route to the diferrous site in the class Ia RNRs, which is largely hydrophobic.80,81 Thus MnIII2-Y• cofactor assembly in the class Ib RNRs represents a remarkable example of how Nature has expanded the range of chemistry that can be performed by the dimetal-carboxylate structural motif, by creating and harnessing a normally deleterious oxidant for an essential cellular purpose.
Supplementary Material
ACKNOWLEDGMENTS
The work in the Stubbe lab was supported by National Institutes of Health Grant GM81393 to J.S. and a National Defense Science and Engineering Graduate Fellowship to J.A.C. The Mn EPR work in the Britt lab was funded by the Division of Chemical Sciences, Geosciences, and Biosciences, Office of Basic Energy Sciences of the U.S. Department of Energy through Grant DESC0007203 to R.D.B. We thank S.J. Lippard for use of his laboratory’s AA spectrometer, A.-F. Miller for helpful discussions related to the use of potassium superoxide in cluster assembly, and B.A. Palfey for a critical reading of a previous version of this manuscript. We are also grateful to A.K. Boal, who proposed the structural basis for the conformational change suggested to rate-limit MnIIIMnIV formation and who made Figure S20 to illustrate it.
Footnotes
Supporting information. Experimental details of the determination of the UV-vis spectra of the MnIII2 cluster and Y•; NrdI-NrdF Kd determination; expression, purification, and characterization of Y105F NrdF; EPR simulations; and attempts at cluster assembly using KO2; as well as Equations S1-S9, Tables S1-S3, and Figures S1-S20. This material is available free of charge via the Internet at http://pubs.acs.org.
REFERENCES
- (1).Nordlund P, Reichard P. Annu. Rev. Biochem. 2006;75:681–706. doi: 10.1146/annurev.biochem.75.103004.142443. [DOI] [PubMed] [Google Scholar]
- (2).Cotruvo JA, Jr., Stubbe J. Annu. Rev. Biochem. 2011;80:733–767. doi: 10.1146/annurev-biochem-061408-095817. [DOI] [PMC free article] [PubMed] [Google Scholar]
- (3).Licht S, Gerfen GJ, Stubbe J. Science. 1996;271:477–81. doi: 10.1126/science.271.5248.477. [DOI] [PubMed] [Google Scholar]
- (4).Licht S, Stubbe J. In: Comprehensive Natural Products Chemistry. Poulter CD, editor. Vol. 5. Elsevier Science; New York: 1999. pp. 163–203. [Google Scholar]
- (5).Atkin CL, Thelander L, Reichard P, Lang G. J. Biol. Chem. 1973;248:7464–7472. [PubMed] [Google Scholar]
- (6).Ehrenberg A, Reichard P. J. Biol. Chem. 1972;247:3485–8. [PubMed] [Google Scholar]
- (7).Cotruvo JA, Jr., Stubbe J. Biochemistry. 2010;49:1297–1309. doi: 10.1021/bi902106n. [DOI] [PMC free article] [PubMed] [Google Scholar]
- (8).Cox N, Ogata H, Stolle P, Reijerse E, Auling G, Lubitz W. J. Am. Chem. Soc. 2010;132:11197–11213. doi: 10.1021/ja1036995. [DOI] [PubMed] [Google Scholar]
- (9).Cotruvo JA, Jr., Stubbe J. Biochemistry. 2011;50:1672–1681. doi: 10.1021/bi101881d. [DOI] [PMC free article] [PubMed] [Google Scholar]
- (10).Zhang Y, Stubbe J. Biochemistry. 2011;50:5615–5623. doi: 10.1021/bi200348q. [DOI] [PMC free article] [PubMed] [Google Scholar]
- (11).Huque Y, Fieschi F, Torrents E, Gibert I, Eliasson R, Reichard P, Sahlin M, Sjöberg BM. J. Biol. Chem. 2000;275:25365–25371. doi: 10.1074/jbc.M002751200. [DOI] [PubMed] [Google Scholar]
- (12).Stubbe J, Riggs-Gelasco P. Trends Biochem. Sci. 1998;23:438–443. doi: 10.1016/s0968-0004(98)01296-1. [DOI] [PubMed] [Google Scholar]
- (13).Yun D, Garcia-Serres R, Chicalese BM, An YH, Huynh BH, Bollinger JM., Jr. Biochemistry. 2007;46:1925–32. doi: 10.1021/bi061717n. [DOI] [PubMed] [Google Scholar]
- (14).Tong WH, Chen S, Lloyd SG, Edmondson DE, Huynh BH, Stubbe J. J. Am. Chem. Soc. 1996;118:2107–2108. [Google Scholar]
- (15).Bollinger JM, Jr., Edmondson DE, Huynh BH, Filley J, Norton JR, Stubbe J. Science. 1991;253:292–298. doi: 10.1126/science.1650033. [DOI] [PubMed] [Google Scholar]
- (16).Ravi N, Bollinger JM, Jr., Huynh BH, Edmondson DE, Stubbe J. J. Am. Chem. Soc. 1994;116:8007–8014. [Google Scholar]
- (17).Bollinger JM, Jr., Tong WH, Ravi N, Huynh BH, Edmondson DE, Stubbe J. J. Am. Chem. Soc. 1994;116:8015–8023. [Google Scholar]
- (18).Sturgeon BE, Burdi D, Chen S, Huynh BH, Edmondson DE, Stubbe J, Hoffman BM. J. Am. Chem. Soc. 1996;118:7551–7557. [Google Scholar]
- (19).Shanmugam M, Doan PE, Lees NS, Stubbe J, Hoffman BM. J. Am. Chem. Soc. 2009;131:3370–3376. doi: 10.1021/ja809223s. [DOI] [PMC free article] [PubMed] [Google Scholar]
- (20).Bollinger JM, Jr., Tong WH, Ravi N, Huynh BH, Edmondson DE, Stubbe J. J. Am. Chem. Soc. 1994;116:8024–8032. [Google Scholar]
- (21).Baldwin J, Krebs C, Ley BA, Edmondson DE, Huynh BH, Bollinger JM., Jr. J. Am. Chem. Soc. 2000;122:12195–12206. [Google Scholar]
- (22).Wu C-H, Jiang W, Krebs C, Stubbe J. Biochemistry. 2007;46:11577–11588. doi: 10.1021/bi7012454. [DOI] [PubMed] [Google Scholar]
- (23).Boal AK, Cotruvo JA, Jr., Stubbe J, Rosenzweig AC. Science. 2010;329:1526–1530. doi: 10.1126/science.1190187. [DOI] [PMC free article] [PubMed] [Google Scholar]
- (24).Fish WW. Methods Enzymol. 1988;158:357–364. doi: 10.1016/0076-6879(88)58067-9. [DOI] [PubMed] [Google Scholar]
- (25).Parkin SE, Chen S, Ley BA, Mangravite L, Edmondson DE, Huynh BH, Bollinger JM., Jr. Biochemistry. 1998;37:1124–1130. doi: 10.1021/bi9723717. [DOI] [PubMed] [Google Scholar]
- (26).Cotruvo JA, Jr., Stubbe J. Proc. Natl. Acad. Sci. U.S.A. 2008;105:14383–14388. doi: 10.1073/pnas.0807348105. [DOI] [PMC free article] [PubMed] [Google Scholar]
- (27).Mayhew SG, Massey V. J. Biol. Chem. 1969;244:794–802. [PubMed] [Google Scholar]
- (28).Wilhelm E, Battino R, Wilcock RJ. Chem. Rev. 1977;77:219–262. [Google Scholar]
- (29).Eftink MR. Methods Enzymol. 1997;278:221–257. doi: 10.1016/s0076-6879(97)78013-3. [DOI] [PubMed] [Google Scholar]
- (30).Johnson KA, Simpson ZB, Blom T. Anal. Biochem. 2009;387:20–29. doi: 10.1016/j.ab.2008.12.024. [DOI] [PubMed] [Google Scholar]
- (31).Johnson KA, Simpson ZB, Blom T. Anal. Biochem. 2009;387:30–41. doi: 10.1016/j.ab.2008.12.025. [DOI] [PubMed] [Google Scholar]
- (32).These concentrations were chosen to simplify the kinetics of NrdI oxidation, rather than to maximize Y• yield (0.6 Y•/β2), see section 3.6.
- (33).Ballou DP. Methods Enzymol. 1978;54:85–93. doi: 10.1016/s0076-6879(78)54010-x. [DOI] [PubMed] [Google Scholar]
- (34).Bollinger JM, Jr., Tong WH, Ravi N, Huynh BH, Edmondson D, Stubbe J. Meth. Enzymol. 1995;258:278–303. doi: 10.1016/0076-6879(95)58052-2. [DOI] [PubMed] [Google Scholar]
- (35).Ballou DP, Palmer GA. Anal. Chem. 1974;46:1248–1253. [Google Scholar]
- (36).Malmström BG, Reinhammar B, Vanngard T. Biochim. Biophys. Acta. 1970;205:48–57. doi: 10.1016/0005-2728(70)90060-5. [DOI] [PubMed] [Google Scholar]
- (37).Stoll S, Schweiger A. J. Magn. Reson. 2006;178:42–55. doi: 10.1016/j.jmr.2005.08.013. [DOI] [PubMed] [Google Scholar]
- (38).Røhr ÅK, Hersleth H-P, Andersson KK. Angew. Chem. Int. Ed. 2010;49:2324–2327. doi: 10.1002/anie.200907143. [DOI] [PubMed] [Google Scholar]
- (39).Whittaker MM, Barynin VV, Antonyuk SV, Whittaker JW. Biochemistry. 1999;38:9126–9136. doi: 10.1021/bi990499d. [DOI] [PubMed] [Google Scholar]
- (40).Whittaker JW, Whittaker MM. J. Am. Chem. Soc. 1991;113:5528–5540. [Google Scholar]
- (41).Whittaker MM, Barynin VV, Igarashi T, Whittaker JW. Eur. J. Biochem. 2003;270:1102–1116. doi: 10.1046/j.1432-1033.2003.03459.x. [DOI] [PubMed] [Google Scholar]
- (42).Palmer G, Müller F, Massey V. In: Kamin H, editor. Flavins and Flavoproteins: Proceedings of the Third International Symposium on Flavins and Flavoproteins; Baltimore: University Press; 1971. pp. 123–140. [Google Scholar]
- (43).Epel B, Schäfer KO, Quentmeier A, Friedrich C, Lubitz W. J. Biol. Inorg. Chem. 2005;10:636–642. doi: 10.1007/s00775-005-0015-3. [DOI] [PubMed] [Google Scholar]
- (44).Golombeck AP, Hendrich MP. J. Magn. Reson. 2003;165:33–48. doi: 10.1016/j.jmr.2003.07.001. [DOI] [PubMed] [Google Scholar]
- (45).Cox N, Ogata H, Stolle P, Reijerse E, Auling G, Lubitz W. J. Am. Chem. Soc. 2010;132:11197–11213. doi: 10.1021/ja1036995. [DOI] [PubMed] [Google Scholar]
- (46).Fielding L, More KM, Eaton GR, Eaton SS. J. Am. Chem. Soc. 1986;108:8194–8196. [Google Scholar]
- (47).Szalai VA, Kuehne H, Lakshmi KV, Brudvig GW. Biochemistry. 1998;37:13594–13603. doi: 10.1021/bi9813025. [DOI] [PubMed] [Google Scholar]
- (48).Tomter AB, Zoppellaro G, Andersen NH, Hersleth HP, Hammerstad M, Røhr ÅK, Sandvik GK, Strand KR, Nilsson GE, Bell CB, III, Barra A-L, Blasco E, LePape L, Solomon EI, Andersson KK. Coord. Chem. Rev. 2013;257:3–26. [Google Scholar]
- (49).Θ corresponds to the dihedral angle between a vector that is normal to the phenoxyl plane and the β1-proton. The β2-proton is assumed to have a dihedral angle equal to 120°– Θ.
- (50).Svistunenko DA, Cooper CE. Biophys. J. 2004;87:582–595. doi: 10.1529/biophysj.104.041046. [DOI] [PMC free article] [PubMed] [Google Scholar]
- (51).Boal AK, Cotruvo JA, Jr., Stubbe J, Rosenzweig AC. Biochemistry. 2012;51:3861–3871. doi: 10.1021/bi201925t. [DOI] [PMC free article] [PubMed] [Google Scholar]
- (52).Ghisla S, Massey V, Lhoste J-M, Mayhew SG. Biochemistry. 1974;13:589–597. doi: 10.1021/bi00700a029. [DOI] [PubMed] [Google Scholar]
- (53).The extinction coefficient was calculated using ExPASy (see ref. 10). However, stoichiometries of metal binding are generally ~3.5 per dimer in β2 subunits purified to date.
- (54).Crona M, Torrents E, Røhr ÅK, Hofer A, Furrer E, Tomter AB, Andersson KK, Sahlin M, Sjöberg BM. J. Biol. Chem. 2011;286:33053–33060. doi: 10.1074/jbc.M111.278119. [DOI] [PMC free article] [PubMed] [Google Scholar]
- (55).Massey V. J. Biol. Chem. 1994;269:22459–22462. [PubMed] [Google Scholar]
- (56).Ballou DP. Ph.D. Thesis. University of Michigan; 1971. [Google Scholar]
- (57).SOD was not included in these experiments as initial studies demonstrated that the reaction rates were affected only at the highest concentrations of SOD, 250 U/mL, and then only slightly (Figure S8B). We attribute the negligible effect of SOD in the presence of MnII-loaded NrdF to O2•− channeling to the metal site rather than its reacting further with NrdI.
- (58).The monotonic increase in NrdIsq evident from the first ~160 ms of the multiwavelength SF data (Figure 4A) suggests that the 8 s−1 phase corresponds to a second, slower phase of NrdIsq formation. The amplitude of the 8 s−1 phase is too large to be attributable to formation of MnIIIMnIV intermediate, which does not absorb significantly at 610 nm (section 3.6.2), and 5 times too large to be attributable to formation of MnIII2 (ε610 = 0.25 mM−1 cm−1) or MnIII2-Y• (ε610 = 0.3 mM−1 cm−1).
- (59).Studies of the dependence of these rate constants on [O2] (Figure S13) indicated that the 40 s−1 NrdIsq formation and 0.65 s−1 NrdIsq decay phases exhibited O2 dependence, whereas the 8 s−1 NrdIsq rise phase did not. The latter observation is not understood at present but is likely related to reversibility of the reactions of NrdI with O2. As expected if a metal-centered intermediate precedes tyrosine oxidation, the rate constant for formation of MnIII2 cluster and Y• (~0.15 s−1 at 610 nm) was zero order in O2.
- (60).In support of the data fitting overestimating the value of k1, a half-time of 11 to 16 ms for NrdIsq formation corresponds to a rate constant of 43-63 s−1, in good agreement with the rate constant derived from the SF studies.
- (61).Note that, even if the other 30% of NrdIhq reacts with O2 to form H2O2 (the amplitudes of the SF fits suggest that all NrdIhq reacts to form O2•−, only 15 μM H2O2 would be produced under these reaction conditions. This amount of H2O2 could only generate 7.5 μM Y•, whereas 27 μM is produced. This indicates that O2•− is the primary, and probably only, oxidant involved in cluster assembly.
- (62).Khangulov SV, Barynin VV, Antonyuk-Barynina SV. Biochim. Biophys. Acta. 1990;1020:25–33. [Google Scholar]
- (63).Gelasco A, Kirk ML, Kampf JW, Pecoraro VL. Inorg. Chem. 1997;36:1829–1837. doi: 10.1021/ic970140i. [DOI] [PubMed] [Google Scholar]
- (64).Zheng M, Khangulov SV, Dismukes GC, Barynin VV. Inorg. Chem. 1994;33:382–387. [Google Scholar]
- (65).Gadda G. Biochemistry. 2012;51:2662–2669. doi: 10.1021/bi300227d. [DOI] [PubMed] [Google Scholar]
- (66).Hoover DM, Drennan CL, Metzger AL, Osborne C, Weber CH, Pattridge KA, Ludwig ML. J. Mol. Biol. 1999;294:725–743. doi: 10.1006/jmbi.1999.3152. [DOI] [PubMed] [Google Scholar]
- (67).Johansson R, Torrents E, Lundin D, Sprenger J, Sahlin M, Sjöberg BM, Logan DT. FEBS J. 2010;277:4265–4277. doi: 10.1111/j.1742-4658.2010.07815.x. [DOI] [PubMed] [Google Scholar]
- (68).Damiani MJ, Nostedt JJ, O’Neill MA. J. Biol. Chem. 2011;286:4382–4391. doi: 10.1074/jbc.M110.194696. [DOI] [PMC free article] [PubMed] [Google Scholar]
- (69).Meloon DR, Wilkins RG. Biochemistry. 1976;15:1284–1290. doi: 10.1021/bi00651a018. [DOI] [PubMed] [Google Scholar]
- (70).Teutloff C, Schäfer K-O, Sinnecker S, Barynin V, Bittl R, Wieghardt K, Lendzian F, Lubitz W. Mag. Reson. Chem. 2005;43:S51–S64. doi: 10.1002/mrc.1685. [DOI] [PubMed] [Google Scholar]
- (71).Pick M, Rabani J, Yost F, Fridovich I. J. Am. Chem. Soc. 1974;96:7329–7333. doi: 10.1021/ja00830a026. [DOI] [PubMed] [Google Scholar]
- (72).Bollinger JM, Jr., Chen S, Parkin SE, Mangravite LM, Ley BA, Edmondson DE, Huynh BH. J. Am. Chem. Soc. 1997;119:5976–5977. [Google Scholar]
- (73).Jiang W, Yun D, Saleh L, Barr EW, Xing G, Hoffart LM, Maslak MA, Krebs C, Bollinger JMJ. Science. 2007;316:1188–1191. doi: 10.1126/science.1141179. [DOI] [PubMed] [Google Scholar]
- (74).Jiang W, Hoffart LM, Krebs C, Bollinger JM., Jr. Biochemistry. 2007;46:8709–8716. doi: 10.1021/bi700906g. [DOI] [PMC free article] [PubMed] [Google Scholar]
- (75).Andersson CS, Öhrström M, Popović-Bijelić A, Gräslund A, Stenmark P, Högbom M. J. Am. Chem. Soc. 2012;134:123–125. doi: 10.1021/ja209678x. [DOI] [PubMed] [Google Scholar]
- (76).Dassama LM, Boal AK, Krebs C, Rosenzweig AC, Bollinger JM., Jr. J. Am. Chem. Soc. 2012;134:2520–2523. doi: 10.1021/ja211314p. [DOI] [PMC free article] [PubMed] [Google Scholar]
- (77).Yun D, Krebs C, Gupta GP, Iwig DF, Huynh BH, Bollinger JM., Jr. Biochemistry. 2002;41:981–90. doi: 10.1021/bi011797p. [DOI] [PubMed] [Google Scholar]
- (78).Roos K, Siegbahn PEM. J. Biol. Inorg. Chem. 2011;16:553–565. doi: 10.1007/s00775-011-0755-1. [DOI] [PubMed] [Google Scholar]
- (79).Gunderson WA, Zatsman AI, Emerson JP, Farquhar ER, Que L, Jr., Lipscomb JD, Hendrich MP. J. Am. Chem. Soc. 2008;130:14465–14467. doi: 10.1021/ja8052255. [DOI] [PMC free article] [PubMed] [Google Scholar]
- (80).Nordlund P, Eklund H. J. Mol. Biol. 1993;232:123–164. doi: 10.1006/jmbi.1993.1374. [DOI] [PubMed] [Google Scholar]
- (81).Kauppi B, Nielsen BB, Ramaswamy S, Larsen IK, Thelander M, Thelander L, Eklund H. J. Mol. Biol. 1996;262:706–20. doi: 10.1006/jmbi.1996.0546. [DOI] [PubMed] [Google Scholar]
Associated Data
This section collects any data citations, data availability statements, or supplementary materials included in this article.