

Abstract
It is well known that prostate cancer (PCa) occurs predominantly in the peripheral zone (PZ), whereas benign prostatic hyperplasia (BPH) typically develops in the transition zone. To identify possible mechanisms underlying zonal differences, we compared the effects of prostate stromal cells derived from the peripheral zone (PZsc) and the transition zone (TZsc) on a PCa epithelial cell line (PC3) in the presence of sex hormones. First, we observed that androgen receptor (AR) mRNA was more highly expressed in PZsc than TZsc when the cells were treated with dihydrotestosterone (DHT) and β-oestradiol (E2) (P<0.05). By ELISA, we looked for differences in the secretion of peptide growth factors from PZsc and TZsc. We found that keratinocyte growth factor (KGF) secretion increased with increasing concentrations of DHT (P<0.01) and was higher in PZsc than TZsc. Under treatment with DHT plus E2, PZsc secreted more transforming growth factor-β1 (TGF-β1) than TZsc, but this pattern was reversed when the cells were treated with E2 only. With increasing concentrations of DHT, insulin-like growth factor-1 (IGF-1) secretion increased in PZsc but decreased in TZsc. To further characterize the effects of PZsc and TZsc on PC3 cells, we developed a coculture model and performed MTT assays, Western blot analysis and real-time RT-PCR. We found that PZsc promoted PC3 cell proliferation and progression better than TZsc, particularly when treated with 10 nmol l−1 DHT plus 10 nmol l−1 E2. In conclusion, our data suggest that PZsc may have a greater capacity to induce PCa development and progression than TZsc via growth factors regulated by sex hormones. These findings provide possible mechanisms underlying zonal differences in prostate diseases, which may aid the search for novel therapeutic targets for PCa.
Keywords: androgen, growth factor, oestrogen, prostate cancer, stromal cell
Introduction
Prostate cancer (PCa) and benign prostatic hyperplasia (BPH) are among the most common diseases that affect elderly men. PCa occurs predominantly in the peripheral zone (PZ) of the prostate, whereas BPH typically develops in the transition zone (TZ).1, 2, 3, 4 The molecular mechanisms underlying this phenomenon are largely unknown. Several studies have shown that the expression of certain genes differs between these two zones.5, 6, 7, 8, 9 Feneley et al.10 reported that the epithelial content was significantly greater in the TZ than in the PZ. Conversely, concentrations of androgen receptor (AR) activity were higher in the PZ epithelium than in the TZ epithelium, but higher concentrations of oestrogen receptor activity were detected in the TZ zone stroma.10
The prostate is a hormone-responsive organ. Androgens play a vital role in prostate development, maintenance of tissue function and the pathogenesis of prostate disease. The stroma is a key mediator of androgenic effects on the epithelium and can regulate both the fate of the epithelial cells and potentially the initiation and progression of PCa. Prostatic epithelial cells are dependent on androgen-responsive stromal cells for development, differentiation and survival.11 Thus, alterations in the stromal microenvironment are sufficient to promote malignant transformation of human prostatic epithelial cells. When the non-tumourigenic human prostatic epithelial cell line BPH-1 was recombined with urogenital sinus mesenchyme (UGM) or stromal cells from PCa, BPH-1 cells were induced to undergo malignant transformation.12, 13 Many research groups have also shown that a dynamic stromal–epithelial interaction plays a critical role in the progression and metastasis of PCa.14, 15, 16, 17, 18, 19, 20 Growth factors play a central role in mediating the interactions between epithelial and stromal cells.21 The stromal–epithelial interaction is also critical for mediating the effects of these molecules on epithelial cells. Sex hormones regulate epithelial proliferation via a paracrine mechanism. The action of androgens on cellular proliferation and death is mediated indirectly through the actions of various growth factors via an intricate stromal–epithelial interaction. Stromal cells express certain growth factors that control the proliferation and differentiation of the prostate epithelium, demonstrating a critical role for the stroma in epithelial growth and homeostasis.
In the present study, we hypothesized that the mechanisms involved in the stromal–epithelial interaction are different in the PZ and the TZ and that this difference may be responsible for the distinct zonal localisation of prostate diseases. The study of such zone-specific roles in tumourigenesis and the progression of PCa may provide novel therapeutic strategies for the control and treatment of PCa. To elucidate the roles of zone-specific stromal–epithelial interactions in prostate diseases, we established a coculture model and compared the effects of prostate stromal cells derived from different zones on PCa epithelial cells in the presence of sex hormones. Our data suggest that stromal cells from the PZ may have a greater capacity to induce PCa development, growth and progression than TZsc via growth factors regulated by sex hormones.
Materials and methods
Cell culture
Fresh human prostate specimens were obtained post-mortem from consenting normal organ donors between the ages of 30 and 45 years at Shanghai First People's Hospital (Shanghai, China) with the approval of the Shanghai First People's Hospital Medical Ethics Committee. Histopathological analysis confirmed the zonal-specific and normal morphology of the prostate tissue (tissues with BPH or PCa were excluded). Prostate specimens, cut according to McNeal's zonal anatomy,22 were minced (1 mm3 pieces) and then digested for 8±2 h at 37 °C in RPMI 1640 medium (Gibco, Rockville, MD, USA) with collagenase I (200 U ml−1). Stromal cells were separated from epithelial cells by discontinuous gradient centrifugation.23 The stromal cells derived from the PZ (PZsc) and stromal cells derived from the TZ (TZsc) were identified by immunocytochemistry (IHC)8 and cultured with RPMI 1640 supplemented with 10% foetal bovine serum (Gibco, Melbourne, Australia) and antibiotics (100 mg ml−1 streptomycin and 100 IU ml−1 penicillin) (Gibco BRL, Grand Island, NY, USA) at 37 °C under 5% CO2 and a humidified atmosphere. The stromal cells were used at passages 3–5. The PCa cell line PC3 was obtained from the American Type Culture Collection (Rockville, MD, USA) and cultured in RPMI 1640 medium with 10% foetal calf serum (Gibco, Melbourne, Australia).
Coculture model
A coculture model of PZsc or TZsc with PC3 cells was constructed in six-well plates (for Western blot and RT-PCR) or 24-well plates (for MTT) using cell inserts with 0.4-µm polyethylene terephthalate (PET) membranes (Corning, Lowell, MA, USA) (Figure 1). PC3 cells were cultured alone or cocultured with the stromal cells. PZsc or TZsc cells were seeded on six-well plates at a density of 1×10⁵ cells per well or on 24-well plates at a density of 5×10³ cells per well. PC3 cells were seeded on six-well plate inserts at a density of 1×10⁵ cells per insert or on 24-well plate inserts at a density of 1×10⁴ cells per insert. They were all cultured in RPMI 1640 medium supplemented with 10% charcoal-stripped foetal bovine serum and antibiotics at 37 °C under 5% CO2. Twenty-four hours after seeding, cells were cultured either in the absence of dihydrotestosterone (DHT) (Wako, Tokyo, Japan) and β-oestradiol (E2) (Sigma, St Louis, MO, USA) (as a control) or in medium containing E2 (10 nmol l−1) and a series of concentrations of DHT (0, 1, 10 or 100 nmol l−1). Media were changed daily.
Figure 1.
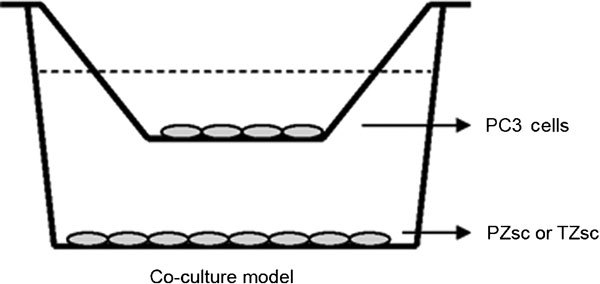
Coculture model. PC3 cells were seeded on the insert chamber with PET bottom (the upper chamber of the model). The stromal cells (PZ or TZ) were seeded on regular plate (the lower chamber of the model). PET, polyethylene terephthalate; PZ, peripheral zone; TZ, transition zone.
ELISA analysis
Approximately 2×10⁵ PZsc or TZsc cells were plated per well in six-well plates. After overnight attachment and growth, the cells were washed twice with phosphate-buffered saline and fed with serum-free RPMI 1640 containing no hormones (control) or E2 (10 nmol l−1) and increasing concentrations of DHT (0, 1, 10 or 100 nmol l−1). Cell culture supernatants were collected after 24 h, centrifuged at 750g for 20 min and stored at −80 °C until use. The concentrations of transforming growth factor-β1 (TGF-β1), keratinocyte growth factor (KGF) and insulin-like growth factor-1 (IGF-1) were measured by ELISA according to the manufacturer's protocol (R&D Systems, Minneapolis, MN, USA). Each experiment was performed in triplicate. Cells were counted after supernatants had been removed, and measurements were normalized by cell number. Results were given in pg ml−1 per 1×10⁵ cells.
Cell proliferation assay
The effect of stromal cells on the growth of prostatic epithelial cells was determined using a tetrazolium assay in which mitochondrial enzymes in metabolically active cells decompose a tetrazolium salt, MTT, to a coloured formazan product with a maximum absorption at 595 nm. As described in our coculture model, 5×10³ PZsc or TZsc cells were seeded per well in 24-well plates, and 1×10⁴ PC3 cells were seeded per well in 24-well plate transwell inserts. After 24 h of attachment, cells were cultured in the presence of E2 and DHT as described above. Cells were then incubated for 24, 72, 120 or 168 h. At the end of the incubation period, 100 µl of MTT (5 g l−1) was added to each well, and cells were further incubated for 4 h at 37 °C under 5% CO2 and a humidified atmosphere. After carefully removing the medium, we added 600 µl of DMSO to each well, shook them gently and transferred the solution to 96-well microtiter plates. Absorbance at 595 nm was determined by spectrophotometry. Wells containing medium but no cells served as blanks, while wells with untreated cells were used as normal controls. The results were expressed as the mean of six replicates per condition.
Western blot analysis
The protein expression levels of proliferating cell nuclear antigen (PCNA) and Bcl2 in PC3 cells after coculture with PZsc or TZsc were investigated by Western blot analysis. Cells were plated (1×10⁵ cells per well) in the coculture model and treated as described above. After a 48-h treatment, PC3 cells were harvested, and total cellular protein was extracted from the cell pellets by homogenisation in RIPA buffer containing 10 mmol l−1 Tris–HCl (pH 8.0), 150 mmol l−1 NaCl, 0.1% sodium dodecyl sulphate, 0.8% Triton X-100 and a protease inhibitor cocktail (Roche, Mannheim, Germany) at 4 °C for 30 min. Protein samples (50 µg protein per sample) were subjected to electrophoretic analysis in 10%/4% sodium dodecyl sulphate-stacked polyacrylamide gels and were subsequently electrotransferred onto PVDF membranes (Bio-Rad, Hercules, CA, USA). Membranes were blocked for 1 h in Tris-buffered saline containing Tween 20 (10 mmol l−1 Tris-HCl, pH 7.5, 100 mmol l−1 NaCl and 0.1% Tween 20) with 5% non-fat milk powder. Membranes were washed and probed at 4 °C overnight with either mouse anti-PCNA IgG (1∶3000 dilution) or rabbit anti-Bcl2 IgG (1∶3000 dilution). After washing, membranes were incubated for 1 h at room temperature with the horseradish peroxidase-linked secondary antibody (1∶5000 dilution). Immunoreactive bands were detected by the Immobilon Western Chemiluminescent HRP Substrate Kit (Millipore, Billerica, MA, USA). The intensity of each band was quantified by ImageJ software. All bands were normalized to beta-actin.
Quantitative real-time RT-PCR
PZsc/PC3 or TZsc/PC3 coculture models were constructed and treated as described above. After a 48-h treatment, total cellular RNA was extracted from PC3 cells using TRIzol (Invitrogen, Carlsbad, CA, USA) according to the manufacturer's recommended protocol. Two micrograms of total RNA were used to generate cDNA, and the real-time reaction was performed following the manufacturer's protocol (Promega, Madison, WI, USA). The reverse transcription product (1 µl) was used as a template in a 20-µl PCR reaction containing SYBR Premix Ex Taq PCR Mastermix (TaKaRa, DaLian, China). After an initial denaturation at 95 °C for 10 min, the samples were subjected to 45 cycles of a denaturation step at 95 °C for 30 s, an annealing step at 55–60 °C for 30 s and an extension step at 72 °C for 30 s. Primers were designed using the online tool Primer3 (http://frodo.wi.mit.edu/primer3/); the sequences are shown in Table 1. As an internal control, cDNA for glyceraldehyde 3-phosphate dehydrogenase was amplified. Relative expression of the target genes was estimated using the method.24
Table 1. Primers used for real-time RT-PCR.
| Target gene | Forward primer (5′–3′) | Reverse primer (5′–3′) | Product size (bp) | Annealing temperature (°C) |
|---|---|---|---|---|
| AR | TGTCCATCTTGTCGTCTTC | CCTCTCCTTCCTCCTGTAG | 103 | 55 |
| KGF | CACCAGGCAGACAACAGACAT | GTAAGTTCAGTTGCTGTGACGCT | 97 | 55 |
| TGF-β1 | CGACTACTACGCCAAGGAGG | CGGAGCTCTGATGTGTTGAA | 120 | 55 |
| EGF | GCCAGCTGCACAAATACAGA | AGTGGTGGTCATCTTCCCTG | 121 | 57 |
| IGF-1 | CCTCCTCGCATCTCTTCTACCTGC | TGCTGGAGCCATACCCTGTG | 165 | 55 |
| bFGF | CCGTTACCTGGCTATGAAGG | ACTGCCCAGTTCGTTTCAGT | 158 | 60 |
| hTERT | CTGTAGAAGACGAGGCCCTG | GGCATAGCTGGAGTAGTCGC | 128 | 57 |
| GAPDH | GAAGGTGAAGGTCGGAGTC | GAAGATGGTGATGGGATTTC | 226 | 55 |
Abbreviations: AR, androgen receptor; bFGF, basic fibroblast growth factor; EGF, epidermal growth factor; GAPDH, glyceraldehyde 3-phosphate dehydrogenase; hTERT, human telomerase reverse transcriptase; IGF-1, insulin-like growth factor 1; KGF, keratinocyte growth factor; TGF-β1, transforming growth factor-β1.
Statistical analysis
Unless otherwise stated, the results are expressed as the mean±s.d. Statistical analysis was conducted by analysis of variance or by paired t-test when only two values were to be compared. The data were analyzed by using SPSS software version 11.0 (SPSS Inc., Chicago, IL, USA). A P value of less than 0.05 was considered statistically significant.
Results
Morphology of PZsc and TZsc
Figure 2 shows the morphology of PZsc and TZsc. We also analysed these stromal cells by IHC using vimentin and prostate-specific antigen as markers. PZsc and TZsc were all vimentin-positive (Figure 2c and d) and prostate-specific antigen-negative (Figure 2e and f). We also examined AR expression in PZsc and TZsc by IHC, but it was below the detection limit. These results suggest that the cells we cultured were stromal cells.
Figure 2.
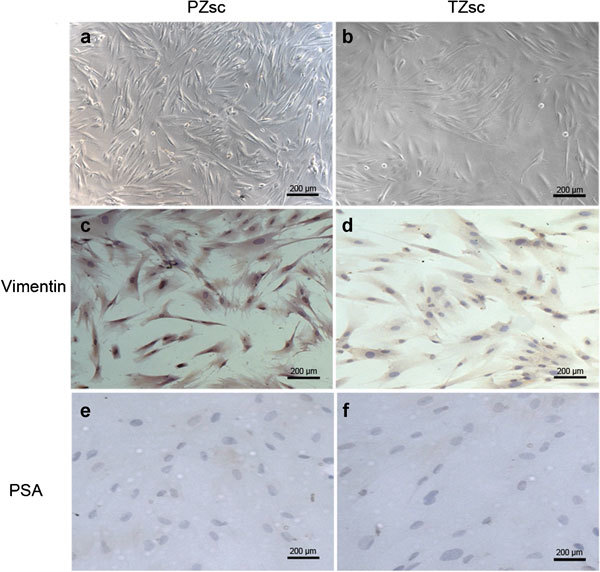
Morphology of PZsc (stromal cells derived from the PZ) and TZsc (stromal cells derived from TZ). Morphology and identification of primary human normal prostate stromal cells from the peripheral zone (PZ or the transition zone (TZ) by microscopy and immunocytochemistry (IHC). (a) PZsc, scale bar=200 µm. (b) TZsc, scale bar=200 µm. Vimentin expression was positive in PZsc (c) (scale bar=200 µm) and TZsc (d) (scale bar=200 µm), but prostate-specific antigen (PSA) expression was negative in PZsc (e) (scale bar=200 µm) and TZsc (f) (scale bar=200 µm).
AR mRNA expression differs between PZsc and TZsc
We next measured AR mRNA expression levels in PZsc and TZsc (Figure 3a). AR was more highly expressed in PZsc than in TZsc in the presence of 10 nmol l−1 E2 plus 1–100 nmol l−1 DHT (P<0.05). When the cells were treated with DHT plus E2, AR expression increased with increasing DHT concentrations in PZsc (P<0.05), but not in TZsc. Interestingly, when cells were treated with E2 (10 nmol l−1) alone, TZsc expressed higher levels of AR than PZsc (P<0.05).
Figure 3.
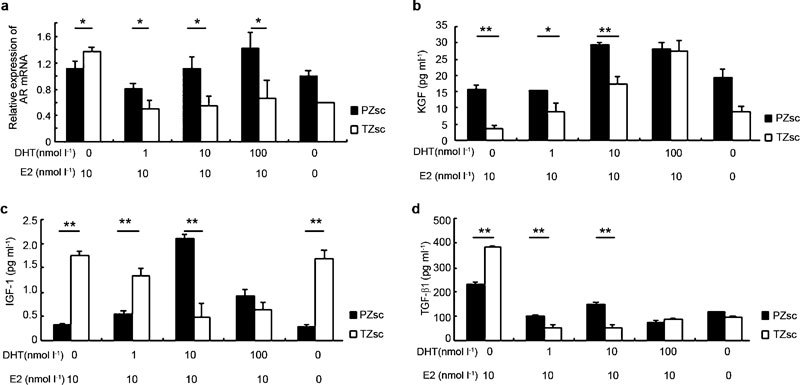
Differences between PZsc and TZsc in AR mRNA expression levels and the secretion of peptide growth factors under the action of sex hormones. AR mRNA expression was determined by Q-PCR (a). Supernatant concentrations of KGF (b), IGF-1 (c) and TGF-β1 (d) were detected by ELISA. The mean value of three independent measurements is shown. Cells were counted after supernatants were removed, and measurements were normalized for cell number. Results are given in pg ml−1 per 1×10⁵ cells. *P<0.05, **P<0.01. AR, androgen receptor; DHT, dihydrotestosterone; E2, β-oestradiol; EGF, epidermal growth factor; IGF-1, insulin-like growth factor 1; KGF, keratinocyte growth factor; PZsc, stromal cells derived from the peripheral zone; Q-PCR, quantitative real-time RT-PCR; TGF-β1, transforming growth factor-β1; TZsc, stromal cells derived from transition zone.
Differences in peptide growth factor secretion from PZsc and TZsc
We used ELISA to measure the concentrations of several important growth factors in the culture supernatants of PZsc and TZsc after the sex hormone treatments described above (Figure 3). The level of KGF in the supernatants increased with increasing concentrations of DHT (P<0.01) and was higher in PZsc than TZsc (0 nmol l−1 DHT, P<0.01; 1 nmol l−1 DHT, P<0.05; 10 nmol l−1 DHT, P<0.01) except the treatment with 100 nmol l−1 DHT (Figure 3b). Interestingly, with increasing concentrations of DHT (0–10 nmol l−1), IGF-1 secretion increased in PZsc but decreased in TZsc (Figure 3c). In PZsc supernatants, IGF-1 levels were significantly higher than that in TZsc when the cells were treated with 10 nmol l−1 DHT plus 10 nmol l−1 E2 (P<0.01), and decreased when DHT was applied at 100 nmol l−1. Additionally, we found that TGF-β1 levels were significantly higher in the supernatants of PZsc and TZsc when the cells were treated with 10 nmol l−1 E2 alone than when they were treated with both E2 and DHT (P<0.01). TGF-β1 secretion was higher in TZsc supernatants than in PZsc supernatants when the cells were treated with 10 nmol l−1 E2 alone (P<0.01), but this pattern was reversed when cells received 10 nmol l−1 E2 plus 1 nmol l−1 DHT (P<0.01) or 10 nmol l−1 E2 plus 10 nmol l−1 DHT (P<0.01) (Figure 3d).
Different effects of PZsc and TZsc on the proliferation of PC3 cells under the action of sex hormones
After 168-h coculture, the proliferation of PC3 cells cocultured with PZsc was significantly higher than control groups (0 nmol l−1 DHT, P<0.05; 1 nmol l−1 DHT, P<0.01; 10 nmol l−1 DHT, P<0.01; 100 nmol l−1 DHT, P<0.01) and cells cocultured with TZsc (1 nmol l−1 DHT, P<0.01; 10 nmol l−1 DHT, P<0.01; 100 nmol l−1 DHT, P<0.01) in the presence of 10 nmol l−1 E2 (Figure 4). There were no significant differences between control groups and cells cocultured with TZsc. PC3 cell proliferation was the highest in the presence of 10 nmol l−1 DHT plus 10 nmol l−1 E2 when the cells were cocultured with PZsc (P<0.01) after 168-h coculture (Figure 4a). Indeed, the effect on proliferation increased as the DHT concentration was raised from 0–10 nmol l−1, but decreased under the 100 nmol l−1 DHT treatment.
Figure 4.
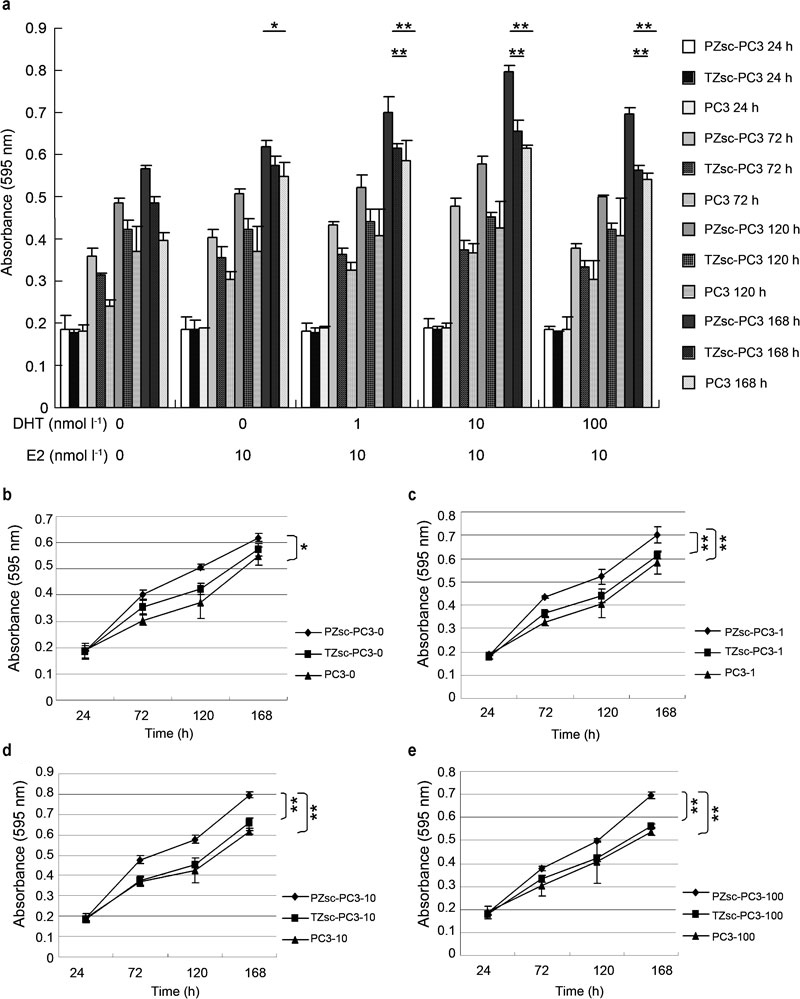
(a) The differential effects of PZsc and TZsc on PC3 cell proliferation under the action of sex hormones. As shown in Figure 1, PC3 cells were seeded on the insert chamber with a PET bottom (the upper chamber of the model). The stromal cells (PZsc or TZsc) were seeded on a regular plate (the lower chamber of the model). PZsc–PC3: PC3 cells cocultured with PZsc. TZsc–PC3: PC3 cells cocultured with TZsc. PC3: PC3 cells cultured alone. (b) 0: treatment with 0 nmol l−1 DHT plus 10 nmol −1 E2. (c) 1: treatment with 1 nmol l−1 DHT plus 10 nmol l−1 E2. (d) 10: treatment with 10 nmol l−1 DHT plus 10 nmol l−1 E2. (e) 100: treatment with 100 nmol l−1 DHT plus 10 nmol l−1 E2. In the absence of DHT and E2 (ethanol) as a control treatment. *P<0.05, **P<0.01. DHT, dihydrotestosterone; E2, β-oestradiol; PET, polyethylene terephthalate; PZsc, stromal cells derived from the peripheral zone; TZsc, stromal cells derived from transition zone.
PCNA and Bcl2 protein expression
The protein expression levels of PCNA and Bcl2 in PC3 cells were measured by Western blot analysis. As shown in Figure 5, the PCNA level in PC3 cells cocultured with PZsc was higher than that of cells cultured with TZsc (P<0.01). PCNA expression increased further when PC3 cells cocultured with PZsc were treated with DHT plus E2. There were no significant differences in Bcl2 expression between PC3 cells cocultured with PZsc and PC3 cells cocultured with TZsc.
Figure 5.
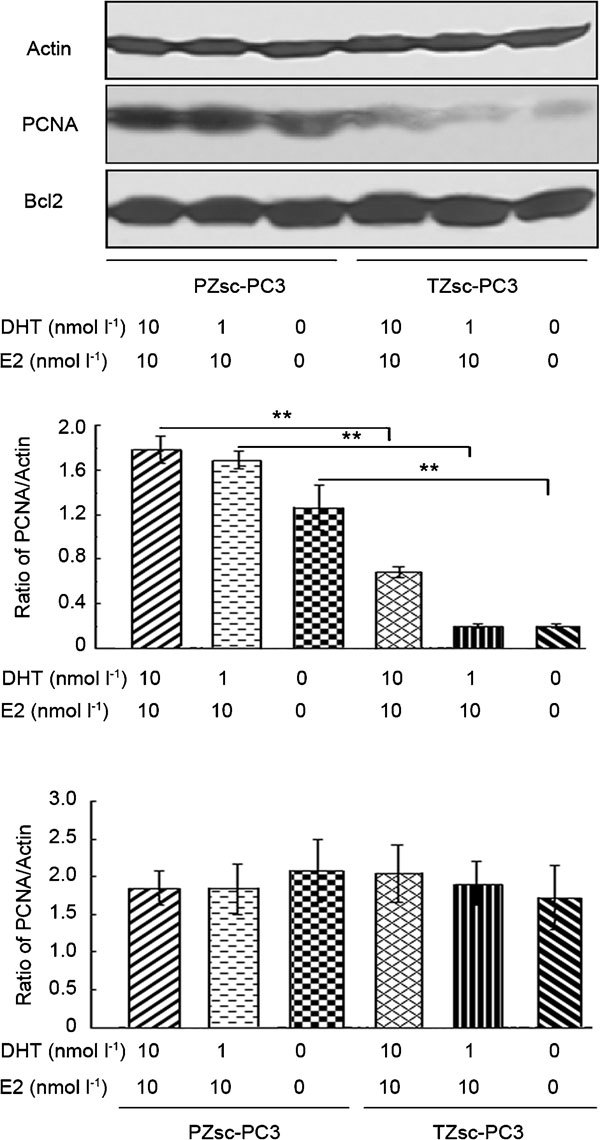
Western blot analysis of PCNA and Bcl2 protein expression in PC3 cells. PZsc–PC3: PC3 cells cocultured with PZsc. TZsc–PC3: PC3 cells cocultured with TZsc. Actin was used as an internal control. **P<0.01, comparison between PZsc–PC3 and TZsc–PC3. DHT, dihydrotestosterone; E2, β-oestradiol; PCNA, proliferating cell nuclear antigen; PZsc, stromal cells derived from the peripheral zone; TZsc, stromal cells derived from transition zone.
Relative mRNA expression by real-time RT-PCR
To evaluate the differential effects of PZsc and TZsc on PCa development as judged by growth factor expression patterns, we measured the mRNA expression levels of basic fibroblast growth factor (βFGF), KGF, epidermal growth factor (EGF), IGF-1, TGF-β1 and human telomerase reverse transcriptase (hTERT) in PC3 cells after coculture with PZsc or TZsc. Treatment with 1 or 10 nmol l−1 DHT and 10 nmol l−1 E2 induced higher expression of bFGF in PZsc–PC3 coculture groups than in TZsc–PC3 coculture groups (Figure 6a, P<0.05). However, when the cells were treated with 10 nmol l−1 E2 alone, the PZsc–PC3 coculture groups expressed lower levels of bFGF than the TZsc–PC3 coculture groups (Figure 6a, P<0.01). Treatment with 1 or 10 nmol l−1 DHT and 10 nmol l−1 E2 led to higher expression of KGF and EGF in PZsc–PC3 coculture groups than in TZsc–PC3 coculture groups (Figure 6b and c). Under DHT stimulation (1, 10 or 100 nmol l−1) and 10 nmol l−1 E2, IGF-1 expression increased more in PZsc–PC3 coculture groups than in TZsc–PC3 coculture groups (Figure 6d). As shown in Figure 6e, TGF-β1 expression was also higher in PZsc–PC3 coculture groups than TZsc–PC3 coculture groups treated with 10 nmol l−1 E2 and DHT (1 nmol l−1, P<0.01; 10 nmol l−1, P<0.05; 100 nmol l−1, P<0.01). All the five growth factors were expressed at the lowest level among PZsc groups under 100 nmol l−1 DHT. We conclude that 10 nmol l−1 DHT plus 10 nmol l−1 E2 represents the optimal condition to increase growth factor expression in PZsc–PC3 coculture groups. However, all doses of DHT (1, 10 and 100 nmol l−1) promoted the expression of hTERT in PZsc–PC3 coculture groups (Figure 6f, P<0.05).
Figure 6.
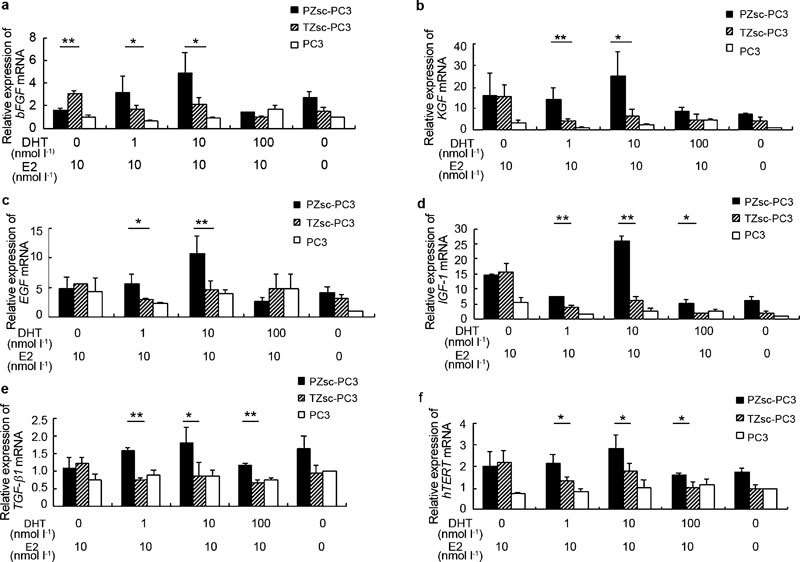
Relative mRNA expression levels in PC3 cells under different treatments (a-f). PZsc–PC3: PC3 cells cocultured with PZsc. TZsc–PC3: PC3 cells cocultured with TZsc. PC3: PC3 cells cultured alone. The absence of DHT and E2 (ethanol) is taken as a control treatment. The relative expression of the target genes was estimated using the method. The relative gene expression was calculated by assigning the reference value of 1 to the value for PC3 cells cultured alone and treated in the absence of DHT and E2. Each value represents the mean of three different experiments. *P<0.05, **P<0.01, comparision between PZsc-PC3 and TZsc-PC3. bFGF, basic fibroblast growth factor; DHT, dihydrotestosterone; E2, β-oestradiol; EGF, epidermal growth factor; hTERT, human telomerase reverse transcriptase; IGF-1, insulin-like growth factor 1; KGF, keratinocyte growth factor; PZsc, stromal cells derived from the peripheral zone; TGF-β1, transforming growth factor-β1; TZsc, stromal cells derived from transition zone.
Discussion
Among prostate diseases, PCa mostly occurs in the PZ, whereas BPH occurs in the TZ. In elderly men, the incidences of PCa and BPH are increasing, but the pathogenesis of PCa and BPH is still poorly understood. Sex hormones and stromal–epithelial interactions are key factors involved in prostate growth, development and differentiation.25, 26, 27, 28 In humans, the prostatic DHT level decreases with age, but the oestrogen level remains unchanged throughout life.29, 30 Therefore, the ratio of E2 to DHT (E2/DHT) in the prostate increases with age. The period of development of PCa and BPH coincides with this elevation in the E2/DHT ratio, indicating that the balance between the two hormonal factors may be critical to disease progression.31 In our study, we utilized direct stromal–epithelial coculture models to demonstrate the influence of primary prostate stromal cells on the properties of metastatic PC3 cells under an increasing E2/DHT ratio.
The growth-promoting effect of androgens on the epithelium during development is mediated through an AR-positive stroma.32 Blanchere et al.33 reported that both androgen and oestrogen increased AR expression in cultured prostatic stromal cells. Our data show that androgen treatment promoted AR expression to a greater degree in PZsc than in TZsc, but that oestrogen had the reverse effect, stimulating more AR expression in TZsc than in PZsc. In PZsc, AR expression increased with increasing androgen. This result indicates that PZsc might have a stronger response to androgen and that this response is dose-dependent. Conversely, oestrogen may play important roles in the TZ and in the development of BPH. Androgen action induces the production of growth factors from stroma that in turn can regulate the growth, development, and differentiation of the epithelium.32 Growth factors use paracrine pathways to signal to epithelial cells in the microenvironment. In our study, we detected three important growth factors (KGF, TGF-β1 and IGF-1) in secretions from prostate stromal cells (PZsc or TZsc). KGF, also called FGF-7, is positively regulated by androgens and stimulates the growth and proliferation of epithelial cells.34, 35, 36, 37, 38, 39 We found that KGF secretion was higher in PZsc than TZsc, generally increasing as the E2/DHT ratio decreased. KGF might therefore be a factor involved in zonal differences. Androgen negatively regulates TGF-β1,40 a finding with which our results are consistent (Figure 2b). Additionally, we found that PZsc secreted more TGF-β1 than did TZsc under the action of androgen, but that this pattern reversed under the action of oestrogen alone. TGF-β1 is a pluralistic factor that can inhibit proliferation, induce apoptosis, promote angiogenesis and suppress immunity, all of which can enhance tumour development, progression and invasiveness.41, 42, 43, 44, 45, 46 Therefore, our findings indicate TGF-β1 as another possible factor involved in zonal differences. IGF-1 stimulates cell proliferation and inhibits apoptosis47, 48, 49, 50 and has also been reported as a potent angiogenic factor.51 Stromal IGF-1 mediates tumour–stromal interactions in PCa to accelerate tumour growth.52 PCa epithelia are sensitive to surrounding IGF-1 levels, regardless of their androgen sensitivity status.18 Androgen treatment had opposing effects on IGF-1 secretion from the two stromal cell types, namely, it boosted IGF-1 secretion from PZsc but inhibited IGF-1 secretion from TZsc. The combination of 10 nmol l−1 E2 and 10 nmol l−1 DHT promoted IGF-1 secretion from PZsc to the greatest extent. We suggest that there might be different hormone/IGF-1 signalling pathways in PZsc versus TZsc and that IGF-1 might be a key factor in the development of prostate diseases. These differences between PZsc and TZsc indicate that growth factors differentially regulated by sex hormones may represent an important mechanism underlying zonal differences in prostate diseases.
To further understand the effects of prostate stromal cells derived from different zones on epithelial cells and the role of sex hormones in this interaction, we developed a stromal–epithelial coculture model. We then used this model to compare the abilities of PZsc and TZsc to induce growth of the human PCa cell line PC3 in vitro. We found that PZsc have a greater capacity to promote PC3 cell proliferation than TZsc, especially in the presence of 10 nmol l−1 E2 plus 10 nmol l−1 DHT. PZsc increased PC3 cell numbers, but TZsc had little effect. Moreover, PCNA was more highly expressed in PC3 cells cocultured with PZsc than in PC3 cells cultured with TZsc, although there was no significant difference in Bcl2 expression. These results indicate that the differential impacts of PZsc and TZsc manifested in epithelial proliferation rather than apoptosis. The enhancement of PC3 cell proliferation by sex hormones in the PZsc–PC3 coculture groups might be attributed to their modulation of a variety of growth factors. In addition, our data show that hTERT mRNA levels were higher in PC3 cells cocultured with PZsc compared with PC3 cells cocultured with TZsc, suggesting that PZsc promoted basal telomerase activity. Iczkowski et al.53 demonstrated that hTERT expression levels in human PCa tissue samples positively correlated with tumour grade and stage, indicating that hTERT may play a role in PCa progression. In this sense, our results suggest that PZsc may have a stronger ability to promote PCa progression. Several groups have reported that sex hormones can regulate hTERT expression,54, 55, 56 but the mechanism is unknown. We also found that E2 increased hTERT mRNA expression. Nanni et al.57 showed that oestrogen can increase the expression and activity of hTERT in normal human prostate epithelial cells. Indeed, E2 may be an initiating factor in PCa.58 We also examined the expression of several important growth factors (bFGF, EGF, KGF, IGF-1 and TGF-β1) that act as vital stimulants for proliferation, immunosuppression, differentiation, invasiveness, angiogenesis and metastasis in PCa.59 Following DHT plus E2 treatment, most of these growth factors were expressed at higher levels in PC3 cells cocultured with PZsc than in PC3 cells cocultured with TZsc. Furthermore, the highest levels were observed in the presence of 10 nmol l−1 E2 and 10 nmol l−1 DHT; expression decreased when DHT was increased to 100 nmol l−1. The higher expression of growth factors in PC3 cells cocultured with PZsc demonstrates that PZsc may have a greater capacity to induce PC3 cell development, differentiation, invasiveness and metastasis under the action of sex hormones. The mixture of 10 nmol l−1 E2 and 10 nmol l−1 DHT might be the best microenvironment to promote PC3 growth. Therefore, regulating the prostate microenvironment at different hormone levels may allow clinicians to effectively control the occurrence and development of PCa.
In conclusion, our data suggest that PZsc and TZsc represent different stromal microenvironments, as PZsc appear to more strongly induce PCa development, growth and progression than TZsc, likely via differential secretion of growth factors regulated by sex hormones. These findings offer a plausible explanation for the predominance of PCa development in the PZ. The present study provides several insights into the molecular mechanisms of zonal differences of prostate diseases, which may help illuminate novel therapeutic targets for PCa.
Author contributions
QJ designed and performed experiments, analysed data and wrote the paper; BMH designed the experiments and performed sample collection; FJZ performed cell culture and sample collection; YH performed cell culture and Western blot analysis; and SJX designed the experiments and wrote the paper.
Acknowledgments
This work was supported by a grant from the National Natural Science Foundation of China (No. 30672109).
The authors declare no competing financial interests.
References
- Brossner C, Winterholer A, Roehlich M, Dlouhy-Schutz E, Serra V, et al. Distribution of prostate carcinoma foci within the peripheral zone: analysis of 8,062 prostate biopsy cores. World J Urol. 2003;21:163–6. doi: 10.1007/s00345-003-0341-4. [DOI] [PubMed] [Google Scholar]
- Grignon DJ, Sakr WA. Zonal origin of prostatic adenocarcinoma: are the biologic differences between transition zone and peripheral zone adenocarcinomas of the prostate gland. J Cell Biochem. 1994;19 Suppl:267–9. [PubMed] [Google Scholar]
- McNeal JE, Redwine EA, Freiha FS, Stamey TA. Zonal distribution of prostatic adenocarcinoma. Correlation with histologic pattern and direction of spread. Am J Surg Pathol. 1988;12:897–906. doi: 10.1097/00000478-198812000-00001. [DOI] [PubMed] [Google Scholar]
- Pavelic J, Zeljko Z, Bosnar MH. Molecular genetic aspects of prostate transition zone lesions. Urology. 2003;62:607–13. doi: 10.1016/s0090-4295(03)00501-6. [DOI] [PubMed] [Google Scholar]
- John K, Ragavan N, Pratt MM, Singh PB, Al-Buheissi S, et al. Quantification of phase I/II metabolizing enzyme gene expression and polycyclic aromatic hydrocarbon-DNA adduct levels in human prostate. Prostate. 2009;69:505–19. doi: 10.1002/pros.20898. [DOI] [PMC free article] [PubMed] [Google Scholar]
- Ragavan N, Hewitt R, Cooper LJ, Ashton KM, Hindley AC, et al. CYP1B1 expression in prostate is higher in the peripheral than in the transition zone. Cancer Lett. 2004;215:69–78. doi: 10.1016/j.canlet.2004.06.051. [DOI] [PubMed] [Google Scholar]
- van der Heul-Nieuwenhuijsen L, Hendriksen PJ, van der Kwast TH, Jenster G. Gene expression profiling of the human prostate zones. BJU Int. 2006;98:886–97. doi: 10.1111/j.1464-410X.2006.06427.x. [DOI] [PubMed] [Google Scholar]
- Zhao FJ, Han BM, Yu SQ, Xia SJ. Tumor formation of prostate cancer cells influenced by stromal cells from the transitional or peripheral zones of the normal prostate. Asian J Androl. 2009;11:176–82. doi: 10.1038/aja.2008.33. [DOI] [PMC free article] [PubMed] [Google Scholar]
- Noel EE, Ragavan N, Walsh MJ, James SY, Matanhelia SS, et al. Differential gene expression in the peripheral zone compared to the transition zone of the human prostate gland. Prostate Cancer Prostatic Dis. 2008;11:173–80. doi: 10.1038/sj.pcan.4500997. [DOI] [PubMed] [Google Scholar]
- Feneley MR, Puddefoot JR, Xia S, Sowter C, Slavin G, et al. Zonal biochemical and morphological characteristics in BPH. Br J Urol. 1995;75:608–13. doi: 10.1111/j.1464-410x.1995.tb07418.x. [DOI] [PubMed] [Google Scholar]
- Cunha GR, Hayward SW, Wang YZ. Role of stroma in carcinogenesis of the prostate. Differentiation. 2002;70:473–85. doi: 10.1046/j.1432-0436.2002.700902.x. [DOI] [PubMed] [Google Scholar]
- Barclay WW, Woodruff RD, Hall MC, Cramer SD. A system for studying epithelial–stromal interactions reveals distinct inductive abilities of stromal cells from benign prostatic hyperplasia and prostate cancer. Endocrinology. 2005;146:13–8. doi: 10.1210/en.2004-1123. [DOI] [PMC free article] [PubMed] [Google Scholar]
- Wang Y, Sudilovsky D, Zhang B, Haughney PC, Rosen MA, et al. A human prostatic epithelial model of hormonal arcinogenesis. Cancer Res. 2001;61:6064–72. [PubMed] [Google Scholar]
- Arnold JT, Gray NE, Jacobowitz K, Viswanathan L, Cheung PW, et al. Human prostate stromal cells stimulate increased PSA production in DHEA-treated prostate cancer epithelial cells. J Steroid Biochem Mol Biol. 2008;111:240–6. doi: 10.1016/j.jsbmb.2008.06.008. [DOI] [PMC free article] [PubMed] [Google Scholar]
- Condon MS. The role of the stromal microenvironment in prostate cancer. Semin Cancer Biol. 2005;15:132–7. doi: 10.1016/j.semcancer.2004.08.002. [DOI] [PubMed] [Google Scholar]
- Lang SH, Stower M, Maitland NJ. In vitro modelling of epithelial and stromal interactions in non-malignant and malignant prostates. Br J Cancer. 2000;82:990–7. doi: 10.1054/bjoc.1999.1029. [DOI] [PMC free article] [PubMed] [Google Scholar]
- Morrissey C, Vessella RL. The role of tumor microenvironment in prostate cancer bone metastasis. J Cell Biochem. 2007;101:873–86. doi: 10.1002/jcb.21214. [DOI] [PubMed] [Google Scholar]
- Niu YN, Xia SJ. Stroma–epithelium crosstalk in prostate cancer. Asian J Androl. 2009;11:28–35. doi: 10.1038/aja.2008.39. [DOI] [PMC free article] [PubMed] [Google Scholar]
- Sung SY, Chung LW. Prostate tumor–stroma interaction: molecular mechanisms and opportunities for therapeutic targeting. Differentiation. 2002;70:506–21. doi: 10.1046/j.1432-0436.2002.700905.x. [DOI] [PubMed] [Google Scholar]
- Yang F, Tuxhorn JA, Ressler SJ, McAlhany SJ, Dang TD, et al. Stromal expression of connective tissue growth factor promotes angiogenesis and prostate cancer tumorigenesis. Cancer Res. 2005;65:8887–95. doi: 10.1158/0008-5472.CAN-05-1702. [DOI] [PubMed] [Google Scholar]
- Evangelou AI, Winter SF, Huss WJ, Bok RA, Greenberg NM. Steroid hormones, polypeptide growth factors, hormone refractory prostate cancer, and the neuroendocrine phenotype. J Cell Biochem. 2004;91:671–83. doi: 10.1002/jcb.10771. [DOI] [PubMed] [Google Scholar]
- McNeal JE. The zonal anatomy of the prostate. Prostate. 1981;2:35–49. doi: 10.1002/pros.2990020105. [DOI] [PubMed] [Google Scholar]
- Peehl DM. Primary cell cultures as models of prostate cancer development. Endocr Relat Cancer. 2005;12:19–47. doi: 10.1677/erc.1.00795. [DOI] [PubMed] [Google Scholar]
- Livak KJ, Schmittgen TD. Analysis of relative gene expression data using real-time quantitative PCR and the method. Methods. 2001;25:402–8. doi: 10.1006/meth.2001.1262. [DOI] [PubMed] [Google Scholar]
- Chung LW, Davies R. Prostate epithelial differentiation is dictated by its surrounding stroma. Mol Biol Rep. 1996;23:13–9. doi: 10.1007/BF00357069. [DOI] [PubMed] [Google Scholar]
- Cunha GR, Ricke W, Thomson A, Marker PC, Risbridger G, et al. Hormonal, cellular, and molecular regulation of normal and neoplastic prostatic development. J Steroid Biochem Mol Biol. 2004;92:221–36. doi: 10.1016/j.jsbmb.2004.10.017. [DOI] [PubMed] [Google Scholar]
- Hayward SW, Haughney PC, Rosen MA, Greulich KM, Weier HU, et al. Interactions between adult human prostatic epithelium and rat urogenital sinus mesenchyme in a tissue recombination model. Differentiation. 1998;63:131–40. doi: 10.1046/j.1432-0436.1998.6330131.x. [DOI] [PubMed] [Google Scholar]
- Thomson AA, Timms BG, Barton L, Cunha GR, Grace OC. The role of smooth muscle in regulating prostatic induction. Development. 2002;129:1905–12. doi: 10.1242/dev.129.8.1905. [DOI] [PubMed] [Google Scholar]
- Brendler CB, Berry SJ, Ewing LL, McCullough AR, Cochran RC, et al. Spontaneous benign prostatic hyperplasia in the beagle. Age-associated changes in serum hormone levels, and the morphology and secretory function of the canine prostate. J Clin Invest. 1983;71:1114–23. doi: 10.1172/JCI110861. [DOI] [PMC free article] [PubMed] [Google Scholar]
- Shibata Y, Ito K, Suzuki K, Nakano K, Fukabori Y, et al. Changes in the endocrine environment of the human prostate transition zone with aging: simultaneous quantitative analysis of prostatic sex steroids and comparison with human prostatic histological composition. Prostate. 2000;42:45–55. doi: 10.1002/(sici)1097-0045(20000101)42:1<45::aid-pros6>3.0.co;2-w. [DOI] [PubMed] [Google Scholar]
- Risbridger GP, Bianco JJ, Ellem SJ, McPherson SJ. Oestrogens and prostate cancer. Endocr Relat Cancer. 2003;10:187–91. doi: 10.1677/erc.0.0100187. [DOI] [PubMed] [Google Scholar]
- Cano P, Godoy A, Escamilla R, Dhir R, Onate SA. Stromal–epithelial cell interactions and androgen receptor–coregulator recruitment is altered in the tissue microenvironment of prostate cancer. Cancer Res. 2007;67:511–9. doi: 10.1158/0008-5472.CAN-06-1478. [DOI] [PubMed] [Google Scholar]
- Blanchere M, Berthaut I, Portois MC, Mestayer C, Mowszowicz I. Hormonal regulation of the androgen receptor expression in human prostatic cells in culture. J Steroid Biochem Mol Biol. 1998;66:319–26. doi: 10.1016/s0960-0760(98)00056-9. [DOI] [PubMed] [Google Scholar]
- Janssen M, Albrecht M, Moschler O, Renneberg H, Fritz B, et al. Cell lineage characteristics of human prostatic stromal cells cultured in vitro. . Prostate. 2000;43:20–30. doi: 10.1002/(sici)1097-0045(20000401)43:1<20::aid-pros4>3.0.co;2-6. [DOI] [PubMed] [Google Scholar]
- Leung HY, Mehta P, Gray LB, Collins AT, Robson CN, et al. Keratinocyte growth factor expression in hormone insensitive prostate cancer. Oncogene. 1997;15:1115–20. doi: 10.1038/sj.onc.1201256. [DOI] [PubMed] [Google Scholar]
- Levine AC, Liu XH, Greenberg PD, Eliashvili M, Schiff JD, et al. Androgens induce the expression of vascular endothelial growth factor in human fetal prostatic fibroblasts. Endocrinology. 1998;139:4672–8. doi: 10.1210/endo.139.11.6303. [DOI] [PubMed] [Google Scholar]
- Peehl DM, Rubin JS. Keratinocyte growth factor: an androgenregulated mediator of stromal–epithelial interactions in the prostate. World J Urol. 1995;13:312–7. doi: 10.1007/BF00185975. [DOI] [PubMed] [Google Scholar]
- Planz B, Aretz HT, Wang Q, Tabatabaei S, Kirley SD, et al. Immunolocalization of the keratinocyte growth factor in benign and neoplastic human prostate and its relation to androgen receptor. Prostate. 1999;41:233–42. doi: 10.1002/(sici)1097-0045(19991201)41:4<233::aid-pros3>3.0.co;2-l. [DOI] [PubMed] [Google Scholar]
- Yan G, Fukabori Y, Nikolaropoulos S, Wang F, McKeehan WL. Heparin-binding keratinocyte growth factor is a candidate stromal-to-epithelial-cell andromedin. Mol Endocrinol. 1992;6:2123–8. doi: 10.1210/mend.6.12.1491693. [DOI] [PubMed] [Google Scholar]
- Song K, Wang H, Krebs TL, Kim SJ, Danielpour D. Androgenic control of transforming growth factor-beta signaling in prostate epithelial cells through transcriptional suppression of transforming growth factor-beta receptor II. Cancer Res. 2008;68:8173–82. doi: 10.1158/0008-5472.CAN-08-2290. [DOI] [PMC free article] [PubMed] [Google Scholar]
- Martikainen P, Kyprianou N, Isaacs JT. Effect of transforming growth factor-beta 1 on proliferation and death of rat prostatic cells. Endocrinology. 1990;127:2963–8. doi: 10.1210/endo-127-6-2963. [DOI] [PubMed] [Google Scholar]
- Perry KT, Anthony CT, Steiner MS. Immunohistochemical localization of TGF beta 1, TGF beta 2, and TGF beta 3 in normal and malignant human prostate. Prostate. 1997;33:133–40. doi: 10.1002/(sici)1097-0045(19971001)33:2<133::aid-pros7>3.0.co;2-l. [DOI] [PubMed] [Google Scholar]
- Steiner MS, Barrack ER. Transforming growth factor-beta 1 overproduction in prostate cancer: effects on growth in vivo and in vitro. . Mol Endocrinol. 1992;6:15–25. doi: 10.1210/mend.6.1.1738367. [DOI] [PubMed] [Google Scholar]
- Sutkowski DM, Fong CJ, Sensibar JA, Rademaker AW, Sherwood ER, et al. Interaction of epidermal growth factor and transforming growth factor beta in human prostatic epithelial cells in culture. Prostate. 1992;21:133–43. doi: 10.1002/pros.2990210206. [DOI] [PubMed] [Google Scholar]
- Torre-Amione G, Beauchamp RD, Koeppen H, Park BH, Schreiber H, et al. A highly immunogenic tumor transfected with a murine transforming growth factor type beta 1 cDNA escapes immune surveillance. Proc Natl Acad Sci USA. 1990;87:1486–90. doi: 10.1073/pnas.87.4.1486. [DOI] [PMC free article] [PubMed] [Google Scholar]
- Yang EY, Moses HL. Transforming growth factor beta 1-induced changes in cell migration, proliferation, and angiogenesis in the chicken chorioallantoic membrane. J Cell Biol. 1990;111:731–41. doi: 10.1083/jcb.111.2.731. [DOI] [PMC free article] [PubMed] [Google Scholar]
- Hongo A, D'Ambrosio C, Miura M, Morrione A, Baserga R. Mutational analysis of the mitogenic and transforming activities of the insulin-like growth factor I receptor. Oncogene. 1996;12:1231–38. [PubMed] [Google Scholar]
- Kulik G, Klippel A, Weber MJ. Antiapoptotic signalling by the insulin-like growth factor I receptor, phosphatidylinositol 3-kinase, and Akt. Mol Cell Biol. 1997;17:1595–606. doi: 10.1128/mcb.17.3.1595. [DOI] [PMC free article] [PubMed] [Google Scholar]
- Li S, Ferber A, Miura M, Baserga R. Mitogenicity and transforming activity of the insulin-like growth factor-I receptor with mutations in the tyrosine kinase domain. J Biol Chem. 1994;269:32558–64. [PubMed] [Google Scholar]
- Rubin R, Baserga R. Insulin-like growth factor-I receptor. Its role in cell proliferation, apoptosis, and tumorigenicity. Lab Invest. 1995;73:311–31. [PubMed] [Google Scholar]
- Bjorndahl M, Cao R, Nisssen LJ, Clasper Steve, Johnson LA, et al. Insulin-like growth factors 1 and 2 induce lymphangiogenesis in vivo. . Proc Natl Acad Sci USA. 2005;102:15593–8. doi: 10.1073/pnas.0507865102. [DOI] [PMC free article] [PubMed] [Google Scholar]
- Kawada M, Inoue H, Masuda T, Ikeda D. Insulin-like growth factor i secreted from prostate stromal cells mediates tumor-stromal cell interactions of prostate cancer. Cancer Res. 2006;66:4419–25. doi: 10.1158/0008-5472.CAN-05-4239. [DOI] [PubMed] [Google Scholar]
- Iczkowski KA, Pantazis CG, Mcgregor D, Wu Y, Tawfik OW. Telomerase subunit hTERT immunoreactivity: a marker for high-grade prostate cancer. Cancer. 2002;95:2487–93. doi: 10.1002/cncr.10988. [DOI] [PubMed] [Google Scholar]
- Biroccio A, Leonetti C. Telomerase as a new target for the treatment of hormone-refractory prostate cancer. Endocr Relat Cancer. 2004;11:407–21. doi: 10.1677/erc.1.00764. [DOI] [PubMed] [Google Scholar]
- Kyo S, Takakura M, Kanaya T, Zhou W, Fujimoto K, et al. Estrogen activates telomerase. Cancer Res. 1999;59:5917–21. [PubMed] [Google Scholar]
- Kawagoe J, Ohmichi M, Takahashi T, Ohshima C, Mabuchi S, et al. Raloxifene inhibits estrogen-induced up-regulation of telomerase activity in a human breast cancer cell line. J Biol Chem. 2003;278:3363–72. doi: 10.1074/jbc.M304363200. [DOI] [PubMed] [Google Scholar]
- Nanni S, Narducci M, Della Pietra L, Moretti F, Grasselli A, et al. Signaling through estrogen receptors modulates telomerase activity in human prostate cancer. J Clin Invest. 2002;110:219–27. doi: 10.1172/JCI15552. [DOI] [PMC free article] [PubMed] [Google Scholar]
- Singh PB, Matanhelia SS, Martin FL. A potential paradox in prostate adenocarcinoma progression: oestrogen as the initiating driver. Eur J Cancer. 2008;44:928–36. doi: 10.1016/j.ejca.2008.02.051. [DOI] [PubMed] [Google Scholar]
- Gann PH, Chatterton RT, Lee C. Peptide growth factors as biomarkers of prostate cancer risk. Epidemiol Rev. 2001;23:67–71. doi: 10.1093/oxfordjournals.epirev.a000797. [DOI] [PubMed] [Google Scholar]