

Abstract
The new World Health Organization (WHO) Manual for Semen Analysis contains several improvements. One is that the 20 million spermatozoa per mL paradigm has been ousted in favour of proper calculations of lower reference limits for semen from men, whose partners had a time-to-pregnancy of 12 months or less. The recommendation to grade the progressive motility as described in the third and fourth editions of the WHO manual was not evidence-based, and WHO was therefore motivated to abandon it. However, the new recommendation is not evidence-based either, and it is difficult to understand the rational for the new assessment. It may have been a compromise to avoid returning to the rather robust system recommended in the first edition (1980). The unconditional recommendation of the 'Tygerberg strict criteria' is not evidence-based, and seems to be the result of an unfortunate bias in the composition of the Committee in favour of individuals known to support the 'strict criteria' method. This recommendation will have negative effects on the development of andrology as a scientific field. Given the importance of the WHO manual, it is unfortunate that the recommendations for such important variables, as motility and morphology, lack evidence-based support.
Keywords: evaluation report, semen analysis, spermatozoa, sperm morphology, sperm motility
Introduction
Through its cellular and chemical components, human semen can provide information on the functional properties of the organs producing this fluid. Spermatozoa can provide information on the health of the testes and the epididymides, and thus have the potential to be markers of toxic factors, such as drugs and endocrine disruptors, as well as markers of general health. It is well known that drugs, infections, fever and psychological stress can affect spermatogenesis. Spermatozoa can provide valuable information on processes related to cellular events (e.g., metabolism, motility, surface properties, immunology and cellular interactions) because they are intact cells available for analysis that do not require mechanical or chemical destruction of tissues. Semen analyses can also provide quantitative information on the secretory function of the prostate, seminal vesicles and epididymides, as well as on the secretion of drugs and other chemicals by these glands. Semen contains high concentrations of immunomodulating factors, such as prostaglandins and prostasomes, which are of importance for the survival and transport of spermatozoa within the female genital tract. Prostasomes may even contribute to the high incidence of cancer in the prostate gland. The epididymides are not only involved in the transport of spermatozoa, but also participate actively in the maturation and fertilization capacity of these cells. Semen thus contains a wealth of information for those who recognise its potential.
Successful researchers will most likely be the ones who follow the advice of the Nobel Laureate Dr Richard Feynman 1, who claimed that only those who can disregard what everybody else has been doing and plough their own furrow will be able to make a breakthrough in science. From this point of view, it is untimely that the World Health Organization (WHO) manual acknowledges the usefulness of semen analyses only for 'investigating male fertility status as well as monitoring spermatogenesis during and following male fertility regulation'.
The overall impression of the new manual compared with the third and fourth editions is that many important improvements have been introduced. There have even been two paradigm shifts, both of which can influence future work and publications on semen analyses in a positive manner. A paradigm shift normally occurs after a few decades, so the time clearly is ripe for these two. In addition, the section devoted to quality control has been totally rewritten and can now be recommended.
Reference limits
One paradigm shift relates to the introduction of reference limits and thus eliminates the arbitrary cutoff values for various variables. With guidelines for establishing reference values and for the performance of meaningful quality controls, the manual has created a basis for those involved in semen analysis to work according to standards valid for other specialities within the field of laboratory medicine. This is a significant step in the right direction.
It is generally accepted that one 'not normal' result for a given analysis has little or no prognostic value and that it is essential to consider the cumulative importance of various laboratory findings. This aspect has been neglected in the manual (for a discussion of this subject, see reference 2).
Number of spermatozoa
The other paradigm shift relates to the relationship between sperm numbers and potential fertility. The delusion that '20 million spermatozoa per mL' is a meaningful limit for 'fertile' vs. 'infertile' semen samples has finally been replaced with a proper calculation of reference intervals based on analyses of semen samples from relevant population groups. The manual plays down the relationship between semen variables and fertility; hopefully, this will result in a more realistic view of 'sperm count and fertility' among clinicians.
An unwarranted amount of attention has been given to the relationship between the total number of spermatozoa in a semen sample and the testicular size. It is presented as being important, although clinically such a relationship is weak. The following quotation is an example: 'The size of the testis... influences the total sperm number per ejaculate (Handelsman et al. 3, Andersen et al. 4). Testis size reflects the level of spermatogenic activity, which also affects sperm morphology (Holstein et al. 5).'
In the publication by Holstein et al. 5, there is no support for the claim that testis size affects sperm morphology. Obviously testis size has an influence on sperm count, and if all other variables are equal, there will be a good correlation. However, in references 3 and 4, one notes that the correlation between total sperm count and testicular size is low. This is to be expected because most patients do not have totally healthy testes or the same number of abstinence days.
From a functional (physiological) point of view, the laboratories ought to express sperm count in numbers per day. It is then up to the physician to relate this number to the combined size of the testes. Only then will the physician have a meaningful functional measure that can be related to testicular health (Table 1). To calculate this functional variable, one needs to know the testicular size. It is unfortunate—but understandable—that there is no information in the manual regarding how to perform such a measurement, nor is there a comment on its importance. Testis size can be measured accurately with a Prader orchidometer (http://www.accuratesurgical.com or http://ecommerce.med.monash.edu.au/categories.asp?cID=15&c=23827) or with ultrasound examination. During the investigation, the patient should lie flat on his back.
Table 1. In a routine evaluation, patient A had been classified as 'fertile' and patient B as 'infertile'. In reality, B has a testicular function that is four times better than that of A.
| Patient | A | B |
|---|---|---|
| Concentration of spermatozoa (million mL−1) | 30 | 10 |
| Volume (mL) | 2 | 6 |
| Total number of spermatozoa (million) | 60 | 60 |
| Abstinence (days) | 5 | 2 |
| Number of spermatozoa per day (million) | 12 | 30 |
| Testis size (mL) | 20 + 20 | 12 + 12 |
| Number of spermatozoa per day per mL testis volume (million) | 0.3 | 1.25 |
In a yet unpublished study on 100 men whose partners were pregnant in the first trimester, I found 0.25 million spermatozoa per day per mL testis volume to be the lower (5%) reference limit. This has been very helpful in my contacts with patients who have a 'low sperm count' (i.e., < 20 million mL−1), and who are therefore classified by most colleagues as 'infertile'. If a man has only one testis, 12 mL in size, and a semen sample is presented after 3 days of abstinence, the 'lower reference limit' for the sperm count (number per ejaculate) will be around 10 million (12 × 3 × 0.25). This reference limit refers to the testicular sperm-producing capacity and not to 'fertility'. Assessing the functional capacity of organs related to a patient's symptom should be the norm in andrology, as it is in other medical specialities.
The attitude presented in the new WHO manual 6 is a start, and in the future it may make investigators more inclined to adopt a functional attitude and make journal editors request that sperm numbers be presented as a functional unit (i.e., million spermatozoa per day of abstinence and in clinical settings also per mL testicular volume). The sperm concentration paradigm has been a millstone, preventing scientific advances in andrology for too long.
The reference range for sperm concentration in semen samples from 'fertile men' presented in the new WHO manual fits the range presented by Eliasson 7 in the 1970s (Figure 1). The difference between the two distributions can be explained by the fact that men in the study from 1970 had given semen samples within 3 months from the date of the partner's conception, and all samples were analysed in the same laboratory (with a working internal quality control programme), whereas the WHO data came from five studies, including seven laboratories in eight countries on three continents, and the men were selected because the time-to-pregnancy (TTP) was ≤ 12 months.
Figure 1.
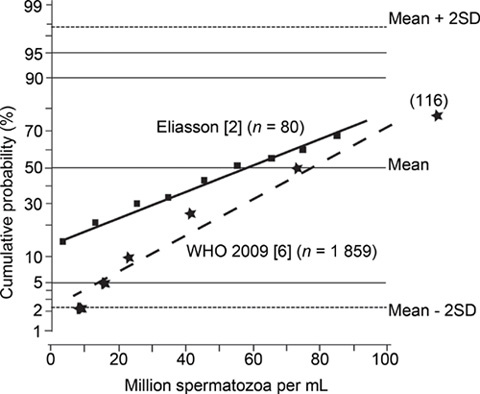
Cumulative probability distribution (%) of sperm concentration (million mL−1) in semen from men classified as 'fertile'.
The low sperm concentration noted in 5% of semen samples from men classified as fertile because they had a pregnant partner conforms to what was published in the 1970s by David et al. 8, Eliasson 7, MacLeod and Wang 9, Smith et al. 10, Sobrero and Rehan 11, Zuckerman et al. 12, van Zyl et al. 13, and others. Maybe the lower reference limit presented by WHO together with these supporting references can finally overthrow the 20 million mL−1paradigm.
Motility and viability of spermatozoa
The third and fourth editions of the manual recommended a method for assessment of sperm motility that was impossible to implement with any degree of accuracy and precision because of the physiological characteristics of the human visual system 2. This has now been acknowledged by the WHO Committee, and new guidelines have been provided.
In the new manual, the percentage of motile spermatozoa and the proportion of progressively motile spermatozoa are assessed irrespective of speed. To ignore the speed (quality) of progressive motility is to neglect the very important qualitative mean of progressive motility. The absence of this measure is most unfortunate because mean quality of the progressive motility is an important prognostic fertility factor, specifically when the proportion of motile spermatozoa is below 40%. A method that disregards the quality of the progressive motility cannot be considered suitable for studies related to fertility or to the effects of exogenous factors (e.g., drugs) on sperm motility. It would have been better to return to the method recommended in the first edition of the WHO manual published in 1980. The compromise chosen is neither evidence-based nor scientifically sound.
Morphology of spermatozoa
In a chapter published in 2003 2, I presented historical, philosophical and personal views on the assessment of sperm morphology. I found it incomprehensible that the principle of 'strict criteria' was recommended by WHO in both the third and the fourth editions. As many publications dealing with sperm morphology proved that the authors did not understand the recommendation, the new WHO manual is more explicit in emphasizing 'strict criteria' (also called 'Tygerberg strict criteria'). The 95% reference interval for 'normal' spermatozoa in semen samples from fertile men has—according to the manual—a range from 3% to 48%.
Previously, I have classified the recommendation to assess sperm morphology according to the 'Tygerberg strict criteria' as not being scientific. The data presented in the new manual do not warrant a change in my opinion. However, there may be a need to explain further the reasons for my standpoint.
All clinical laboratory analyses are performed to assist the physicians in their work to make the most probable diagnosis. The laboratories must therefore be able to provide established reference intervals for the methods they market. Values falling inside the reference range 2.5%–97.5% (or 5%–95%) are, by tradition, called 'normal', and those falling outside are 'not normal' or 'pathological'. By definition, some 5% of healthy individuals will have values outside the 95% reference intervals, and one of 100 will fall outside the 99% confidence interval (CI).
All laboratory methods have preanalytical and analytical (systematic and random) errors. Therefore, for each individual laboratory result, we must know the CI for the 'correctness' of that result (i.e., precision, accuracy, sampling error) to understand whether a value is inside the 'reference limits' or not. In addition, the area within which a 'pathological value' can be placed must have a reasonable size. When the 'normal' values go to zero or very close to zero, no such place is available for the 'not normal' or 'pathological' variable. In biology, we cannot work with 'negative numbers.'
In sperm morphology the results are reported in terms of proportions, expressed as a percentage. According to the formula presented in the WHO manual, a result of 5% 'normal' will have a 95% CI from 2% to 8%, meaning that the 'true' value with 95% probability is inside the limits of 2%–8%. However, the formula used is relevant for probability values between 20% and 80% (also mentioned in the manual). As the 'strict criteria' rarely give proportions over 20%, one should use another formula (see Altman et al. 14) and then the corresponding CI for 5% will range from 3% to 9% (note that it is a non-symmetrical CI). (In the manual, there is a formula to be used for proportions < 20% or > 80%, [angular transformation (arc sin square root) z = sin−1√(p/100) with its standard deviation 1/(2√N) radians], but as there is no working example, it will hardly be understood by those for whom the manual is written).
In the WHO manual, the lower limit for 'normal' spermatozoa is 2%, with a CI from 0.8% to 5%. If a second analysis of the same sample will give 7% 'normal' spermatozoa, that value has a 95% CI from 4% to 11%. Owing to the overlap in CIs, the result (7%) does not significantly differ from the first result (2%).
The formulae for calculating the CI values (95% probability of correctness) discussed above are valid only if there are two alternatives (e.g., sick/healthy, normal/not normal, tall/short, black/white). However, in the assessment of human spermatozoa, we do not have a yes/no situation. Let us compare a totally 'normal' spermatozoon with a white object and a clearly abnormal spermatozoon with a black object. A large number of spermatozoa will then have different combinations of white and black (i.e., different degrees of grey).
Some may claim that this is not a problem because the visual system is good at differentiating between different colours and grades of grey. This is not the case. The brain is rational, but not very objective, and it is definitely not a light meter. It is very good at breaking image information into pieces and then combining these pieces into a meaningful picture (i.e., something one can recognise and act upon). Figure 2 illustrates one aspect of this. The 'normal' person will see two squares (A and B) with different degrees of grey, despite the fact that they both have exactly the same proportions of white and black (the same shade of grey). The proof can be found at http://web.mit.edu/persci/people/adelson/checkershadow_downloads.html, and the explanation for it can be found at http://web.mit.edu/persci/people/adelson/checkershadow_description.html. A more scientific description is given by Adelson 15.
Figure 2.
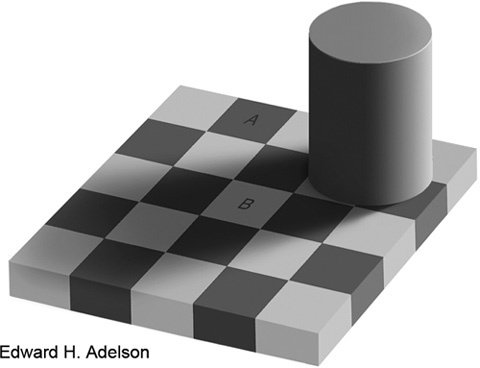
In this checker-shadow image, the squares A and B have exactly the same shade of grey. The brain computes a picture that makes sense in relation to its previous experiences, and the interpretation is that A is much darker than B. Reproduced from Adelson 15.
More on the realities behind 'optical illusions' (and 'change blindness') can be found using Google or Wikipedia. Such illusions are a reality and can influence our views also on micrographs.
Figure 3 contains the morphological data taken from Appendix Table 1.2 in the 5th WHO manual 6, data from my own laboratory as they were in the early 1980s, and information from Morgentaler et al. 16. The shaded areas represent the 95% CI when calculated according to Altman et al. 14 and under the assumption that all assessments are fully dichotomised. This is not always the case, and there are often 'uncertain cases'; thus, the real CIs have a wider range.
Figure 3.

Cumulative probability distribution of spermatozoa with 'normal' morphology (%) in semen samples from men classified as 'fertile' (Eliasson 2 and WHO manual (2010) 6 or fertilizing one or more eggs in vitro (Morgentaler et al. 16). Eliasson classified the spermatozoa after the principles presented in WHO 1980–87 (the 'traditional system'). The classification system used by WHO was the 'Tygerberg strict criteria'. Morgentaler et al. 16 compared the two methods. The shaded areas correspond to the 95% confidence interval [CI] for data from WHO manual 6 and Eliasson 2, respectively.
The lines referring to Morgentaler et al. 16 are constructed from data in their publication and refer to the assessment according to 'strict criteria' or 'traditional morphology' (WHO 1987), respectively. The conclusion drawn by Morgentaler et al. 16 was that 'comparison of traditional morphology and strict criteria with regard to in vitro fertilization (IVF) outcome favored traditional morphology in several areas. In particular, low scores were more predictive of poor IVF outcome'.
One reason for the better agreement with the 'traditional method' is simply logical, as discussed above. With the 'strict criteria', one is so close to the ordinate that there is no place for the 'not normal'.
The article by Morgentaler et al. 16 was quoted by Mortimer and Menkveld 17, who classified it as one of the 'occasional publications with negative reports' and by Eliasson 2. In the 'structured reviews' by Coetzee et al. 18 and Van Waart et al. 19, and in the fifth edition of the WHO manual 6, one cannot find any reference to this publication.
The review by Van Waart et al. 19 is informative. From 421 seemingly valid abstracts, only 51 articles fulfilled the inclusion criteria. Of these, only nine (!) had sufficient data to be analysed statistically. A majority supported the 'Tygerberg strict criteria'. However, most of these came from the same research groups or institutions, and the work by Morgentaler et al. 16 was excluded. These facts ought to be viewed in the light of the claims that the 'Tygerberg strict criteria' are supported by a 'myriad of publications' (e.g., 20).
Section 2.13.2 of the new WHO manual 6 states, 'By the strict application of certain criteria of sperm morphology, relationships between the percentage of normal forms and various fertility endpoints (TTP, pregnancy rates in vivo and in vitro) have been established (Eggert-Kruse et al. 21; Jouannet et al. 22; Coetzee et al. 18; Toner et al. 23; Menkveld et al. 24; Van Waart et al. 19; Garrett et al. 25; Liu et al. 26) that may be useful for the prognosis of fertility'. Hopefully these authors used 'strict application of (their own) criteria', but that is not to be confused with the application of 'strict criteria'. Many of the articles quoted did not use 'strict criteria' as presented in the manual. For example, Jouannet et al.22 did not use that classification 'strict criteria' at all. Liu et al. 26 also fall into the same group, and they wrote that 'Normal sperm morphology (zona pellucida-bound, %)' was the same in the fertile and infertile groups (60% vs. 54%; not significantly different). Menkveld et al. 24 came to the following conclusion: 'For sperm morphology evaluated according to WHO criteria (1992—traditional method), the best cut-off point to identify the males with a possible subfertility problem based on the results of the fertile and subfertile populations investigated in this study was ≤ 30% morphologically normal spermatozoa with a sensitivity and specificity of 74.5% and 76.6%, respectively. For strict criteria, the cut-off point was ≤ 4% morphologically normal spermatozoa with a sensitivity of 74.5% and a specificity of 77.4%'. Please, note that there is hardly any difference between the two methods with reference to sensitivity and specificity.
The 'cutoff point' of ≤ 30% for 'normal' spermatozoa according to the 'traditional method' coincides with the reference limits found by both Eliasson 2 and Morgentaler et al. 15 (Figure 3). Toner et al. 23 from the Norfolk group, wrote that when they used logistic regression, morphology was the best predictor of pregnancy with a correlation coefficient (r) of 0.12. One can discuss whether an analysis with logistic regression allows for the use of 'r', but the 'correlation' is, by all standards, very weak.
Section 2.13 of the manual says: 'Using these guidelines ('strict criteria'—my comment), the range of percentage normal values during analysis of fertile and infertile men is likely to be in the range of 0%–30%, with few samples exceeding 25% normal spermatozoa 6. This low value will inevitably produce low thresholds discriminating between fertile and infertile populations; indeed with this method reference limits and thresholds of 3%–5% normal forms have been found in studies of in vitro fertilization (Coetzee et al. 18), intra-uterine insemination (Van Wart et al. 19) and in vivo fertility (Van der Merwe et al. 27)'. When these three supporting references are 'decoded for identity', one finds that all involved are well known for their work in favour of the 'Tygerberg strict criteria', for their engagement in assisted reproduction technology (ART) and for their many joint publications. The WHO Committee should have treated these three references as one in a discussion 'for' or 'against' 'strict criteria'.
The objective was to produce a manual on evidence-based medicine. It is therefore surprising to find that the WHO manual gives an unrestrictive recommendation for 'strict criteria' when it is known to be a controversial subject, and the support presented in the manual must be classified as weak. The likely explanation is the fact that the Committee had more members who supported the 'Tygerberg strict criteria' than opponents of it. This unfortunate bias must be avoided in future committees when WHO is dealing with controversial issues.
For those involved in ART, it is important that the methods be easy to teach and inexpensive to perform. In addition, the methods should maximize the proportion of candidates for the ART treatments. Coetzee et al. 18 wrote, 'The inclusion of an accurately evaluated normal sperm morphology count as an integral part of the standard semen analysis makes this analysis still the most cost-effective means of evaluating the male factor'. Staining the spermatozoa with the 'Quick-diff' is much faster and cheaper than with the Papanicolaou method. Technicians are not expected to find more than 5%–20% 'normal' spermatozoa. Physicians working with ART now have well-established methods, and the competition is on a totally different level. As we live in a competitive world, I can understand the attitude.
On the other hand, there are a number of reasons to regret that so many outside the ART field have uncritically accepted a non-scientific method for studies of the human male reproductive tract. All studies related to the effect of environmental factors on sperm morphology will be useless if the assessment is done with the 'Tygerberg strict criteria' simply because there is no room for any abnormalities caused by such factors. When one starts with a 'normal range' from 3% to around 50% for 'normal' spermatozoa and considers the size of methodological errors, one cannot find a population that is significantly different from the 'normal' one, unless environmental factors have significantly increased the percentage of 'normal' spermatozoa. Many studies on the potential danger from xenobiotic factors have been published. Some claim that a decrease in the percentage of 'normal' spermatozoa was observed, whereas, others did not find such an effect. I see no reason to single out any specific article but regard all this work as not meaningful and thus as an enormous waste of resources. In addition, it may be a danger to the public health, if incorrect conclusions are drawn from these studies.
The 'Aims of the manual' section states, 'The methods described here are guidelines to be used to improve the quality of semen analysis and comparability of results by the use of standard methods. They should not necessarily be taken as obligatory by local, national or global laboratory accreditation bodies'. The reality of life is that a majority of research workers and administrators will not read this, rather weak, 'disclaimer' (note the words 'not necessarily'), and the methods presented in the manual will thus be regarded as the 'gold standard'. Very few will understand that the manual is written mainly for those dealing with ART and with conventional studies of male contraception.
For the manual to be compiled and published, there must have been consensus among the WHO Committee members. It is necessary to quote from Dr Michael Fox, who discusses consensus as nonsensus in science 28: 'The concept of consensus means little more than a majority of opinions on a given matter. In politics this is the best we can do in making decisions to proceed with political actions. In the scientific world consensus is meaningless, often unscientific, and worse, often wrong. Even the act of seeking such a consensus as a form of proof is not science ... Serious scientists should welcome criticism, and many have in the past. Hypotheses are to be examined, modified, or abandoned, while knowledge is advanced, understanding improved. But it is not welcomed these days, which is, sadly, a most unscientific situation'.
I agree fully with Dr Fox and others claiming the same thing (e.g., the previously mentioned Dr Richard Feynman 1). I have not found the WHO manual to provide any scientific support in favour of the 'strict criteria' method, and I therefore do not understand how it can be promoted as the only option.
It would be most unfortunate if my critique of the method for assessment of sperm morphology and sperm motility were conceived as a general critique of the new WHO manual. In my mind, it has many good points, and my disagreements on details in other fields can, without difficulty, be concealed or discussed elsewhere.
References
- Gribbin J, Gribbin M, Feynman R.A Life in ScienceDutton: Penguin Books; 1997. Available from: http://www.friesian.com/feynman.htm .
- Eliasson R.Basic semen analysisIn: Matson P, editor. Current Topics in Andrology. Perth: Ladybrook Publishing; 2003p35–89.
- Handelsman DJ, Conway AJ, Boylan LM, Turtle JR. Testicular function in potential sperm donors: normal ranges and the effects of smoking and varicocele. Int J Androl. 1984;7:369–82. doi: 10.1111/j.1365-2605.1984.tb00794.x. [DOI] [PubMed] [Google Scholar]
- Andersen AG, Jensen TK, Carlsen E, Jørgensen N, Andersson AM, et al. High frequency of sub-optimal semen quality in an unselected population of young men. Hum Reprod. 2000;15:366–72. doi: 10.1093/humrep/15.2.366. [DOI] [PubMed] [Google Scholar]
- Holstein AF, Schulze W, Davidoff M. Understanding spermatogenesis is a prerequisite for treatment. Reprod Biol Endocrinol. 2003;1:107. doi: 10.1186/1477-7827-1-107. [DOI] [PMC free article] [PubMed] [Google Scholar]
- World Health Organization. WHO Laboratory Manual for the Examination and Processing of Human Semen, 5th ed. Geneva: World Health Organization; 2010
- Eliasson R.Sperm Count and Fertility: Facts and MythsIn: Frajese G, Hafez ES, Conti C, Fabbrini A, editors. Oligozoospermia: Recent Progress in Andrology. New York: Raven Press; 1981p1–7.
- David G, Jouannet P, Martin-Boyce A, Spira A, Schwarz D. Sperm counts in fertile and infertile men. Fertil Steril. 1979;31:453–5. [PubMed] [Google Scholar]
- MacLeod J, Wang Y. Male fertility potential in terms of semen quality: a review of the past, a study of the present. Fertil Steril. 1979;31:103–16. doi: 10.1016/s0015-0282(16)43808-2. [DOI] [PubMed] [Google Scholar]
- Smith KD, Rodriguez-Rigau LJ, Steinberger E. Relation between indices of semen analysis and pregnancy rate in infertile couples. Fertil Steril. 1977;28:1314–9. doi: 10.1016/s0015-0282(16)42976-6. [DOI] [PubMed] [Google Scholar]
- Sobrero AJ, Rehan NE. The semen of fertile men. II. Semen characteristics of 100 fertile men. Fertil Steril. 1975;26:1048–56. doi: 10.1016/s0015-0282(16)41469-x. [DOI] [PubMed] [Google Scholar]
- Zuckerman Z, Rodriguez-Rigau L, Smith K, Steinberger E. Frequency distribution of sperm counts in fertile and infertile males. Fertil Steril. 1977;28:1310–3. doi: 10.1016/s0015-0282(16)42975-4. [DOI] [PubMed] [Google Scholar]
- van Zyl JA, Menkveld R, van Kotze TJ, Retief AE, van Niekerk WA. Oligozoospermia: a seven-year survey of the incidence, chromosomal aberrations, treatment and pregnancy rate. Int J Fertil. 1975;20:129–32. [PubMed] [Google Scholar]
- Altman D, Machin D, Bryant T, Gardner S.Statistics with Confidence, 2nd edn. London: British Medical Journal Books; 2000p45–56.
- Adelson EH.Lightness Perception and Lightness IllusionsIn: Gazzaniga M, editor. The New Cognitive Neuroscience, 2nd edn. Cambridge, MA: MIT Press; 2000p333–51.
- Morgentaler A, Fung MY, Harris DH, Powers RD, Alper MM. Sperm morphology and in vitro fertilization outcome: a direct comparison of World Health Organization and strict criteria methodologies. Fertil Steril. 1995;64:1177–82. doi: 10.1016/s0015-0282(16)57981-3. [DOI] [PubMed] [Google Scholar]
- Mortimer D, Menkveld R. Sperm morphology assessment–historical perspectives and current opinion. J Androl. 2001;22:192–205. [PubMed] [Google Scholar]
- Coetzee K, Kruger TF, Lombard CJ. Predictive value of normal sperm morphology: a structured literature review. Hum Reprod Update. 1998;4:73–82. doi: 10.1093/humupd/4.1.73. [DOI] [PubMed] [Google Scholar]
- Van Waart J, Kruger TF, Lombard CJ, Ombelet W. Predictive value of normal sperm morphology in intrauterine insemination (IUI): a structured literature review. Hum Reprod Update. 2001;7:495–500. doi: 10.1093/humupd/7.5.495. [DOI] [PubMed] [Google Scholar]
- Claman P.Androlog Mail J Androl 200324329–31.12721207 [Google Scholar]
- Eggert-Kruse W, Schwarz H, Rohr G, Demirakca T, Tilgen W, et al. Sperm morphology assessment using strict criteria and male fertility under in-vivo conditions of conception. Hum Reprod. 1996;11:139–46. doi: 10.1093/oxfordjournals.humrep.a019007. [DOI] [PubMed] [Google Scholar]
- Jouannet P, Ducot B, Feneux D, Spira A. Male factors and the likelihood of pregnancy in infertile couples. I. Study of sperm characteristics. Int J Androl. 1988;11:379–94. doi: 10.1111/j.1365-2605.1988.tb01011.x. [DOI] [PubMed] [Google Scholar]
- Toner JP, Mossad H, Grow DR, Morshedi M, Swanson RJ, et al. Value of sperm morphology assessed by strict criteria for prediction of the outcome of artificial (intrauterine) insemination. Andrologia. 1995;27:143–8. doi: 10.1111/j.1439-0272.1995.tb01085.x. [DOI] [PubMed] [Google Scholar]
- Menkveld R, Wong WY, Lombard CJ, Wetzels AM, Thomas CM, et al. Semen parameters, including WHO and strict criteria morphology, in a fertile and subfertile population: an effort towards standardization of in-vivo thresholds. Hum Reprod. 2001;16:1165–71. doi: 10.1093/humrep/16.6.1165. [DOI] [PubMed] [Google Scholar]
- Garrett C, Liu DY, Clarke GN, Rushford DD, Baker HW. Automated semen analysis: 'zona pellucida preferred' sperm morphometry and straight-line velocity are related to pregnancy rate in subfertile couples. Hum Reprod. 2003;18:1643–9. doi: 10.1093/humrep/deg306. [DOI] [PubMed] [Google Scholar]
- Liu DY, Garrett C, Baker HW. Low proportions of sperm can bind to the zona pellucida of human oocytes. Hum Reprod. 2003;18:2382–9. doi: 10.1093/humrep/deg456. [DOI] [PubMed] [Google Scholar]
- Van der Merwe FH, Kruger TF, Oehninger SC, Lombard CJ. The use of semen parameters to identify the subfertile male in the general population. Gynecol Obstet Invest. 2005;59:86–91. doi: 10.1159/000082368. [DOI] [PubMed] [Google Scholar]
- Fox MR.Consensus is Nonsensus in Scientific Matters 2006 http://www.grassrootinstitute.org/GrassrootPerspective/ ConsensusNonsense.shtml .