Abstract
Purpose: To present the design and procedure of an experimental method for acquiring densely sampled organ dose map for CT applications, based on optically stimulated luminescence (OSL) dosimeters “nanoDots” and standard ATOM anthropomorphic phantoms; and to provide the results of applying the method—a dose data set with good statistics for the comparison with Monte Carlo simulation result in the future.
Methods: A standard ATOM phantom has densely located holes (in 3 × 3 cm or 1.5 × 1.5 cm grids), which are too small (5 mm in diameter) to host many types of dosimeters, including the nanoDots. The authors modified the conventional way in which nanoDots are used, by removing the OSL disks from the holders before inserting them inside a standard ATOM phantom for dose measurements. The authors solved three technical difficulties introduced by this modification: (1) energy dependent dose calibration for raw OSL readings; (2) influence of the brief background exposure of OSL disks to dimmed room light; (3) correct pairing between the dose readings and measurement locations. The authors acquired 100 dose measurements at various positions in the phantom, which was scanned using a clinical chest protocol with both angular and z-axis tube current modulations.
Results: Dose calibration was performed according to the beam qualities inside the phantom as determined from an established Monte Carlo model of the scanner. The influence of the brief exposure to dimmed room light was evaluated and deemed negligible. Pairing between the OSL readings and measurement locations was ensured by the experimental design. The organ doses measured for a routine adult chest scan protocol ranged from 9.4 to 18.8 mGy, depending on the composition, location, and surrounding anatomy of the organs. The dose distribution across different slices of the phantom strongly depended on the z-axis mA modulation. In the same slice, doses to the soft tissues other than the spinal cord demonstrated relatively small variations, with the maximum COV around 11.4%. This might be attributed to the angular mA modulation, the placement of the dosimeters, the chest cavity of the scanned region, and the size of the phantom. Doses to the spinal cord were consistently lower than those to other soft tissues.
Conclusions: The method is suited for acquiring densely sampled organ dose maps, and can be used for studying dose distributions relevant to subject size, organ location, and clinical CT protocols.
Keywords: CT, dose measurement, organ dose, OSL, ATOM phantom
INTRODUCTION
Management of CT dose
Computerized tomography (CT) is the leading contributor to the collective effective dose in the U.S. among all diagnostic imaging procedures,1 and has increased awareness of the potential radiation risks to the population. The accurate assessment of radiation dose has become an urgent task in the management in CT exposures.
Estimating doses deposited in certain radiosensitive targets, such as the fetuses of pregnant patients, is by itself important for assessing the radiation risks.2 CT doses at various locations can be assessed computationally through Monte Carlo simulations or experimentally using measurements.3
Experimental dose measurements are often performed using anatomical physical phantoms that are designed to allow small dosimeters to be placed at various locations corresponding to organs.3 Such dose measurements take into account of the influence of patient-specific tube current/voltage modulation techniques, and are therefore more accurate than methods using simple phantoms such as a cylinder or a slab.
Dosimetry with OSL dosimeters
An array of dosimeters are often used in an anthropomorphic phantom to obtain dose maps. Thermoluminescent dosimeters (TLD), optically stimulated luminescence (OSL) dosimeters, and metal oxide semiconductor field effect transistor (MOSFET) dosimeters are commonly used for this purpose. Although MOSFET detectors can provide real-time readout capability, the total number of simultaneous dose measurements is limited by the electronic probes. In comparison, TLD and OSL dosimeters are better suited for obtaining densely sampled dose maps.
The merits of TLD and OSL dosimeters have been discussed in the literature.4 As compared to TLD, some of the key advantages of OSL dosimeters include high sensitivity of the OSL material (synthetic sapphire Al2O3: C), the convenience of dosimeter preparation and readout, and all optical readout that can be precisely controlled.5, 6, 7
The CIRS ATOM anthropomorphic phantoms
One of the popular lines of the commercially available anthropomorphic phantoms is the ATOM series (ATOM Dosimetry Phantoms, CIRS Inc., VA). The ATOM phantoms are composed of tissue equivalent materials that simulate average soft tissue, average bone tissue, cartilage, spinal cord and disks, lung, brain, and sinus. The linear attenuation coefficients of these materials are within 3% of those of actual tissues for photon energies from 40 to 150 keV. The ATOM phantoms cover different patient ages and sizes: newborn, 1, 5, 10 year old, adult female, and adult male; and all the phantoms include head, torso, upper femur, and genitalia. These phantoms are sectional in design with 25-mm thick slices, and each slice contains holes and tissue equivalent plugs. In a standard ATOM phantom, the holes and plugs are 5 mm in diameter, positioned in 3 × 3 cm or 1.5 × 1.5 cm grids.
CIRS also manufactures ATOM phantoms with the organ dosimetry option (the “-D” option) with 14-mm diameter holes. This option of the ATOM phantoms can be used with nanoDot dosimeters, but the number of holes for dosimetry measurements are much less than that of standard ATOM phantoms. For example, there are only 12 holes on the 23rd slice of the female adult ATOM phantom (model ATOM 702-D), in comparison with 62 holes on the same slice of the standard phantoms (model ATOM 702-B) with 3 × 3 cm grid option, and more than 200 holes with the 1.5 × 1.5 cm grid option.
Motivation for this work
We intended to experimentally acquire dose maps in organs with large numbers of measurement points such that we could obtain detailed and precise dose distribution information within the scanned volume. In this paper, we described a method for acquiring dose measurements that can be sampled as densely as in 3 × 3 cm or 1.5 × 1.5 cm grids, using a standard ATOM phantom with the nanoDot OSL dosimeters.
We applied this method to acquire the dose distribution inside an ATOM phantom that was scanned using a LightSpeed Pro 16 CT (General Electric, WI). The scan protocol was a routine adult chest scan involving both angular tube current modulation (SmartmA) and z-axis tube current modulation (AutomA). The data set presented in this work fills the gap in the literature; it will be used for the comparison with Monte Carlo simulation results in a follow-up study.
MATERIALS AND METHODS
OSL dosimetry system and ATOM phantom
The OSL dosimetry system included the InLight nanoDot OSL dosimeters and the microStar reader (Landauer Inc., Glenwood, IL). This system has gained increasing popularity in the medical physics field.7, 8, 9, 10, 11, 12 The OSL dosimeters are made of 5-mm diameter and 0.2-mm thick plastic disks infused with Al2O3: C. The disks are encased in 10 × 10 × 2 mm3 light-tight plastic holders having a density of 1.03 g/cm3. The plastic leaves covering the front and back of the OSL disks are 0.36 mm thick.10
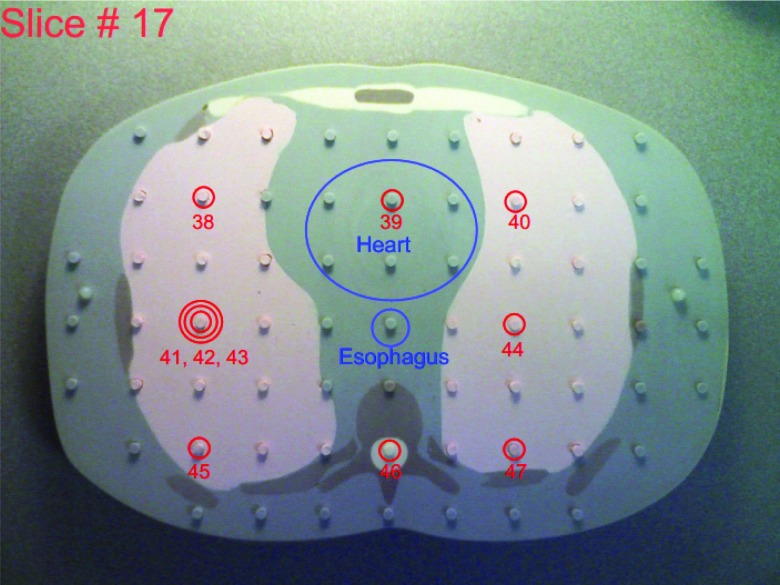
This study used the adult male ATOM phantom (model ATOM 701-B, CIRS Inc., VA), which is 173 cm in height, 73 kg in weight, and 23 × 32 cm in thorax dimensions. It has holes in 3 × 3 cm array in each 25-mm thick slice, and the diameter of the holes is 5 mm. Figure 1 illustrates the 17th slice of this phantom, with plugs partially removed for better visualization.
Figure 1.
A slice (17) of the ATOM phantom with the locations of OSL chips labeled and associated with organs.
Technical difficulties
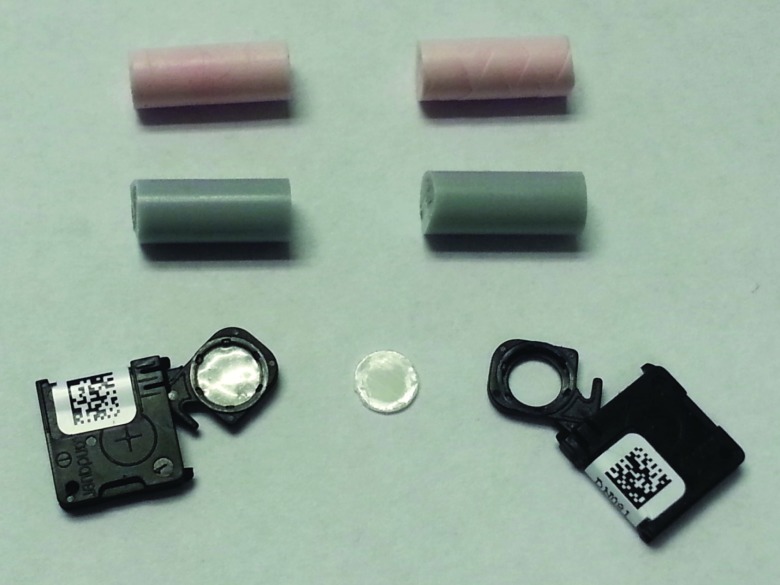
The design of the nanoDot dosimeters is unique in that an OSL disk is enclosed in its light-tight plastic holder and the holder is labeled with both bar code and serial number for its identification. Figure 2 shows an opened nanoDot chip and an OSL disk removed from its plastic holder.
Figure 2.
A nanoDot chip, an OSL disk removed from its holder, and halved plugs of the ATOM phantom.
Our method required the bare OSL disks to be used directly inside the phantom, which caused several technical obstacles:
-
OSL dose calibration
It has been reported that the dose response of OSL dosimeters is energy dependent in the diagnostic energy range,8 and therefore dose calibration needs to be applied to correctly interpret the direct dose readings from the OSL reader. The determination of the calibration factors is described in Sec. 2.D.
-
Influence of the OSL disk being briefly exposed to dimmed room light
It is reported that about 15% of the signal is dissipated in 2 h when the OSL disks are exposed in the dimmed lighting.7 In our procedure, the OSL disks are briefly exposed to dimmed room light during the removal or reinstallation process. The possible signal degradation was analyzed and presented in Sec. 2.E.
-
Identification of the bare OSL disks
OSL disks can be easily misidentified when removed from the cases. Our pairing scheme that ensures the correct matching between the OSL disks and their placements in the phantom is detailed in Sec. 2.C.
Experimental procedure of the dose measurements
Placement of OSLD for the dosimetry measurements
One hundred OSL disks were placed into the 10th to 22nd slice of the ATOM phantom, which represented the region typically covered in the routine adult chest CT scan at Massachusetts General Hospital (MGH). The dosimetry locations were carefully selected so that doses in important organs such as esophagus, lungs, heart, spinal cord, stomach, and liver were sampled. Large numbers of OSL dosimeters were placed into the lungs, the spinal cord, and the liver. When multiple dosimeters were used for an organ in a single slice, we tried to place the dosimeters uniformly along the long axis of the organ in that slice.
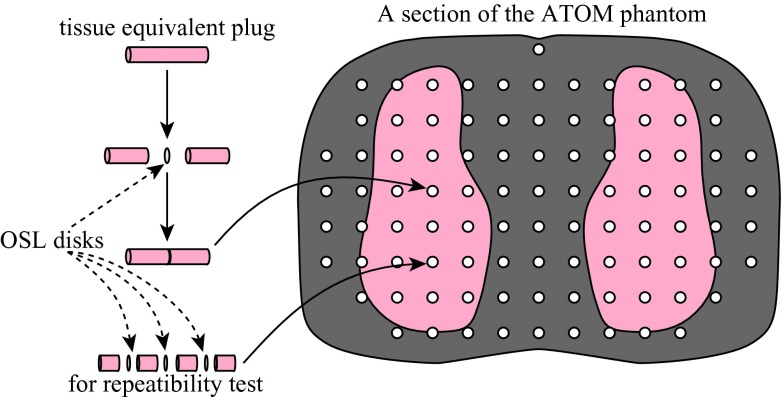
We photographed each of the phantom slices to assist the planning and recording of the placement of OSL dosimeters and their assignments to various organs: we circled the locations where OSL disks were to be embedded, numbered these locations (1–100), and marked the regions of interest (except for lungs and bones). The assignment of OSL dosimeters to various organs was facilitated by organ maps provided by CIRS for the ATOM phantom of dosimetry option (model ATOM 701-D, CIRS Inc., VA). The 17th slice of the ATOM phantom is shown in Fig. 1 as an example. In the location labeled with the triple-circle sign, three OSL disks were placed inside the same hole to test the repeatability of OSL dose measurements (Fig. 3). These photos are provided as the supplemental material13 of this paper.
Figure 3.
Embedding OSL disks inside the holes of the ATOM phantom.
The nanoDot dosimeters were read out for the background levels first. The OSL disks were then removed from the plastic holders (Fig. 2) with a 3.5-mm-diameter rod, and were embedded in the ATOM phantom one by one following the order of the location numbers (Fig. 3). For each dosimetry location, the serial number of the nanoDot was recorded.
CT scan with the ATOM phantom
The entire ATOM phantom was scanned using a GE LightSpeed Pro 16 scanner and the routine adult chest protocol at MGH. The scan parameters are shown in Table 1. The minimum and maximum allowable tube currents were selected for the “mA range” to enable full mA modulation. The phantom was centered in the x-y plane, and was scanned from the end of the neck (Slice 11 of the phantom) to approximately the diaphragm (Slice 22). Due to over ranging of the helical scan and scattered radiation, Slice 10 was also irradiated, and we placed OSL dosimeters in this slice as well. The CT images were reconstructed with 2.5 mm thickness and the Detail kernel.
Table 1.
Scan parameters of the helical chest CT protocol used in this study. “NI” stands for noise index.
| kVp | AutomA | SmartmA | mA range | NI | Rot. time | SFOV | Beam colli. | Pitch | CTDIvol |
|---|---|---|---|---|---|---|---|---|---|
| 120 | On | On | 10–670 | 20 | 0.5 s | Large | 16 × 1.25 mm | 0.938 | 11.89 mGy |
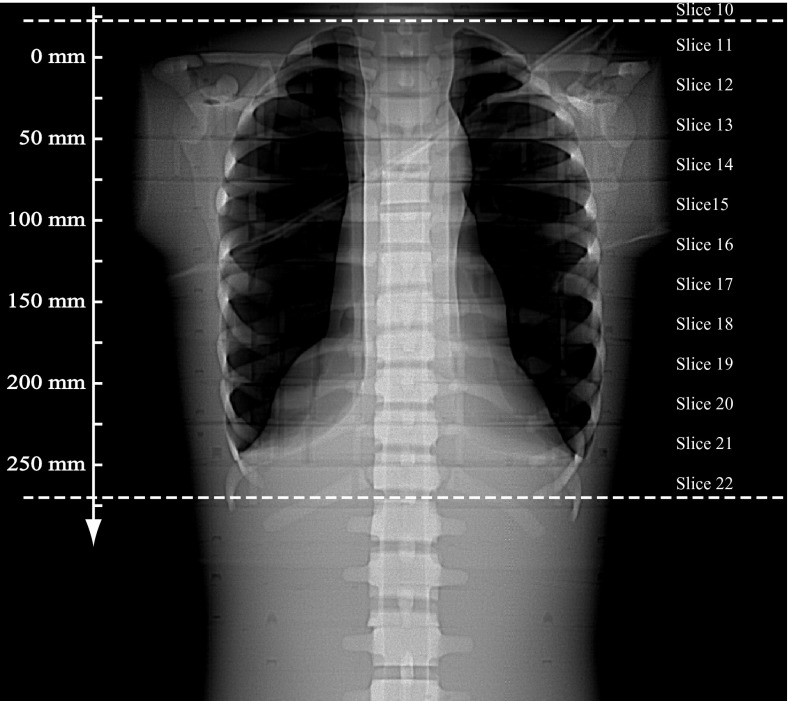
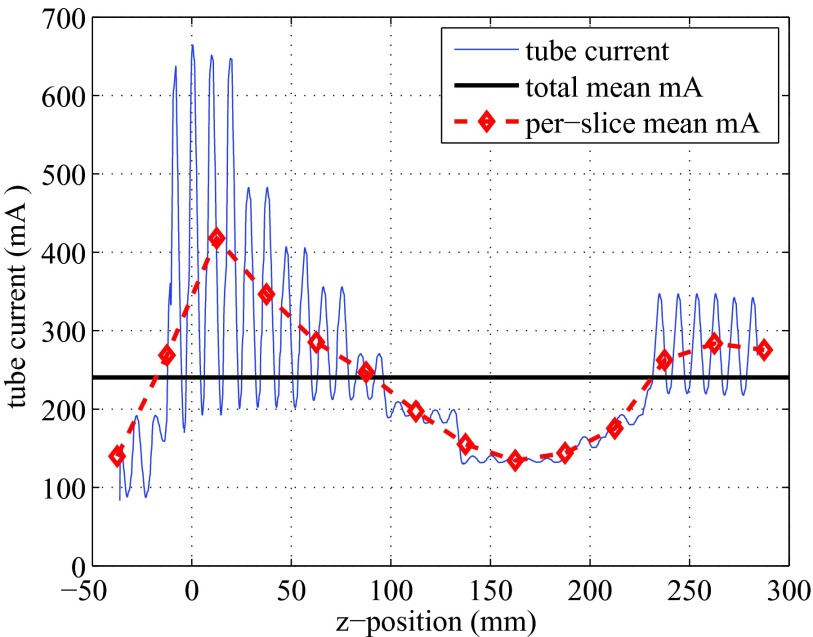
The Scout image (AP view) is shown in Fig. 4, with the prescribed scan range indicated by two horizontal dashed lines. The slice locations along the z-axis are also labeled on the axis. Since AutomA and SmartmA were both activated, the tube current was modulated along the z-axis in an oscillating manner. The tube current information was retrieved for each projection, and was plotted against the z-locations in Fig. 5.
Figure 4.
Scout image of the ATOM phantom scanned using a GE LightSpeed Pro 16 CT. The two dotted lines indicate the scan range. The z-locations are labeled on the axis.
Figure 5.
Tube current modulated at different z-locations, under SmartmA and AutomA. The horizontal line indicates the average tube current (240.45 mA). The dashed line represents the averaged mA in each 25-mm thick slice.
OSL readout after CT scan
The OSL dosimeters were read out within 24 h after the CT scan.8 The OSL disks were removed from the phantom, inserted back into the plastic holders with the aforementioned rod, and read out one by one. Special care was taken to reinstall the OSL disks back to their original plastic holders according to the recorded location numbers and OSL serial numbers. During the reinstallation process, an OSL disk was exposed to dimmed room light for less than 1 min. For each OSL dosimeter, the net dose reading was obtained by subtracting the background dose reading from the dose reading.
OSL dose calibration
It is well known that in the energy range of diagnostic x-ray imaging, the dose response of OSL dosimeters depends on the beam quality.8 To obtain the correct dose levels, the dose readings directly reported by the microStar reader need to be corrected. Al-Senan and Hatab reported the measurements of OSL dose calibration for the diagnostic energy range.8 Their calibration factors were obtained by comparing the dose readings from the nanoDot dosimeters and those from a parallel-plate ion chamber, under the exposure of a general radiographic tube with added aluminum filters.
Before applying these calibration factor on the dosimetry results in our experiments, we examined the beam quality of x-ray inside the phantom by a novel Monte Carlo method involving the MCNPX code.14 The simulation was performed using a model of a GE LightSpeed Pro 16 scanner developed in a previous study at Rensselaer Polytechnic Institute.15 A voxelized computational phantom, RANDO, was used and it is similar to the ATOM phantom in size, shape, and material compositions.
Sampling positions were set by creating boxes of 1 × 1 × 2.5 cm3 at positions in the RANDO phantom that approximately matched the positions of the OSL dosimeters in the ATOM phantom. These sampling points were grouped into organs according to the organ maps determined for the OSL dose measurement. During the Monte Carlo simulation of the CT scan, energy fluxes were obtained at each sampling point by tallying the flux information using the “F4 tally” functionality of the MCNPX code.14 Spectra were obtained by rebinning the collected energy flux into energy intervals of 5 keV from 0 to 120 keV. For each spectrum, half value layer (HVL) was calculated using the method of Ref. 16.
From the simulation, we observed that the beam quality of x-ray inside the phantom fell in the range of 6–7 mm Al, for which the calibration factor data in Ref. 8 have large variations. To better assist our OSL dose measurements, we measured the dose calibration factors ourselves.
Each calibration factor was obtained by comparing the readings at three different mAs levels from OSL nanoDots and from a 0.6 cm3 thimble chamber (10X6-0.6CT, Radcal Inc., CA). The thimble chamber was used as the reference because of its low energy dependency (5% for HVL ranged 3–20 mm Al).
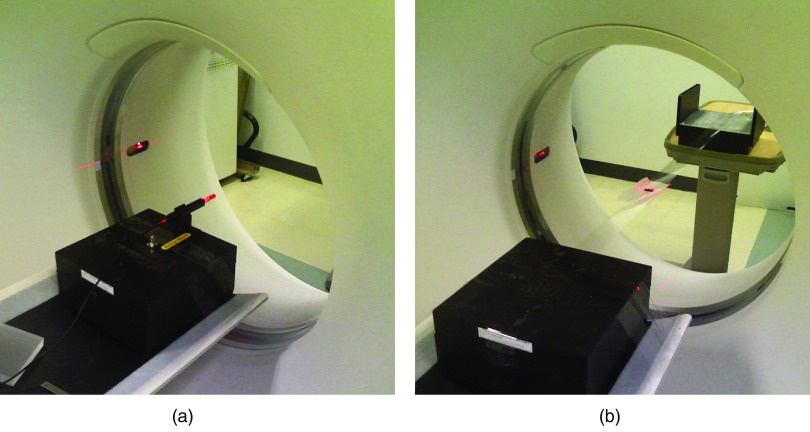
The dosimeters were placed at the iso-center of a GE LightSpeed 16 Pro system, and exposures were made with the tube parked at the 6 o'clock position under the service mode of the scanner (Fig. 6). To account for various beam qualities, we used 80–120 kVp with the body bowtie filter, and added 0–4 cm PMMA blocks on top of the tube output window. The measuring conditions were summarized in Table 2.
Figure 6.
Experimental setup for determining the dose calibration factors: (a) placement for the thimble chamber; (b) placement for the OSL dosimeters.
Table 2.
Calibration factors for converting OSL readings to thimble chamber readings, together with the measuring conditions. For each exposure, the body bowtie filter was used, and the beam collimation was 20 mm at the iso-center.
| kVp | Bowtie | PMMA (cm) | HVL (mm Al) | Calibration factor | Std. error | R2 |
|---|---|---|---|---|---|---|
| 80 | Body | 4 | 6.0 | 1.14 | 0.0063 | 0.9998 |
| 100 | Body | 0 | 6.5 | 1.21 | 0.0098 | 0.9997 |
| 100 | Body | 2 | 6.9 | 1.24 | 0.0037 | 1.0000 |
| 100 | Body | 4 | 7.3 | 1.26 | 0.0090 | 0.9997 |
| 120 | Body | 0 | 7.5 | 1.34 | 0.0102 | 0.9997 |
| 120 | Body | 2 | 7.9 | 1.36 | 0.0086 | 0.9993 |
At each of the three mAs stations, two nanoDots were exposed, and altogether six pairs of doses were used to determine the calibration factor through linear regression:
| (1) |
where C is the calibration factor.
In the calibration experiments, the thimble chamber measurements were given in air kerma. After applying the above correction factors, the raw OSL readings are converted to air kerma values. An f-factor of 1.06 was multiplied to these air kerma values to obtain the tissue absorbed doses.17, 18
Influence of OSL disks being briefly exposed to dimmed room light
To investigate the possible signal degradation during the removal and reinstallation of the OSL disks, we measured the dose readings from two irradiated nanoDot chips whose initial readings were very close. The OSL disk of one of the nanoDots was exposed by the dimmed room light for 1, 2, 4, and 8 min. With the dimmed lighting condition, the illuminance falling onto the OSL disk was measured as 30–40 lx with an photometer (model 07-621, Nuclear Associates, NY). For each time interval, two repeated readings were made to reduce the statistical error. The other nanoDot was kept intact and was read out for the same number of times, so as to distinguish the influence of being exposed to room light and the impact of repeated reading. It was reported that approximately 0.5% of the signal is depleted during each OSL reading for dose levels in diagnostic applications.8
RESULTS
The simulated photon energy spectra at various organs are demonstrated in Fig. 7. The beam qualities in terms of HVL are listed in Table 3. The calibration factors, as well as the standard errors and the coefficients of determination (R2), are presented in Table 2.
Figure 7.
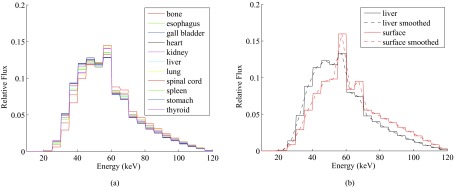
Comparison of x-ray spectra from the Monte Carlo simulation of the CT scan: (a) spectra inside inner organs; (b) spectra at phantom surface vs inside liver.
Table 3.
OSL dose calibration factors for converting OSL readings to thimble chamber readings, together with the HVL evaluated from the spectra in Fig. 7. The mean and standard deviation values were listed at the bottom of the table.
| Positions | HVL (mm Al) | C.F |
|---|---|---|
| Phantom surface | 7.7 | 1.35 |
| Lung | 7.0 | 1.25 |
| Bone | 6.9 | 1.24 |
| Kidneys | 6.9 | 1.24 |
| Esophagus | 6.7 | 1.23 |
| Thyroid | 6.6 | 1.22 |
| Spleen | 6.6 | 1.22 |
| Liver | 6.5 | 1.21 |
| Spinal cord | 6.4 | 1.20 |
| Heart | 6.4 | 1.20 |
| Gall bladder | 6.4 | 1.20 |
| Stomach | 6.3 | 1.19 |
| Avg (std.) | 6.6 (0.2) | 1.22 (0.02) |
To apply the calibration factors to the OSL readings with different beam qualities in Table 3, we linearly interpolated the calibration data points from 6 to 7.3 mm Al. The calibration factors used for various organs are listed in Table 3, together with the beam qualities evaluated from the respective spectra.
Table 4 compares the readings from the two nanoDots mentioned in Sec. 2.E, in order to examine the influence of exposing OSL briefly to dimmed room light. The signal drops from the original readings are also listed: about 5%–6% of the signal was lost over the ten readouts. The initial readings of the two OSL dosimeters differed by 0.12 mGy, and this difference fluctuated slightly between 0.07 and 0.21 mGy over the four time intervals.
Table 4.
Influence of exposing OSL to dimmed room light on the OSL readings. Each dose level was averaged from two repeated readings. “exp.” and “unexp.” stand for exposed and not exposed to dimmed room light, respectively.
| Time in light (min) | 0 | 1 | 2 | 4 | 8 |
|---|---|---|---|---|---|
| Reading (mGy), exp. | 11.31 | 11.16 | 10.99 | 10.77 | 10.67 |
| % signal drop, exp. | −1.29% | −2.83% | −4.75% | −5.66% | |
| Reading (mGy), unexp. | 11.18 | 11.00 | 10.78 | 10.70 | 10.60 |
| % signal drop, unexp. | −1.66% | −3.66% | −4.32% | −5.21% | |
| Diff. in reading (mGy) | 0.12 | 0.16 | 0.21 | 0.07 | 0.07 |
Table 5 lists the absorbed doses obtained from the OSL dosimeters associated with each organ. Large variations were observed for the thyroid (37.1%), the spinal cord (19.5%), and the lungs (15.7%). On the other hand, the other organs showed much smaller variations, with coefficients of variance (COV) below 11%. The category of “other soft tissues” contains OSL dosimeters that were not placed in the listed organs of interest, and we used the averaged calibration factor of 1.22 in Table 3 for their readings.
Table 5.
Dose measurements with the OSL dosimeters.
| Organ | No. of OSL | Slice no. | Avg. absorbed dose (mGy) | COV |
|---|---|---|---|---|
| Thyroid | 4 | 10–12 | 14.2 | 37.1% |
| Esophagus | 1 | 10 | 10.1 | NA |
| Thymus | 1 | 13 | 18.8 | NA |
| Heart | 4 | 16–19 | 12.8 | 7.4% |
| Lung | 50 | 12–21 | 13.8 | 15.7% |
| Spinal cord | 12 | 10–22 (ex. 13) | 9.4 | 19.5% |
| Kidney | 2 | 22 | 11.9 | 4.7% |
| Liver | 17 | 20–22 | 13.0 | 10.3% |
| Spleen | 2 | 21, 22 | 12.2 | 10.3% |
| Stomach | 4 | 20, 22 | 11.6 | 10.2% |
| Other soft tissues | 3 | 14, 15, 20 | 14.8 | 11.8% |
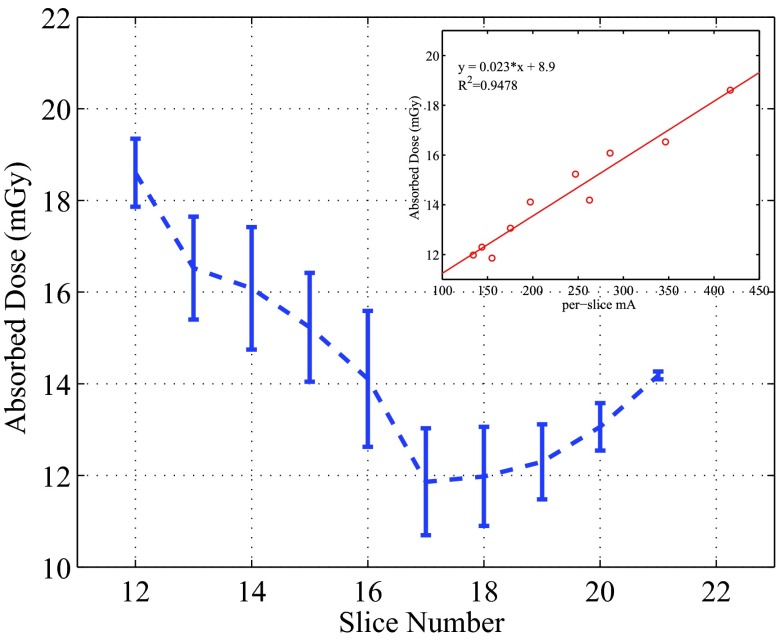
When designing this study, we were interested in examining the dose distributions in the lungs, and placed 50 OSL dosimeters in all the lung-containing slices (Slices 12–21). The per-slice averaged absorbed doses in the lungs ranged from 11.9 to 18.6 mGy, as plotted in Fig. 9. For the OSL dosimeters embedded in the same locations for the repeatability test, relative standard deviations of 3%–4% were observed. The dose samples of the lungs inside individual slices showed a low variability, with the maximum COV being 10.5%.
Figure 9.
Perslice averaged doses in the lungs, together with the relationship between the doses and the per-slice tube current. The error bars represent 1 standard deviation.
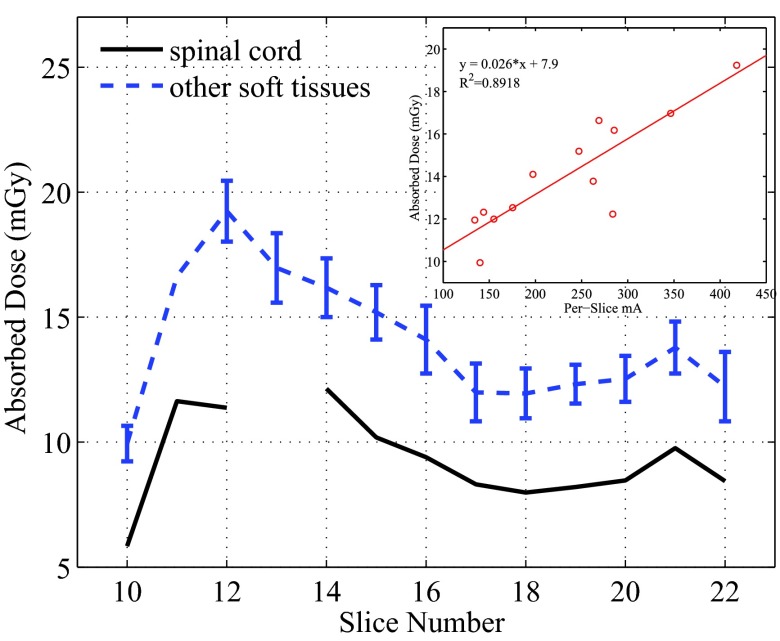
Similarly, the per-slice averaged absorbed doses were calculated from all measurement points except for the spinal cord, and these doses are compared with the those in the spinal cord in Fig. 10. The doses to the tissues except for the spinal cord within the same slices showed small variations with the maximum COV being about 11.4%.
Figure 10.
Per slice dose in the spinal cord and all other soft tissues. For the soft tissues, the averaged doses were plotted with error bars which represent 1 standard deviation. The relationship between these averaged doses and the averaged tube current was plotted for Slices 10–21 in the small figure.
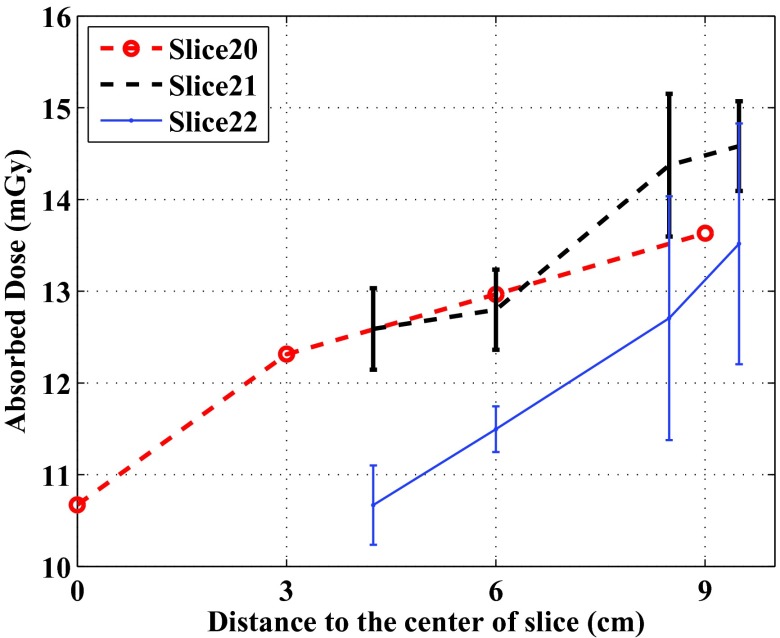
In Slices 20–22, more dose measurement points were placed in the soft tissue region (the gray material in the photos of the phantom slices), which enabled us to check the dose levels at different depths in the soft tissue region. In Slice 20, four OSL disks were placed evenly in a line which started from the center of the phantom (OSL 74) and ended at 9 cm from the center. Their dose levels were plotted against their distance to the slice center in Fig. 8.
Figure 8.
Comparison of dose levels at different distances from the centers of Slices 20–22 of the ATOM phantom. In Slices 21 and 22, the averaged data points with the same distances were plotted, and the error bars represent 1 standard deviation. In Slice 20, only single data points are available.
In Slices 21 and 22, multiple OSL dosimeters in the soft tissue region were not lined up with each other. We calculated the distances from the OSL dosimeters to the respective slice centers, and calculated the averaged doses with the same distances. These averaged dose levels were also plotted against the distance in Fig. 8.
DISCUSSION
About the proposed method
In this paper, we described a method that enables the experimental acquisition of densely sampled dose measurements using modified nanoDot OSL dosimeters and an ATOM anthropomorphic phantom. In the standard ATOM phantoms, the holes are positioned in 3 × 3 or 1.5 × 1.5 cm2 grids, but are too small (of 5 mm diameters) to host the nanoDot chips (10 × 10 × 2 mm3). ATOM phantoms specially designed for dosimetry purposes have large holes (14 mm diameter), but these holes are sparsely located. With our procedure, the OSL disks (5 mm diameter) instead of the entire OSL chips were inserted into the ATOM phantom, and densely sampled dose maps could be acquired. The dose maps are useful for validating Monte Carlo simulations and for investigating the dose distribution inside a standard anthropomorphic phantom with clinical scan protocols.
To correctly convert the direct OSL readings into dose measurement results, an energy dependent dose calibration needs to be applied. From Fig. 7a, we can see that the x-ray spectra at different organs have similar shapes. The HVL of the spectra of the organs ranged from 6.3 to 7.0 mm Al, with an average of 6.6 mm Al. These beam qualities were much softer than that of the beam at the phantom surface (with HVL of 7.7 mm Al). The softer beam inside the phantom may be attributed to the large components of scattered photons in the x-ray spectra, which generally have lower energy than the primary photons. Large scatter to primary ratios (S/P) have been reported in CT applications.19, 20, 21 For example, Boone reported that S/P at the center of a 32-cm-diameter PMMA phantom can be greater than 14 at 60 keV.20 Similar trend of reduced beam quality from the periphery to the center of cylindrical phantoms is also reported in Ref. 22.
According to the data shown in Table 2, the calibration factors should be carefully determined. For example, if the calibration factor was estimated based on the incident beam only, the dose measurements would be amplified by more than 10%.
From Table 4, 5%–6% of the original signals were lost over the ten readouts, which agreed with the reported signal depletion rate of about 0.5% per reading.8 The difference caused by the exposure to dimmed room light (0.05–0.09 mGy) is less than 1% of the readings, much smaller than the specified accuracy of the nanoDots (±5%). Considering this small difference, and the short exposure time, we chose to ignore this minor effect.
About the CT dose measurements
The CT scan parameters were based on the routine adult chest CT protocol at MGH. In the scanned thoracic region, the shape and composition of the phantom changed significantly, and the tube current modulation techniques strongly affect the dose distribution. In Fig. 5, the averaged tube current in each slice (25 mm thick) showed a strong trend, which was determined by the AutomA based on the shape and composition of the scanned volume: the averaged mA increased sharply from the end of the neck (Slices 10 and 11), reached to the maximum in the shoulder region (Slice 12), decreased gradually when the lungs were scanned (Slices 13–18), and grew back when less lung tissues were in the scanned volume (Slices 19–22). The localized oscillation of the tube current was caused by the SmartmA.
The per-slice averaged doses in Figs. 910 demonstrate strong dependence on the z-axis tube current modulation (AutomA). The spinal cord is surrounded by the vertebral bones, and is expected to receive lower dose than the other tissues. This was confirmed by the data shown in Fig. 10. Except for Slice 12, the per-slice dose in the spinal cord is found to be consistently lower by 3.7–5.0 mGy than the averaged slice dose in other tissues. The dose in the spinal cord of Slice 12 appeared as an outlier in the trend shown in Fig. 10. This may be attributed to the unusual configuration of the spinal cord and the vertebral bone in this slice (see the photos of Slices 12 and 13 in the supplemental material13). Because the hole for the spinal cord of the 13th slice is located in the bony area, we did not place an OSL dosimeter there. Except for this outlier, the trend of the doses in the spinal cord also agree well with the trend of the per-slice averaged mA.
The linear relationships shown in Figs. 910 also reveal that the doses deposited in one slice come not only from the x-ray beam directly irradiating the slice, but also from scatter radiation from neighboring slices. For example, in the equation in the inset of Fig. 10, y = 0.026x + 7.9, the y-intersect 7.9 reflects the dose contributed by the scattered x-ray from nearby slices, and the term 0.026x reflects how the dose was related to the tube current of the primary beam.
We also observed that the doses of tissues except for the spinal cord demonstrate small variations. The relatively uniform distribution of doses in each slice may be attributed to (1) the usage of the angular tube current modulation (SmartmA), which made the tube current and the incident exposure follow the changing patient anatomy; (2) the dosimeters were placed not too close to the surface of the phantom; (3) the size of the phantom is not very large (23 × 32 cm in thorax dimensions) as compared to, for example, a 32-cm diameter CT dose phantom. For the dose measurements using a 32-cm CT dose phantom, a strong dependency of dose levels on the distance from the central axis of the phantom to the measuring position can be easily observed: the dose measured at the peripheral positions can be twice as large as that at the phantom center. We expected to observe similar depth dependency in the regions of uniform soft tissue equivalent materials, and checked this in Slices 20–22 (Fig. 8). As can be seen, the doses increased as the measuring points are further away from the slice centers.
The organ dose levels in this study ranged from 9.4 to 18.8 mGy (Table 5), depending on the composition, locations, and the surrounding anatomic structures of the organs. The doses to the thyroid, the lungs, and the spinal cord showed larger variations than do other organs. This is due to the fact that the dosimeters in these three organs covered regions along the z-axis that underwent large changes in the per-slice tube current.
Limitation of this study
There are limitations in this study. A few OSL dosimeters were not placed in the designated locations of organs of interest, and were thus categorized as “other soft tissues.” Particularly, OSL 17 and 24 were placed close to but not in the esophagus; OSL 68 was placed near but not in the spleen. If the dose readings of OSL 17 and 24 are counted for the esophagus, the averaged dose in the esophagus will change from 10.1 to 13.9 mGy. Similarly, if OSL 68 is assigned to the spleen, the averaged dose in the spleen will change from 12.2 to 12.5 mGy. In addition, although the assignment of OSL dosimeters to different organs was facilitated by CIRS organ maps, there may still be uncertainty in the identification of organ locations, especially in the uniform tissue equivalent materials. Other possible errors include the reading uncertainty of OSL dosimeters and energy dependent calibration factors. The former can be reduced by taking the average of multiple OSL dosimeters that are placed inside the same hole, as demonstrated in Fig. 3 for the repeatability test. The energy dependent calibration factors for OSL in CT applications may be systematically investigated in a future study.
Reference 8 reported that with 120 kVp CT x-ray beams, the total dose variation due to the directions of incident beam on a nanoDot dosimeter is about 10%. One main contributor to this angular dependence is that x-rays from various directions are attenuated by different thicknesses of plastic before reaching the OSL disk (>1 mm through the four edges vs 0.36 mm through the front/back cover). In our method, we embedded the OSL disks directly inside the phantom, and eliminated the influence of the plastic covers. During the energy calibration process, we used intact nanoDot dosimeters and placed them such that the thin front/back plastic cover (0.36 mm thick) faced the incident beam. Considering the small thickness of the plastic leaves and the high beam quality of CT beam in this study, we did not investigate the possible difference caused by the presence/absence of the thin plastic leaves.
In conclusion, we have developed and demonstrated, for the first time, an experimental dosimetry method that is based on commercially available nanoDot OSL dosimeters and standard ATOM anthropomorphic phantoms. We modified the conventional way that nanoDot OSL dosimeters are used, in order to acquire densely sampled dose maps inside the phantom. We have considered several technical difficulties and provided solutions. The dose measurement results allowed us to examine dose distributions inside different organs, under the influence of both angular and z-axis tube current modulation techniques in a realistic clinical scan. It is our plan to use the dose data set for the validation of Monte Carlo simulations in the future.
ACKNOWLEDGMENTS
This research is sponsored in part by the National Institute of Biomedical Imaging and Bioengineering (R01EB015478). The authors want to acknowledge Dr. Dominic Crotty and Dr. Roy Nilsen of GE for providing the tube current data at each projection. The authors also want to thank Radcal Inc. for providing the thimble chamber.
References
- National Council on Radiation Protection and Measurements, “Ionizing radiation exposure of the population of the United States,” NCRP Report No. 160 (NCRP, Bethesda, MD, 2009).
- International Commission on Radiological Protection, “The 2007 recommendations of the International Commission on Radiological Protection on Radiological Protection, ICRP Publication 103,” Ann. ICRP 37, 1–332 (2007). [DOI] [PubMed] [Google Scholar]
- Handbook of Anatomical Models for Radiation Dosimetry, edited by Xu X. G. and Eckerman K. F. (Taylor & Francis, New York, 2009). 10.1201/EBK1420059793-f [DOI] [Google Scholar]
- McKeever S. W. S. and Moscovitch M., “Topics under debate—On the advantages and disadvantages of optically stimulated luminescence dosimetry and thermoluminescence dosimetry,” Radiat. Prot. Dosim. 104, 263–270 (2003). 10.1093/oxfordjournals.rpd.a006191 [DOI] [PubMed] [Google Scholar]
- Ruan C., Yukihara E. G., Clouse W. J., Gasparian P. B. R., and Ahmad S., “Determination of multislice computed tomography dose index (CTDI) using optically stimulated luminescence technology,” Med. Phys. 37, 3560–3568 (2010). 10.1118/1.3455285 [DOI] [PubMed] [Google Scholar]
- Yukihara E. G., Ruan C., Gasparian P. B. R., Clouse W. J., Kalavagunta C., and Ahmad S., “An optically stimulated luminescence system to measure dose profiles in x-ray computed tomography,” Phys. Med. Biol. 54, 6337–6352 (2009). 10.1088/0031-9155/54/20/020 [DOI] [PubMed] [Google Scholar]
- Jursinic P. A., “Characterization of optically stimulated luminescent dosimeters, OSLDs, for clinical dosimetric measurements,” Med. Phys. 34, 4594–4604 (2007). 10.1118/1.2804555 [DOI] [PubMed] [Google Scholar]
- Al-Senan R. M. and Hatab M. R., “Characteristics of an OSLD in the diagnostic energy range,” Med. Phys. 38, 4396–4405 (2011). 10.1118/1.3602456 [DOI] [PubMed] [Google Scholar]
- Al-Senan R., Mueller D. L., and Hatab M. R., “Estimating thyroid dose in pediatric CT exams from surface dose measurement,” Phys. Med. Biol. 57, 4211–4221 (2012). 10.1088/0031-9155/57/13/4211 [DOI] [PubMed] [Google Scholar]
- Jursinic P. A., “Changes in optically stimulated luminescent dosimeter (OSLD) dosimetric characteristics with accumulated dose,” Med. Phys. 37, 132–140 (2010). 10.1118/1.3267489 [DOI] [PubMed] [Google Scholar]
- Kerns J. R., Kry S. F., Sahoo N., Followill D. S., and Ibbott G. S., “Angular dependence of the nanoDot OSL dosimeter,” Med. Phys. 38, 3955–3962 (2011). 10.1118/1.3596533 [DOI] [PMC free article] [PubMed] [Google Scholar]
- Reft C. S., “The energy dependence and dose response of a commercial optically stimulated luminescent detector for kilovoltage photon, megavoltage photon, and electron, proton, and carbon beams,” Med. Phys. 36, 1690–1699 (2009). 10.1118/1.3097283 [DOI] [PubMed] [Google Scholar]
- See supplementary material at http://dx.doi.org/10.1118/1.4816299 for the photos of Slices 10–22.
- Pelowitz D.et al. , MCNPX User's Manual (Los Alamos National Laboratory, Los Alamos, New Mexico, 2005). [Google Scholar]
- Gu J., Bednarz B., Caracappa P. F., and Xu X. G., “The development, validation and application of a multi-detector CT (MDCT) scanner model for assessing organ doses to the pregnant patient and the fetus using Monte Carlo simulations,” Phys. Med. Biol. 54, 2699–2717 (2009). 10.1088/0031-9155/54/9/007 [DOI] [PMC free article] [PubMed] [Google Scholar]
- Boone J. M. and Seibert J. A., “An accurate method for computer-generating tungsten anode x-ray spectra from 30 to 140 kv,” Med. Phys. 24, 1661–1670 (1997). 10.1118/1.597953 [DOI] [PubMed] [Google Scholar]
- AAPM Task Group 23, The Measurement, Reporting, and Management of Radiation Dose in CT (American Association of Physicists in Medicine, College Park, MD, 2008). [Google Scholar]
- Jessen K., Shrimpton P., Geleijns J., Panzer W., and Tosi G., “Dosimetry for optimisation of patient protection in computed tomography,” Appl. Radiat. Isot. 50, 165–172 (1999). 10.1016/S0969-8043(98)00024-4 [DOI] [PubMed] [Google Scholar]
- Tsai H. Y., Tung C. J., Huang M. H., and Wan Y. L., “Analyses and applications of single scan dose profiles in computed tomography,” Med. Phys. 30, 1982–1989 (2003). 10.1118/1.1590315 [DOI] [PubMed] [Google Scholar]
- Boone J. M., “Dose spread functions in computed tomography: A Monte Carlo study,” Med. Phys. 36, 4547–4554 (2009). 10.1118/1.3223634 [DOI] [PMC free article] [PubMed] [Google Scholar]
- Li X., Zhang D., and Liu B., “Monte Carlo assessment of CT dose equilibration in PMMA and water cylinders with diameters from 6 to 55 cm,” Med. Phys. 40, 031903 (10pp.) (2013). 10.1118/1.4790470 [DOI] [PubMed] [Google Scholar]
- Mori S., Nishizawa K., Ohno M., and Endo M., “Conversion factor for CT dosimetry to assess patient dose using a 256-slice CT scanner,” Br. J. Radiol. 79, 888–892 (2006). 10.1259/bjr/66519303 [DOI] [PubMed] [Google Scholar]


