

Abstract
Purpose
Active surveillance (AS) is a treatment option for men with very low–risk prostate cancer (PCa); however, favorable outcomes achieved for men in AS are based on cohorts that under-represent African American (AA) men. To explore whether race-based health disparities exist among men with very low–risk PCa, we evaluated oncologic outcomes of AA men with very low–risk PCa who were candidates for AS but elected to undergo radical prostatectomy (RP).
Patients and Methods
We studied 1,801 men (256 AA, 1,473 white men, and 72 others) who met National Comprehensive Cancer Network criteria for very low–risk PCa and underwent RP. Presenting characteristics, pathologic data, and cancer recurrence were compared among the groups. Multivariable modeling was performed to assess the association of race with upgrading and adverse pathologic features.
Results
AA men with very low–risk PCa had more adverse pathologic features at RP and poorer oncologic outcomes. AA men were more likely to experience disease upgrading at prostatectomy (27.3% v 14.4%; P < .001), positive surgical margins (9.8% v 5.9%; P = .02), and higher Cancer of the Prostate Risk Assessment Post-Surgical scoring system (CAPRA-S) scores. On multivariable analysis, AA race was an independent predictor of adverse pathologic features (odds ratio, [OR], 3.23; P = .03) and pathologic upgrading (OR, 2.26; P = .03).
Conclusion
AA men with very low–risk PCa who meet criteria for AS but undergo immediate surgery experience significantly higher rates of upgrading and adverse pathology than do white men and men of other races. AA men with very low–risk PCa should be counseled about increased oncologic risk when deciding among their disease management options.
INTRODUCTION
Up to 19% of men with newly diagnosed prostate cancer have characteristics of very low–risk disease, defined by the National Comprehensive Cancer Network (NCCN) as prostate-specific antigen (PSA) < 10 ng/mL, PSA density ≤ 0.15 ng/mL/cm3, clinical stage ≤ T1c, Gleason sum ≤ 6, positive cores ≤ 2, and cancer involvement per core ≤ 50%.1–3 Currently, NCCN encourages active surveillance as the preferred treatment option for very low risk patients with life expectancies of less than 20 years because it potentially reduces overtreatment of indolent cancers while allowing for curative intervention if disease progression is detected. Indeed, oncologic outcomes for men in active surveillance cohorts are favorable. Among several major surveillance cohorts, the chance of progression by grade on subsequent biopsy is 2.5% to 28%, and 10-year disease-specific survival is 97% to 100%.4
A key limitation of these encouraging results, however, is their generalizability to minority populations including African American (AA) men. For example, 90% of the 1,050 men in our institutional active surveillance program are white, with African Americans accounting for only 6.5% (69 men). Similarly, only 24 (9.6%) of 249 men in the University of Miami active surveillance cohort are AA.5 Because AA men have a higher age-adjusted prostate cancer incidence (1.6 times) and poorer oncologic outcomes following primary treatment,6 it is imperative to determine the pathologic and oncologic outcomes of AA men with very low–risk prostate cancer to assess their suitability for active surveillance.
Among AA men with favorable disease characteristics, there are conflicting data regarding prostate-cancer outcomes. One study of 53 low risk African Americans (PSA, ≤ 10 ng/mL; clinical stage, ≤ T1c; Gleason sum, ≤ 6; positive cores, ≤ 2) who underwent radical prostatectomy at the University of Pennsylvania found that they had fared no worse than white patients regarding positive surgical margins, seminal vesicle invasion, pathologic upgrading, and biochemical recurrence.7 In contrast, another study of 24 very low–risk AA men (clinical stage, ≤ T2a; Gleason sum, ≤ 6; positive cores, ≤ 2; cancer involvement per core, ≤ 20%) who are part of the active surveillance cohort at the University of Miami found that patients whose disease progressed by grade or volume were more likely to be AA and that AA race was an independent predictor of disease progression on active surveillance.5 The factors that result in these divergent observations are unclear and may be influenced by the limited sample sizes used in these analyses.
Knowledge of potential health disparities among AA men with very low–risk prostate cancer is key to assess appropriateness for disease monitoring by active surveillance and to properly inform patients of the risks of surveillance and expected outcomes at surgery. Because of the limited information on African Americans in active surveillance, we sought to determine if oncologic outcomes for African Americans who were candidates for active surveillance but elected to undergo immediate radical prostatectomy were comparable to those of white patients and patients of other races.
PATIENTS AND METHODS
We retrospectively analyzed a database of 19,142 men who had undergone radical prostatectomy at Johns Hopkins since 1992 (PSA era). Men who received neoadjuvant hormonal treatments (n = 833) were excluded from analysis. We studied 1,801 men who had very low–risk disease as defined by NCCN criteria (clinical stage, ≤ T1c; biopsy Gleason sum, ≤ 6; number of positive biopsy cores, ≤ 2; maximum percent core involvement, ≤ 50; PSA, < 10 ng/mL; and PSA density, ≤ 0.15 ng/mL/cm3). PSA density was calculated using preoperative serum PSA and pathologic prostate weights.8
Minimum follow-up after surgery included yearly symptom assessment and PSA measurements. For men who did not receive follow-up at Johns Hopkins, yearly data were mailed in from patients and referring institutions. Biochemical failure was defined as a postoperative PSA ≥ 0.2 ng/mL. For the entire cohort, mean and median follow-up was 4.4 and 3.0 years, respectively.
We analyzed a subset of men who reflected modern clinical practice: extended sampling at diagnosis (≥ 10 biopsy cores) in the contemporary Gleason grading era (2004 to present). The modern Gleason grading system is based on The International Society of Urological Pathology consensus scheme that assigns cribriform glands and ill-defined glands with poorly formed lumina to pattern 4 instead of pattern 3.9 Patient biopsy samples were reviewed at Johns Hopkins, and radical prostatectomy specimens were processed as previously described and were analyzed centrally by genitourinary pathologists.10
In addition to standard measures of cancer control, we evaluated rates of adverse pathologic findings, defined as pT2 and ≥ G4 + 3, or pT3a and G3 + 3 and PSM, or pT3a and ≥ G3 + 4, or ≥ pT3b.3,11 We also studied predictive outcomes based on the Cancer of the Prostate Risk Assessment Post-Surgical scoring system (CAPRA-S), a validated predictor of biochemical recurrence that ranges from 0 to 12 points based on serum PSA, pathologic Gleason pattern, lymph node involvement, extracapsular extension, seminal vesicle invasion, and positive surgical margins. We defined increased/higher recurrence risk in this cohort as a CAPRA-S ≥ 3, which is associated with a 27.2% or higher 5-year risk of recurrence.12
Median values of continuous variables were compared using t tests and by Wilcoxon-Mann-Whitney rank-sum tests for non-normally distributed variables. Proportions were tested by χ2 tests and by Fisher's exact tests for variables with low expected event frequencies. Univariate and multivariable logistic regression analyses were used to model adverse pathologic findings, high pathologic risk scores (CAPRA-S ≥ 3), and upgrading at prostatectomy. The level of statistical significance was predefined at P < .05 (two-tailed). To correct for multiple comparisons, the Bonferroni correction was applied: P values were considered significant if less than .025 in Tables 1 and 2; P values were considered significant if less than .0125 in Figure 1A and less than .01 in Figure 1B. Multivariable regression analyses were performed including all variables studied on univariate analyses: race, preoperative PSA, prostate weight, age, family history, percent positive biopsy cores, maximum percent cancer involvement per core, body mass index (BMI), and Charlson comorbidity index. This study was approved by the institutional review board. Statistical analyses were performed with Stata 11.0 (StataCorp, College Station, TX).
Table 1.
Baseline Characteristics and Cancer Outcomes of NCCN Very Low–Risk Men Undergoing Radical Prostatectomy at Johns Hopkins, 1992-2012
| Characteristic | White (n = 1,473) |
AA (n = 256) |
Other Race (n = 72) |
P (AA to white) | P (other to white) | |||
|---|---|---|---|---|---|---|---|---|
| No. of Patients | % | No. of Patients | % | No. of Patients | % | |||
| Age, years | .02 | .78* | ||||||
| Median | 58.0 | 57.0 | 58.0 | |||||
| IQR | 54.0-62.0 | 52.0-61.5 | 53.0-62.0 | |||||
| PSA, ng/mL | .28* | .41* | ||||||
| Median | 4.5 | 4.6 | 4.6 | |||||
| IQR | 3.5-5.6 | 3.4-5.9 | 3.7-5.9 | |||||
| Prostate size, g | .04* | .05* | ||||||
| Median | 55.0 | 56.7 | 50.0 | |||||
| IQR | 46.0-69.0 | 48.0-69.6 | 42.3-69.9 | |||||
| PSA density, ng/mL/g | .31* | .40* | ||||||
| Median | 0.09 | 0.09 | 0.09 | |||||
| IQR | 0.07-0.12 | 0.06-0.12 | 0.06-0.12 | |||||
| Percent positive biopsy cores | < .01* | .03* | ||||||
| Median | 8.3 | 16.7 | 11.1 | |||||
| IQR | 8.3-16.7 | 10.0-25.0 | 8.3-16.7 | |||||
| Percent cancer per core | < .01* | .57* | ||||||
| Median | 20.0 | 20.0 | 20.0 | |||||
| IQR | 10.0-30.0 | 10.0-30.0 | 10.0-22.5 | |||||
| Family history | 460 of 1,464 | 31.4 | 82 of 253 | 32.4.0 | 18 of 72 | 25.0 | .75 | .25 |
| BMI, kg/m2 | < .01* | .84* | ||||||
| Median | 26.6 | 27.6 | 26.6 | |||||
| IQR | 24.8-29.0 | 26.1-30.0 | 24.5-29.4 | |||||
| Charlson index | .16 | .51† | ||||||
| 0 | 979 of 1,134 | 86.3 | 191 of 234 | 81.6 | 51 of 61 | 83.6 | ||
| 1 | 133 of 1,134 | 11.7 | 36 of 234 | 15.4 | 8 of 61 | 13.1 | ||
| 2 or 3 | 22 of 1,134 | 1.9 | 7 of 234 | 3.0 | 2 of 61 | 3.3 | ||
| Pathologic stage | .02† | .43† | ||||||
| pT2N0 | 1,341 of 1,473 | 91.0 | 225 of 256 | 87.9 | 66 of 72 | 91.7 | ||
| pT3aN0 | 124 of 1,473 | 8.4 | 27 of 256 | 10.5 | 5 of 72 | 6.9 | ||
| pT3bN0 | 8 of 1,473 | 0.5 | 2 of 256 | 0.8 | 1 of 72 | 1.4 | ||
| pN1 | 0 of 1,473 | 0 | 2 of 256 | 0.8 | 0 of 72 | 0 | ||
| Pathologic Gleason | < .01† | .08† | ||||||
| ≤ 6 | 1,261 of 1,473 | 85.6 | 186 of 256 | 72.7 | 55 of 72 | 76.4 | ||
| 7 (3 + 4) | 163 of 1,473 | 11.1 | 53 of 256 | 20.7 | 15 of 72 | 20.8 | ||
| 7 (4 + 3) | 34 of 1,473 | 2.3 | 12 of 256 | 4.7 | 1 of 72 | 1.4 | ||
| ≥ 8 | 15 of 1,473 | 1.0 | 5 of 256 | 2.0 | 1 of 72 | 1.4 | ||
| Upgrade | 212 of 1,473 | 14.4 | 70 of 256 | 27.3 | 17 of 72 | 23.6 | < .01 | .03 |
| Positive surgical margin | 87 of 1,470 | 5.9 | 25 of 255 | 9.8 | 3 of 72 | 4.2 | .02 | .54 |
| Adverse pathology§ | 113 of 1,473 | 7.7 | 36 of 256 | 14.1 | 5 of 72 | 6.9 | < .01 | .82 |
| CAPRA-S ≥ 3 | 102 of 1,473 | 6.9 | 38 of 256 | 14.8 | 6 of 72 | 8.3 | < .01 | .65 |
| Follow-up, years | < .01* | .31* | ||||||
| Mean | 4.5 | 3.8 | 3.8 | |||||
| Median | 4.0 | 2.0 | 3.0 | |||||
| IQR | 1.0-4.0 | 1.0-5.0 | 1.0-5.0 | |||||
| Biochemical recurrence | 21 of 1,453 | 1.4 | 10 of 249 | 4.0 | 1 of 69 | 1.4 | < .01‡ | .71‡ |
| Metastasis | 3 of 857 | 0.4 | 1 of 147 | 0.7 | 0 of 32 | 0 | .39‡ | — |
| Cancer-specific deaths | 0 of 898 | 0 | 0 of 164 | 0 | 0 of 34 | 0 | — | — |
| All-cause deaths | 22 of 898 | 2.4 | 7 of 164 | 4.3 | 0 of 34 | 0 | .09‡ | — |
NOTE. Boldfaced values represent statistically significant differences between groups after Bonferroni correction.
Abbreviations: AA, African American; BMI, body mass index; CAPRA-S, Cancer of the Prostate Risk Assessment Post-Surgical scoring system; IQR, interquartile range; NCCN, National Comprehensive Cancer Network; PSA, prostate-specific antigen.
P value derived from Wilcoxon-Mann-Whitney test.
P value derived from Fisher's exact test.
P value derived from log-rank test.
Adverse pathologic findings: pT2 and ≥ G4 + 3 or pT3a and G3 + 3 and PSM or pT3a and ≥ G3 + 4 or ≥ pT3b.
Table 2.
Baseline Characteristics and Cancer Outcomes of NCCN Very Low–Risk Men With Extended Biopsy Sampling (≥ 10 cores) in the Contemporary Gleason Era (2004-2012) Undergoing Radical Prostatectomy at Johns Hopkins
| Characteristic | White (n = 223) |
AA (n = 101) |
Other Race (n = 35) |
P (AA to white) | P (other to white) | |||
|---|---|---|---|---|---|---|---|---|
| No. of Patients | % | No. of Patients | % | No. of Patients | % | |||
| Age, years | .16* | .33* | ||||||
| Median | 59.0 | 58.0 | 57.5 | |||||
| IQR | 55.0-63.0 | 53.0-62.0 | 53.0-62.0 | |||||
| PSA, ng/mL | .44* | .98* | ||||||
| Median | 4.3 | 4.4 | 4.4 | |||||
| IQR | 3.3-5.7 | 3.5-5.7 | 3.4-5.5 | |||||
| Prostate size, g | .65* | .02* | ||||||
| Median | 56.4 | 56.7 | 49.7 | |||||
| IQR | 47.8-68.3 | 47.0-71.8 | 42.2-66.0 | |||||
| PSA density, ng/mL/g | .90* | .99* | ||||||
| Median | 0.09 | 0.09 | 0.10 | |||||
| IQR | 0.06-0.11 | 0.07-0.11 | 0.05-0.12 | |||||
| Percent positive biopsy cores | .05* | .22* | ||||||
| Median | 8.3 | 10.0 | 8.3 | |||||
| IQR | 8.3-16.7 | 8.3-16.7 | 8.3-12.5 | |||||
| Percent cancer per core | .93* | .84* | ||||||
| Median | 10.0 | 20.0 | 20.0 | |||||
| IQR | 5.0-30.0 | 10.0-30.0 | 10.0-20.0 | |||||
| Family history | 87 of 223 | 39.0 | 43 of 101 | 42.6 | 11 of 35 | 31.4 | .55 | .39 |
| BMI, kg/m2 | .15* | .51* | ||||||
| Median | 26.8 | 27.6 | 26.8 | |||||
| IQR | 24.6-29.8 | 26.0-30.1 | 24.1-29.2 | |||||
| Charlson index | .21† | .29† | ||||||
| 0 | 191 of 223 | 85.7 | 82 of 101 | 81.2 | 30 of 35 | 85.7 | ||
| 1 | 25 of 223 | 11.2 | 18 of 101 | 17.8 | 3 of 35 | 8.6 | ||
| 2 or 3 | 7 of 223 | 3.1 | 1 of 101 | 1.0 | 2 of 35 | 5.7 | ||
| Pathologic stage | < .01† | 1.0† | ||||||
| pT2N0 | 212 of 223 | 95.1 | 87 of 101 | 86.1 | 34 of 35 | 97.1 | ||
| pT3aN0 | 10 of 223 | 4.5 | 14 of 101 | 13.9 | 1 of 35 | 2.9 | ||
| pT3bN0 | 1 of 223 | 0.4 | 0 of 101 | 0 | 0 of 35 | 0 | ||
| Pathologic Gleason | < .01† | .21† | ||||||
| ≤ 6 | 195 of 223 | 87.4 | 68 of 101 | 67.3 | 28 of 35 | 80.0 | ||
| 7 (3 + 4) | 20 of 223 | 9.0 | 25 of 101 | 24.5 | 6 of 35 | 17.1 | ||
| 7 (4 + 3) | 6 of 223 | 2.7 | 5 of 101 | 5.0 | 0 of 35 | 0 | ||
| ≥ 8 | 2 of 223 | 0.9 | 3 of 101 | 3.0 | 1 of 35 | 2.9 | ||
| Upgrade | 28 of 223 | 12.6 | 33 of 101 | 32.7 | 7 of 35 | 20.0 | < .01 | .23 |
| Positive surgical margin | 14 of 221 | 6.3 | 19 of 100 | 19.0 | 1 of 35 | 2.9 | < .01 | .42 |
| Adverse pathology‡ | 16 of 223 | 7.2 | 20 of 101 | 19.8 | 1 of 35 | 2.9 | < .01 | .34 |
| CAPRA-S ≥ 3 | 12 of 211 | 5.7 | 21 of 101 | 21.0 | 2 of 35 | 5.7 | < .01 | .94 |
| Follow-up, years | .13* | .89* | ||||||
| Mean | 2.6 | 2.2 | 2.5 | |||||
| Median | 2.0 | 2.0 | 2.0 | |||||
| IQR | 1.0-4.0 | 1.0-3.0 | 1.0-3.0 | |||||
| Biochemical recurrence | 0 of 219 | 0 | 3 of 99 | 3.0 | 1 of 32 | 3.1 | — | — |
| Metastasis | 0 of 111 | 0 | 0 of 49 | 0 | 0 of 13 | 0 | — | — |
| Cancer-specific death | 0 of 114 | 0 | 0 of 56 | 0 | 0 of 13 | 0 | — | — |
| All-cause deaths | 1 of 114 | 0.9 | 0 of 56 | 0 | 0 of 13 | 0 | — | — |
NOTE. Boldfaced values represent statistically significant differences between groups after Bonferroni correction.
Abbreviations: AA, African American; BMI, body mass index; CAPRA-S, Cancer of the Prostate Risk Assessment Post-Surgical scoring system; IQR, interquartile range; NCCN, National Comprehensive Cancer Network; PSA, prostate-specific antigen.
P value derived from Wilcoxon-Mann-Whitney test.
P value derived from Fisher's exact test.
Adverse pathologic findings: pT2 and ≥ G4 + 3 or pT3a and G3 + 3 and PSM or pT3a and ≥ G3 + 4 or ≥ pT3b.
Fig 1.
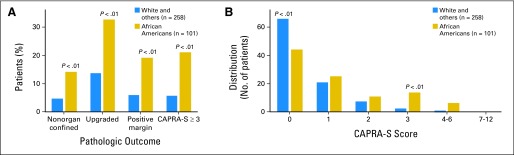
Pathologic outcomes and distribution of Cancer of the Prostate Risk Assessment Post-Surgical scoring system (CAPRA-S) scores of National Comprehensive Cancer Network very low–risk African Americans compared with very low–risk patients of white and other races: men with extended biopsy sampling within the contemporary Gleason era.
RESULTS
Preoperative characteristics between the cohorts of very low–risk white men (n = 1,473) and AA men (n = 256) were similar, with African Americans having slightly worse Charlson comorbidity scores (Table 1). Examination of pathologic parameters revealed that AA men had a lower rate of organ-confined cancers (87.9% v 91.0%; P = .004) and a higher rate of Gleason upgrading (27.3% v 14.4%; P < .001). Furthermore, African Americans demonstrated a significantly higher hazard of biochemical recurrence (4.0% v 1.4%; log-rank P = .004). Adverse pathologic findings were more common in AA patients than white patients (14.1% v 7.7%; P = .001). Also, the rate of increased pathologic risk score (CAPRA-S ≥ 3) was also significantly higher in African Americans (14.8% v 6.9%; P < .001). With a median follow-up of 3.0 years (AA patients, 2.0 years; white patients, 4.0 years), there were no differences in metastasis-free, cancer-specific, or overall survival.
Men of other races (neither white nor AA) were analyzed as a separate category. Seventy-two men were classified as very low risk and presented with overall characteristics similar to white men (Table 1). Of note, the rate of upgrading was higher in non-AA, non-white men compared with white men alone (23.6% v 14.4%; P = .032), though this finding was not statistically significant after the Bonferroni correction was taken into consideration. Rates of adverse pathology, higher CAPRA-S scores (≥ 3), and BCR did not differ between the two groups (P = .821, P = .647, and P = .711, respectively).
To reflect modern clinical practice, we analyzed a cohort of only men with extended biopsy sampling (≥ 10 cores) in the era of modern Gleason grading, adopted by Johns Hopkins in 2004. This cohort consisted of 223 white patients, 101 AA patients, and 35 patients of other races. In this group, baseline and preoperative disease characteristics were similar between AA patients, white patients, and patients of other races (Table 2). However, compared with white men, AA men continued to experience higher rates of upgrading (32.7% v 12.6%; P < .001), positive margins (19.0% v 6.3%; P = .001), adverse pathology (19.8% v 7.2%; P = .001), and higher pathologic risk score (CAPRA-S, ≥ 3; 21.0% v 5.7%; P < .001). The distribution of CAPRA-S scores for this cohort are shown in Figure 1.
Furthermore, the 101 AA men in the contemporary extended-sampling cohort were compared to determine whether AA race was an independent predictor of adverse oncologic outcomes using multivariable modeling after adjustment for preoperative parameters known to influence pathologic outcomes and disease recurrence.13,14 Because of the small cohort of men of other races and the overall similarity of their results with those of the white patients, AA men were compared with a referent group composed of 258 men (223 white men and 35 men of other races). AA race was an independent predictor of adverse pathology (adjusted odds ratio [OR], 3.23; P = .03; Table 3), higher pathologic risk CAPRA-S score (≥ 3; adjusted OR, 6.57; P = .001; Table 4), and upgrading at prostatectomy (adjusted OR, 2.26; P = .03; Table 5).
Table 3.
Predictors of Adverse Pathology in Men With Extended Biopsy Sampling (≥ 10 cores) in the Contemporary Gleason Era (2004-present): Univariate and Multivariable Logistic Regressions; Adverse Pathologic Findings: pT2 and ≥ G4 + 3 or pT3a and G3 + 3 and PSM or pT3a and ≥ G3 + 4 or ≥ pT3b
| Characteristic | Adverse Pathologic Features |
|||||
|---|---|---|---|---|---|---|
| Univariate |
Multivariable |
|||||
| OR | 95% CI | P | OR | 95% CI | P | |
| African American race (referent: white or other) | 3.50 | 1.75 to 7.01 | < .01 | 3.23 | 1.16 to 9.03 | .03 |
| PSA | 1.18 | 1.01 to 1.38 | .04 | 1.42 | 1.04 to 1.94 | .03 |
| Prostate weight | 1.00 | 0.99 to 1.01 | 1.0 | 0.98 | 0.95 to 1.01 | .15 |
| Age | 1.07 | 1.01 to 1.13 | .03 | 1.02 | 0.94 to 1.12 | .58 |
| Family history | 0.54 | 0.25 to 1.15 | .11 | 0.80 | 0.27 to 2.32 | .68 |
| Percentage positive biopsy cores | 1.16 | 1.07 to 1.26 | < .01 | 1.12 | 0.99 to 1.27 | .06 |
| Maximum percent cancer per core | 1.01 | 0.99 to 1.04 | .25 | 1.00 | 0.97 to 1.04 | .94 |
| BMI ≥ 30 kg/m2 | 1.18 | 0.44 to 3.14 | .74 | 1.35 | 0.44 to 4.14 | .60 |
| Charlson comorbidity | 1.01 | 0.49 to 2.09 | .97 | 1.13 | 0.39 to 3.31 | .82 |
NOTE. Boldfaced values represent statistically significant ORs.
Abbreviations: BMI, body mass index; OR, odds ratio; PSA, prostate-specific antigen.
Table 4.
Predictors High Pathologic Risk Score (CAPRA-S ≥ 3) in Men With Extended Biopsy Sampling (≥ 10 cores) Treated in the Contemporary Gleason Era (2004-present): Univariate and Multivariable Logistic Regressions
| Characteristic | CAPRA-S ≥3 |
|||||
|---|---|---|---|---|---|---|
| Univariate |
Multivariable |
|||||
| OR | 95% CI | P | OR | 95% CI | P | |
| African American race (referent: white or other) | 4.58 | 2.22 to 9.42 | < .01 | 6.57 | 2.10 to 20.6 | < .01 |
| PSA | 1.35 | 1.15 to 1.59 | < .01 | 1.70 | 1.21 to 2.41 | < .01 |
| Prostate weight | 1.01 | 1.00 to 1.02 | .10 | 0.99 | 0.96 to 1.01 | .28 |
| Age | 1.06 | 1.00 to 1.13 | .05 | 1.07 | 0.97 to 1.19 | .17 |
| Family history | 0.68 | 0.32 to 1.44 | .32 | 0.98 | 0.32 to 3.04 | .97 |
| Percentage positive biopsy cores | 1.14 | 1.05 to 1.23 | < .01 | 1.05 | 0.92 to 1.20 | .43 |
| Max percent cancer per core | 1.01 | 0.99 to 1.04 | .31 | 1.02 | 0.98 to 1.06 | .25 |
| BMI ≥ 30 kg/m2 | 1.50 | 0.58 to 3.84 | .40 | 1.43 | 0.43 to 4.79 | .56 |
| Charlson comorbidity | 1.07 | 0.52 to 2.20 | .86 | 0.99 | 0.31 to 3.14 | .99 |
NOTE. Boldfaced values represent statistically significant ORs.
Abbreviations: BMI, body mass index; CAPRA-S, Cancer of the Prostate Risk Assessment Post-Surgical scoring system; max, maximum; OR, odds ratio; PSA, prostate-specific antigen.
Table 5.
Predictors of Gleason Upgrading at RP in Men With Extended Biopsy Sampling (≥ 10 cores) in the Contemporary Gleason Era (2004-present): Univariate and Multivariable Logistic Regressions
| Characteristic | Pathologic Upgrading |
|||||
|---|---|---|---|---|---|---|
| Univariate |
Multivariable |
|||||
| OR | 95% CI | P | OR | 95% CI | P | |
| African American race (referent: white or other) | 3.09 | 1.79 to 5.35 | < .01 | 2.26 | 1.07 to 4.78 | .03 |
| PSA | 1.09 | 0.96 to 1.24 | .18 | 1.20 | 0.97 to 1.49 | .10 |
| Prostate weight | 1.00 | 0.99 to 1.01 | .83 | 0.98 | 0.96 to 1.01 | .14 |
| Age | 1.03 | 0.99 to 1.08 | .17 | 1.04 | 0.98 to 1.11 | .23 |
| Family history | 0.81 | 0.47 to 1.41 | .45 | 0.76 | 0.36 to 1.60 | .47 |
| Percentage positive biopsy cores | 1.13 | 1.06 to 1.20 | < .01 | 1.11 | 1.02 to 1.21 | .02 |
| Max percent cancer per core | 1.01 | 0.99 to 1.03 | .38 | 1.01 | 0.98 to 1.03 | .68 |
| BMI ≥ 30 kg/m2 | 1.69 | 0.86 to 3.34 | .13 | 1.55 | 0.68 to 3.50 | .29 |
| Charlson comorbidity | 0.94 | 0.53 to 1.68 | .84 | 1.15 | 0.52 to 2.53 | .74 |
NOTE. Boldfaced values represent statistically significant ORs.
Abbreviations: BMI, body mass index; max, maximum; OR, odds ratio; PSA, prostate-specific antigen; RP, radical prostatectomy.
DISCUSSION
Active surveillance is the preferred treatment option for men with very low–risk prostate cancer and a life expectancy ≤ 20 years.1 However, these recommendations have been made based on retrospective reviews and prospective trials of primarily white men. Our study suggests that broad application of these recommendations may not be suitable for African Americans. Namely, we demonstrate that African Americans meeting NCCN criteria for very low–risk disease were more likely to sustain adverse oncologic outcomes (Gleason upgrading, adverse pathology, positive surgical margins, and biochemical recurrence) than white men or men of other races.
Multiple retrospective studies have shown that prostate cancer may be more aggressive in AA men in terms of incidence, presenting stage and grade, pathologic outcomes, recurrence after treatment, and mortality.6,15–25 The reasons for this are unclear. As summarized in a review by Chornukur et al,26 a component of these outcomes may be social and economic. African Americans with prostate cancer, overall, have lower socioeconomic status and levels of education, are less likely to be insured, and are less likely to undergo radical prostatectomy. Another component may be biologic. Using the SEER cohort and institutional prostatectomy data, Powell et al27 have suggested African Americans harbor faster growing cancers that become high grade more frequently, and that the prevalence of distant metastases in African Americans with prostate cancer is fourfold higher than in white patients.
However, it is not clear whether AA outcomes are worse when selecting only men with favorable disease characteristics at diagnosis.5,7 These data are clinically important because men with favorable-risk disease choosing between definitive treatment or monitoring their disease via active surveillance need to be informed of the risks and expected outcomes of their decisions, especially if those outcomes were to vary significantly by race. In addition, racial disparities in outcomes of very low–risk disease may pose barriers to widespread application of active surveillance in appropriate patients.
Resnick et al7 found no differences in outcomes after surgery (pathologic stage, upgrading, and recurrence) when comparing AA and white patients within a cohort of men with low risk prostate cancer. In that study, which included men from 1991 to 2007, stringent low risk was defined as PSA ≤ 10, clinical stage ≤ T1c, Gleason sum ≤ 6, and positive cores ≤ 2, as adapted from the University of Toronto active surveillance criteria. It is possible that the sample size of AA men (n = 53) was not large enough to detect a difference potentially suggested by higher upgrading at radical prostatectomy in AA men (32% v 24%; P = .19). The rate of upgrading was similar to what very low–risk African Americans experienced at our institution (27.3% to 32.7%) though far higher than what white men experienced (12.6% to 14.4%). This may be related to the selection of our cohort by PSA density ≤ 0.15 ng/mL/cm3 as part of our very low–risk criteria.
Iremashvili et al5 reported that among 24 AA men in the University of Miami active surveillance cohort African Americans were more likely to experience disease progression on surveillance and that AA race was an independent predictor of progression on surveillance after controlling for number of positive biopsy cores, prostate volume, and PSA density. The criteria for active surveillance in this cohort (1994 to 2011) were clinical stage ≤ T2a, Gleason sum ≤ 6, positive cores ≤ 2, and cancer involvement per core ≤ 20%. Though the interpretation of the results is limited by the small sample size and inclusion of patients before the contemporary system Gleason grading, the message is nevertheless worrisome.
The clinical implications of this study are significant. The NCCN has strict criteria for very low–risk prostate cancer and, even when including modern grading and extended biopsy sampling to these stringent criteria, African Americans fared significantly worse. AA race was an independent risk factor for upgrading at prostatectomy, adverse pathology, and higher pathologic risk score (CAPRA-S ≥ 3). Thus, we believe that AA men considering active surveillance (AS) should be counseled that their disease-free outcomes may not parallel currently published oncologic outcomes from large AS cohorts. We also think these data highlight the need to re-examine AS criteria for AA men and to develop race-based risk classifiers.
The main limitation of our study is that it is a retrospective analysis of the experience of a single tertiary center. Though the men studied would be universally eligible for AS based on preoperative risk characteristics, this is not a report of an actual AS program. The median age of analyzed men was 58 years, whereas median age ranges from 61.9 to 70.3 years among patients in large AS cohorts.4 This age difference is a potential confounder and highlights the importance of future studies to prospectively evaluate race-based AS outcomes.
Outcomes were not adjusted for pathologic tumor volume although this has been shown to not have prognostic significance after accounting for pathologic grade and surgical margin status.28 Furthermore, data relevant to socioeconomic variables, frequency of screening, adherence to biopsy and treatment recommendations, and stringency of follow-up, which are all potential confounding factors, were unavailable for analysis. Nonetheless, the proportion of men lost to follow-up did not differ among the groups. Because the cohort is also largely referral-based, the series may be affected by a selection bias. However, this could be advantageous as the very low–risk groups we study may be more homogeneous with race-based outcome differences less prone to confounding factors.
The strengths of our study are that it represents the largest reported cohort (n = 256) of very low–risk African Americans who qualify for active surveillance. The primary results are derived from a cohort of men with extended biopsy sampling (≥ 10 cores) treated within the modern Gleason grading era (2004 to present). Thus, the results are closely applicable to contemporary men diagnosed with prostate cancer.
In conclusion, this study shows a disparity in outcomes for AA men after RP by multiple metrics, even within a highly selected and contemporary cohort of very low–risk patients. This underscores the need to develop and use race-based risk classifiers when counseling patients about different management strategies. The results of our study do not support the universal rejection of active surveillance in AA men, but rather should promote future studies to address whether alternate race-specific surveillance entry criteria should be used for AA men to ensure oncologic parity with their white counterparts. Finally, the disparities in our study highlight the need for a detailed evaluation of AA tumors to uncover potentially distinct molecular phenotypes.
Footnotes
Supported by National Institutes of Health National Institute of Diabetes and Digestive and Kidney Diseases training Grant No. T32DK007552 (D.S.), American Urological Association/Astellas Rising Star Award (E.M.S.), and the Howard Hughes Medical Institute Early Career Physician Scientist Award (E.M.S.).
Authors' disclosures of potential conflicts of interest and author contributions are found at the end of this article.
See accompanying editorial on page 2979. Processed as a Rapid Communication manuscript
AUTHORS' DISCLOSURES OF POTENTIAL CONFLICTS OF INTEREST
The author(s) indicated no potential conflicts of interest.
AUTHOR CONTRIBUTIONS
Conception and design: Debasish Sundi, Ashley E. Ross, H. Ballentine Carter, Edward M. Schaeffer
Collection and assembly of data: Debasish Sundi, Elizabeth B. Humphreys
Data analysis and interpretation: Debasish Sundi, Ashley E. Ross, Misop Han, Alan W. Partin, H. Ballentine Carter, Edward M. Schaeffer
Manuscript writing: All authors
Final approval of manuscript: All authors
REFERENCES
- 1.National Comprehensive Cancer Network. Clinical practice guidelines in oncology: Prostate cancer (version 3) http://www.nccn.org/professionals/physician_gls/pdf/prostate.pdf.
- 2.Conti SL, Dall'era M, Fradet V, et al. Pathological outcomes of candidates for active surveillance of prostate cancer. J Urol. 2009;181:1628–1633. doi: 10.1016/j.juro.2008.11.107. [DOI] [PubMed] [Google Scholar]
- 3.Warlick C, Trock BJ, Landis P, et al. Delayed versus immediate surgical intervention and prostate cancer outcome. J Natl Cancer Inst. 2006;98:355–357. doi: 10.1093/jnci/djj072. [DOI] [PMC free article] [PubMed] [Google Scholar]
- 4.Dall'Era MA, Albertsen PC, Bangma C, et al. Active surveillance for prostate cancer: A systematic review of the literature. Eur Urol. 2012;62:976–983. doi: 10.1016/j.eururo.2012.05.072. [DOI] [PubMed] [Google Scholar]
- 5.Iremashvili V, Soloway MS, Rosenberg DL, et al. Clinical and demographic characteristics associated with prostate cancer progression in patients on active surveillance. Urology. 2012;187:1594–1599. doi: 10.1016/j.juro.2011.12.082. [DOI] [PubMed] [Google Scholar]
- 6.Siegel R, Naishadham D, Jemal A. Cancer statistics, 2012. CA Cancer J Clin. 2012;62:10–29. doi: 10.3322/caac.20138. [DOI] [PubMed] [Google Scholar]
- 7.Resnick MJ, Canter DJ, Guzzo TJ, et al. Does race affect postoperative outcomes in patients with low-risk prostate cancer who undergo radical prostatectomy? Urology. 2009;73:620–623. doi: 10.1016/j.urology.2008.09.035. [DOI] [PubMed] [Google Scholar]
- 8.Epstein JI, Walsh PC, Carmichael M, et al. Pathologic and clinical findings to predict tumor extent of nonpalpable (stage T1c) prostate cancer. JAMA. 1994;271:368–374. [PubMed] [Google Scholar]
- 9.Epstein JI, Allsbrook WC, Amin MB, et al. The 2005 International Society of Urological Pathology (ISUP) Consensus Conference on Gleason Grading of Prostatic Carcinoma. Amer J Surg Pathol. 2005;29:1228–1242. doi: 10.1097/01.pas.0000173646.99337.b1. [DOI] [PubMed] [Google Scholar]
- 10.Epstein JI, Pizov G, Walsh PC. Correlation of pathologic findings with progression after radical retropubic prostatectomy. Cancer. 1993;71:3582–3593. doi: 10.1002/1097-0142(19930601)71:11<3582::aid-cncr2820711120>3.0.co;2-y. [DOI] [PubMed] [Google Scholar]
- 11.Ross AE, Loeb S, Landis P, et al. Prostate-specific antigen kinetics during follow-up are an unreliable trigger for intervention in a prostate cancer surveillance program. J Clin Oncol. 2010;28:2810–2816. doi: 10.1200/JCO.2009.25.7311. [DOI] [PubMed] [Google Scholar]
- 12.Cooperberg MR, Hilton JF, Carroll PR. The CAPRA-S score: A straightforward tool for improved prediction of outcomes after radical prostatectomy. Cancer. 2011;117:5039–5046. doi: 10.1002/cncr.26169. [DOI] [PMC free article] [PubMed] [Google Scholar]
- 13.Amling CL, Riffenburgh RH, Sun L, et al. Pathologic variables and recurrence rates as related to obesity and race in men with prostate cancer undergoing radical prostatectomy. J Clin Oncol. 2004;22:439–445. doi: 10.1200/JCO.2004.03.132. [DOI] [PubMed] [Google Scholar]
- 14.Freedland SJ, Aronson WJ, Kane CJ, et al. Impact of obesity on biochemical control after radical prostatectomy for clinically localized prostate cancer: A report by the Shared Equal Access Regional Cancer Hospital database study group. J Clin Oncol. 2004;22:446–453. doi: 10.1200/JCO.2004.04.181. [DOI] [PubMed] [Google Scholar]
- 15.Moul JW, Connelly RR, Mooneyhan RM, et al. Racial differences in tumor volume and prostate specific antigen among radical prostatectomy patients. J Urol. 1999;162:394–397. [PubMed] [Google Scholar]
- 16.Pettaway CA, Troncoso P, Ramirez EI, Johnston DA, Steelhammer L, Babaian RJ. Prostate specific antigen and pathological features of prostate cancer in black and white patients: A comparative study based on radical prostatectomy specimens. J Urol. 1998;160:437–442. [PubMed] [Google Scholar]
- 17.Moul JW, Sesterhenn IA, Connelly RR, et al. Prostate-specific antigen values at the time of prostate cancer diagnosis in African American men. JAMA. 1995;274:1277–1281. [PubMed] [Google Scholar]
- 18.Swords K, Wallen EM, Pruthi RS. The impact of race on prostate cancer detection and choice of treatment in men undergoing a contemporary extended biopsy approach. Urol Oncol. 2010;28:280–284. doi: 10.1016/j.urolonc.2008.09.021. [DOI] [PubMed] [Google Scholar]
- 19.Bigler SA, Pound CR, Zhou X. A retrospective study on pathologic features and racial disparities in prostate cancer. Prostate Cancer. 2011;2011:239460. doi: 10.1155/2011/239460. [DOI] [PMC free article] [PubMed] [Google Scholar]
- 20.Cullen J, Brassell SA, Chen Y, et al. Racial/ethnic patterns in prostate cancer outcomes in an active surveillance cohort. Prostate Cancer. 2011;2011:234519. doi: 10.1155/2011/234519. [DOI] [PMC free article] [PubMed] [Google Scholar]
- 21.Nielsen ME, Han M, Mangold L, et al. Black race does not independently predict adverse outcome following radical retropubic prostatectomy at a tertiary referral center. J Urology. 2006;176:515–519. doi: 10.1016/j.juro.2006.03.100. [DOI] [PubMed] [Google Scholar]
- 22.Yamoah K, Stone N, Stock R. Impact of race on biochemical disease recurrence after prostate brachytherapy. Cancer. 2011;117:5589–5600. doi: 10.1002/cncr.26183. [DOI] [PubMed] [Google Scholar]
- 23.Hamilton RJ, Aronson WJ, Presti JC, Jr, et al. Race, biochemical disease recurrence, and prostate-specific antigen doubling time after radical prostatectomy: Results from the SEARCH database. Cancer. 2007;110:2202–2209. doi: 10.1002/cncr.23012. [DOI] [PubMed] [Google Scholar]
- 24.Moreira DM, Presti JC, Jr, Aronson WJ, et al. The effect of race on the discriminatory accuracy of models to predict biochemical recurrence after radical prostatectomy: Results from the Shared Equal Access Regional Cancer Hospital and Duke Prostate Center databases. Prostate Cancer Prostatic Dis. 2010;13:87–93. doi: 10.1038/pcan.2009.48. [DOI] [PMC free article] [PubMed] [Google Scholar]
- 25.Ritch CR, Morrison BF, Hruby G, et al. Pathological outcome and biochemical recurrence-free survival after radical prostatectomy in African-American, Afro-Caribbean (Jamaican) and Caucasian-American men: An international comparison. BJU Int. 2013;111(Pt B) suppl 4:E186–E190. doi: 10.1111/j.1464-410X.2012.11540.x. [DOI] [PubMed] [Google Scholar]
- 26.Chornokur G, Dalton K, Borysova ME, et al. Disparities at presentation, diagnosis, treatment, and survival in African American men, affected by prostate cancer. Prostate. 2011;71:985–997. doi: 10.1002/pros.21314. [DOI] [PMC free article] [PubMed] [Google Scholar]
- 27.Powell IJ, Bock CH, Ruterbusch JJ, et al. Evidence supports a faster growth rate and/or earlier transformation to clinically significant prostate cancer in black than in white American men, and influences racial progression and mortality disparity. J Urol. 2010;183:1792–1796. doi: 10.1016/j.juro.2010.01.015. [DOI] [PMC free article] [PubMed] [Google Scholar]
- 28.Epstein JI, Carmichael M, Partin AW, et al. Is tumor volume an independent predictor of progression following radical prostatectomy? A multivariate analysis of 185 clinical stage B adenocarcinomas of the prostate with 5 years of followup. J Urol. 1993;149:1478–1481. doi: 10.1016/s0022-5347(17)36421-2. [DOI] [PubMed] [Google Scholar]