

Abstract
Aim
To validate a [13C]-Spirulina platensis gastric emptying (GE) breath test (GEBT) with a standardized meal.
Methods
38 healthy volunteers and 129 patients with clinically suspected delayed GE underwent measurements at 45, 90, 120, 150, 180, and 240 min after a 238 kcal meal labeled test with 100 mg [13C]-Spirulina platensis, and 0.5 mCi 99mTc. We established normal ranges for scintigraphy with this test meal, intra- and inter-individual coefficients of variation (COV) and the ability of the [13C] GEBT breath kPCD (percent dose excreted *1000) values to predict scintigraphic t½, and to categorize GE as delayed, normal or accelerated.
Results
In health, the 10th and 90th percentile of t½ for scintigraphic GE with this meal are 52 and 86 min; intra-individual COV for scintigraphy and the GEBT were respectively 31% and 27% at 45 min; 17% and 21% at 90 min; 13% and 16% at 120 min; 10% and 13% at 150 min; and 8% and 12% at 180 min. Inter-individual COVs at each time for the [13C] GEBT and scintigraphy were typically ~ 1–4% lower than intra-individual COVs. Individual breath samples at 45, 150 and 180 min predicted GE category: at 80% specificity, 45 and 180 min samples combined were 93% sensitive to identify accelerated GE; 150 and 180 min combined were 89% sensitive for delayed GE.
Conclusions
[13C]-Spirulina platensis GEBT is as reproducible as scintigraphy; imprecision with both tests reflects physiologic variation. Using 4 breath samples, this method with an off-the-shelf meal is valid to assess GE in clinic and in research.
INTRODUCTION
The measurement of gastric emptying (GE) by stable isotope breath tests (GEBT) has practical and safety advantages compared to current scintigraphic methods (1). Unlike scintigraphy, which requires elaborate detection equipment and the patient to be located in the same setting, GEBT can be performed just about anywhere, including any office or bedside because the collected breath samples are stable, and the samples can sent to a remote site for analysis. GEBT is safer than scintigraphy because it involves no radiation exposure, which is advantageous if repetitive assessments of GE are needed for research or clinical purposes, or if assessment of GE is needed in pregnant or breast feeding women, and in children.
In previous studies conducted in our laboratory (2–5), we demonstrated that, as compared to simultaneous scintigraphy, the [13C]-octanoate and [13C]-Spirulina platensis GEBT provided an acceptable assessment of the GE of solids in humans, with acceptable coefficient of variation comparable to scintigraphy. [13C]-Spirulina platensis GEBT was able to identify accelerated or delayed emptying induced pharmacologically with placebo, erythromycin, or atropine. Across the range of GE, the mean difference in t½ between the two methods was 0.15 minutes with standard deviation of 35.5 minutes (6). The meals used in the prior studies were not completely standardized (e.g. egg size and weight may differ), and were not shelf-stable.
In order to facilitate safe, point-of-care assessment of GE, a standardized test meal consisting entirely of shelf-stable components including 100 mg [13C]-Spirulina platensis has been developed (7). In the current prospective, validation study, comparing [13C]-Spirulina platensis GEBT using a standardized, shelf-stable meal with simultaneous scintigraphic GE, our aims were: 1) to establish normal ranges for scintigraphy with this test meal; 2) to appraise the performance characteristics (intra- and inter-individual coefficients of variation (COV) of both scintigraphy and [13C]-Spirulina platensis GEBT) in healthy volunteers; and 3) to assess the ability of the [13C]-Spirulina platensis GEBT breath kPCD (percent dose excreted *1000) values to predict scintigraphic t½, and to categorize GE as delayed, normal or accelerated in patients with symptoms suggestive of abnormal GE.
METHODS
Experimental Design
This prospective, open-label comparison validation study was conducted at the Mayo Clinic’s Clinical Research Unit. All studies were approved by the Mayo Clinic Institutional Review Board.
In the first phase, we performed a calibration study in 38 healthy volunteers to estimate the reference range for scintigraphic results using the standardized, shelf-stable test meal, and to estimate the total variability (imprecision) of scintigraphy and [13C]-Spirulina platensis GEBT measurements on healthy volunteers. Twenty-eight participants underwent studies on two occasions in order to study intra-individual variation.
In the second phase of this study, we validated the [13C]-Spirulina platensis GEBT for use in the diagnosis of delayed GE by studying 124 participants who were referred for scintigraphy for clinically suspected abnormal GE, and in 5 healthy subjects who received atropine (0.01mg/kg iv bolus over 10 minutes, followed by 0.01 mg/kg infusion over 50 minutes) to pharmacologically delay GE.
Eligibility Criteria for Participants
In the first phase, we recruited by public advertisement 38 normal participants, males and females between 18–75 years old. Females of childbearing potential were required to have negative pregnancy urine test within 48 hours of the dual-label GE test. Participants were excluded if they had any history, physical examination, or laboratory finding to suggest systemic diseases, history of abdominal surgery except appendectomy; clinically significant neurological or psychiatric disorders, use of narcotics or anticholinergics agents within two days of the study; or receipt of an investigational drug within 4 weeks prior to the study.
In the second phase of the study, 124 participants were recruited from patients referred for GE by scintigraphy based upon clinical assessment by physicians at the Mayo Gastroenterology Motility Clinic. Participants were males and females, 18 – 75 years old, and had similar inclusion criteria except concomitant general diseases or suspicion of delayed GE were not exclusion criteria, and in addition there could be no history or suspicion of malabsorption due to mucosal disease, pancreatic disease or liver dysfunction. The 5 normal participants, who received atropine in the second phase of the study, were recruited by public advertisement and had the same inclusion/exclusion criteria as the normal participants used in the first phase of the study.
Procedures
For each potential participant, a screening visit was conducted in which consent was obtained and a physical exam was performed. After an overnight fast (minimum 8 hour), the participants returned to the study center at approximately 7:00 a.m. at which time the dual-label GE test was started. The patient consumed the test meal containing [13C]-Spirulina and 99mTc sulfur colloid. Scintigraphic images were obtained upon completion of the meal and at 45, 90, 120, 150, 180, and 240 minutes after the meal. Breath samples were collected at baseline before the test meal was started, and simultaneously with scintigraphic image acquisitions after the ingestion of the test meal.
Test Meal
The test meal consisted of 1mCi 99mTc-sulphur colloid, 100 mg [13C]-Spirulina platensis, 27 g freeze dried egg mix, 6 saltine crackers, and 180 mL of water. The caloric content of the meal is 238 kcal, and the meal has a balanced composition of 16.9 g carbohydrates, 14.4 g protein, and 11.2 g fat. The nature and size of the meal were selected to ensure stability at room temperature, palatability, and calorie content that would be consumed entirely, even by patients with suspected gastroparesis and upper abdominal symptoms.
Substrate for 13CO2 Breath Test ([13C]-Spirulina platensis)
S. platensis is a protein-rich, blue-green algae eaten as a food source in many parts of the world, and is sold as a dietary supplement in the United States (8–10). It contains 50–60% protein, 30% starch, and 10% lipid (11). The natural level of 13C in S. platensis and in all living things is about 1% (12). The S. platensis used in this study was grown in a closed hydroponics chamber charged with pure 13C-source, raising the level of 13C in the resultant cells to 99% (7). Because the contents of the algal cells are not freely diffusible, incorporation of 13C-labeled S. platensis into the egg mix provides a way to assess the emptying of the solid phase of the meal. 13C can only be released from the algal cells after the egg mix is emptied from the stomach, the cells are digested, and the 13C-labeled substrates (algal protein, fat, and carbohydrate) are absorbed and metabolized. In this way, [13C]-S. platensis gives rise to respiratory CO2 that is enriched in 13C.
Measurement of Breath 13CO2 during [13C]-Spirulina platensis GEBT
Breath samples were taken at baseline before the meal and followed the same time schedule as the scintigraphic technique. End-tidal breath samples were collected while the participant’s abdomen was being imaged by the gamma camera. Breath samples were stored in duplicate in glass screwcap Exetainer® tubes (Labco Limited, High Wycombe, U.K.) using a straw to blow into the bottom of the tube to displace contained air. After re-capping the tubes, the 13CO2 breath content was determined in a centralized laboratory (AB Diagnostics, Brentwood, TN) by isotope ratio mass spectrometry. The 13C enrichment was expressed as the delta per mL difference between the 13CO2/12CO2 ratio of the sample and the standard. To calculate the quantity of 13C appearing in breath per unit time, delta over baseline (DOB) was used where: 0.0112372 is the isotopic abundance of the limestone standard, Pee Dee Belemnite, and CO2 production was corrected for age, sex, height and weight using the algorithms of Schofield et al., as described by Klein et al. (13).
Analysis of GEBT and Scintigraphy Data
A. GEBT
The currently preferred GEBT metric is the percent dose (abbreviated PCD) excreted at time t after consumption of the test meal (14). To provide a more convenient scale, we multiply PCD by 1000 to produce kPCD at any time, t.
where:
DOB = The measured difference in the ratio [13CO2/12CO2] between a post-meal breath specimen at any time (t-minutes) and the baseline breath specimen.
CO2PR = CO2 Production Rate (mmol CO2/min) calculated using Schofield equations (15) which incorporate the patient’s age, gender, height and weight.
Rs = The ratio [13CO2/12CO2] in the reference standard (Pee Dee belemnite) for these measurements, Rs = 0.0112372
13 = the atomic weight of Carbon-13
10 = A constant factor for converting units
dose = the weight (mg) of Carbon-13 in the dose of [13C]-S. platensis administered to the patient in the test meal. Since [13C]-Spirulina platensis is approximately 43% Carbon-13, a dose of 100mg [13C]-Spirulina platensis corresponds to approximately 43 mg of Carbon-13.
B. Scintigraphy
A region of interest (ROI) was drawn around the stomach on the anterior and posterior images for each time frame. Data were corrected for decay of 99mTc. To correct for depth or tissue attenuation, the counts of each anterior and posterior ROI were multiplied together and the square root of the product was taken to obtain the geometric mean. The scintigraphic GE metric, Propt, is the proportion of tracer emptied from the stomach at time, t. Using a power exponential model, these data were also used to calculate the GE t½ after estimating the constants κ and β in the power exponential model, Propt = exp(−κtβ ).
C. Statistical Methods
Data from the first phase of this study were summarized separately for initial and repeat studies over all subjects. Repeat studies in 28 of the 38 subjects were used to compute intra-individual coefficients of variation (COV) at each scan/breath sample time point (100*SD of the deltas/overall grand mean). The individual proportions (Propt) and the calculated t½ values obtained from the scintigraphic data of the first study in all 38 normal volunteers were summarized. In particular, the 10th and 90th percentiles for these data were used to define cutoffs indicating “delayed GE” (e.g. t½ > 90th percentile), “accelerated GE” (e.g. t½ < 10th percentile), with the remainder considered as “normal GE” (e.g. between 10th and 90th percentiles). We selected 10th and 90th percentiles rather than the customary normal range of 5th to 95th percentiles because this is more likely to be representative of a normal range based on n=38. These cutoffs were then used to categorize subjects into the corresponding three groups using the scintigraphically derived t½ values for subjects from the second phase of the study.
The joint association between scintigraphic GE proportions at 45, 90, 120, 150, and 180 minutes and the breath test kPCD values at the same time points was assessed using a canonical correlation analysis which essentially tests simultaneously the 5 × 5 correlation matrix between the two sets (proportions of GE and kPCD values at each of 5 time points) of variables. This procedure generates up to 5 “canonical variates” which are linear combinations of the scintigraphic and breath test variables, the first canonical variate for each set chosen to reflect the maximal (linear) correlation among all possible linear combinations of each set of initial variables. The first canonical variate for each of the two sets was plotted to illustrate the correlation between the two sets of variables.
In view of the results available from the canonical correlation analysis, multiple linear regression models to predict the individual scintigraphic GE proportions at each time point using the set of five kPCD values were developed. These models incorporated gender and BMI as covariates. From the predicted GE proportions, a breath test estimate of the corresponding t½ value could be computed using a simple linear interpolation algorithm ( i.e. linearly interpolate between the predicted GE proportions around 0.5, that is for emptying of 50% of the meal, to correspond with the t½). The concordance between the scintigraphic t ½ values and the breath test estimated t½ values was then estimated (16) and a Bland –Altman plot generated in order to determine whether this would be a useful method to estimate gastric emptying t½ values for use in clinical practice or research.
The ability of the breath test kPCD values to predict scintigraphic t½ values was also assessed using a logistic regression model (with the three group category, delayed, accelerated, and normal, as the dependent variable) and the breath test kPCD values as predictors. This approach provides a diagnostic method useful in clinical practice. A backward elimination approach was used to identify the best subset of kPCD values to predict the t½ category of each subject. The predicted probabilities (for delayed vs. normal and for accelerated vs. normal) for each subject were then used as the “marker values” to generate receiver operating characteristic (ROC) curves. The ROC curves and corresponding area under curve (AUC) statistics were obtained for the best subset model as well as for some single breath test models and some models based on two breath test time points. The SAS software package was used for all statistical analyses (17).
A priori Study Power and Sample Size Proposed
The study was designed to provide adequate power to test the sensitivity and specificity of the breath test kPCD values to identify delayed GE separately at each of several a priori chosen time points in a representative sample of patients presenting with upper gastrointestinal symptoms that may be attributable to abnormal GE.
To test whether a specific cutoff in breath test kPCD values at any particular time point had a sensitivity of 0.95 (null hypothesis) versus the alternative hypothesis that the sensitivity was less than 0.85, a sample size of 45 subjects with delayed GE [by scintigraphic methods (gold standard)] would be needed for 80% power (1-sided alpha level of 0.025). Historical data at the Mayo Clinic Rochester Motility Clinic indicate that approximately 35% of adults examined by gastric scintigraphy have delayed GE. This implied 45/0.35 (roughly 128) total subjects would be needed. Similarly, if the subjects were characterized based on a composite of the scintigraphic proportions emptied (e.g. a GE t½ value) as delayed vs. normal vs. accelerated, then a sample of 45 with delayed t½ values would be needed to test the sensitivity of a composite breath test score cutoff (e.g., a sensitivity of 0.95 vs. less than 0.85 for delayed vs. normal t½ values). Alternatively, to develop a logistic regression model with 5 predictor variables (i.e. the kPCD values at 5 time points) to discriminate between delayed and normal GE would require about 50 subjects in the smaller of the two groups (delayed versus normal GE).
RESULTS
Characterization of Patients with Suspected Gastric Emptying Delay
The demographics of the participants in both the calibration phase (health) and the validation phase (patients) of the study, as well as the referral diagnosis for GE assessment are shown in Tables IA and IB.
Normal Data and Replicate Studies in Healthy Individuals
Table II shows the data from 38 healthy volunteers (27 females, 11 males), and the 10th and 90th percentiles for the GE t½ for this meal as measured by scintigraphy in healthy volunteers were 52 and 86 minutes, respectively. Replicate data were acquired on two occasions in 22 female and 6 male healthy volunteers. The intra-individual coefficient of variation (SD of deltas/overall mean) is 26% for the scintigraphic GE t½ values, with a 95% CI for the mean delta of −7 minutes to 8 minutes. The (linear) concordance coefficient for the pairs of t½ values was 0.50. Intra-individual COV for scintigraphy and the [13C]-Spirulina platensis GEBT were respectively 31% and 27% at 45 minutes; 17% and 21% at 90 minutes; 13% and 16% at 120 minutes; 10% and 13% at 150 minutes; and 8% and 12% at 180 minutes. Inter-individual COV for scintigraphy and the GEBT were 26.7% and 21.3% at 45 minutes; 16.2% and 18.9% at 90 minutes; 12.1% and 15.7% at 120 minutes; 9.3% and 13.9% at 150 minutes; and 6.0% and 11.8% at 180 minutes.
Table II.
Gastric emptying characteristics at different time points in 38 healthy volunteers in first phase of study. Data show proportion emptied (GE) at specified times.
| Mean | SD | 10th percentile | 90th percentile | |
|---|---|---|---|---|
| Age, yr | 31.75 | 14.70 | 18.46 | 54.56 |
| BMI, Kg/m2 | 24.53 | 4.154 | 19.94 | 31.99 |
| T ½, min | 67.79 | 15.11 | 52.43 | 85.75 |
| GE 45 min | 0.336 | 0.090 | 0.205 | 0.441 |
| GE 90 min | 0.648 | 0.105 | 0.528 | 0.778 |
| GE 120 min | 0.800 | 0.097 | 0.695 | 0.934 |
| GE 150 min | 0.890 | 0.083 | 0.780 | 0.993 |
| GE 180 min | 0.948 | 0.057 | 0.870 | 1.000 |
| GE 240 min | 0.991 | 0.020 | 0.967 | 1.000 |
Gastric Emptying in Patients
Figure 1A shows a summary of the gastric emptying results by t½ group in the 129 subjects with clinically suspected delayed gastric emptying. The data for each point are provided in detail in Table A (on-line version of manuscript). Note that 55/129 (42.6%) had delayed and 14/129 (11%) had accelerated gastric emptying. Figure 1B shows examples of plots of observed gastric emptying (proportions remaining in the stomach) and predicted proportions (based on equations in the text) using the breath test kPCD values shown (along with BMI and gender). The breath test-estimated t½ values are then computed by linear interpolation of the predicted proportions just above and below 0.5.
Figure 1.

A. Summary of gastric emptying results by t1/2 group in 129 subjects with clinically suspected delayed gastric emptying. Data show mean ± SD. B. This figure illustrates 13CO2 enrichment of breath excreted over 3 hours (right Y-axis κPCD × 10−2), as well as the observed proportion emptied by the stomach by scintigraphy (left Y-axis) and the predicted gastric emptying based on the mathematical formulae and the 13CO2 excretion measured.
Correlations between the Scintigraphic and Breath Test Results
Table III demonstrates the excellent correlations at individual time points for the GE parameters by scintigraphy and the corresponding time kPCD values by breath test. These data essentially establish the strong association between scintigraphic GE proportions and [13C]-Spirulina platensis GEBT breath kPCD values and support the rationale for developing a simple analysis of the breath test for its application in practice. The canonical correlation analysis indicated three significant pairs of canonical variates, and the first pair is plotted in Figure 2. These canonical variates are (weighted) linear combinations of the GE proportions and breath test kPCD values, respectively. They are thus related to other specific functions of the GE proportions. Specifically, the first canonical variate for the GE proportions (Y-axis in Figure 2) has a strong (negative) relationship with the scintigraphically based t½ values (Spearman correlation of −0.82, p<0.001). The first canonical variate of the kPCD values (X-axis in Figure 2) was also strongly related to these t½ values (Spearman correlation of −0.73, p<0.001). Since slower GE corresponds to larger t½ values, the correlation of these canonical variates with t½ values is negative, reflecting the propensity of the slower GE subjects in the lower left quadrant and the faster GE subjects in the upper right quadrant.
Table III. Correlations between proportion emptied from the stomach and kPCD by [13C]-Spirulina platensis GEBT at a priori chosen time points in all participants.
All correlations are p <0.001 except for the correlation between GE 45 and BT 180, which was 0.004. Note that, in general, the largest correlation coefficients for gastric emptying scintigraphy and breath test occur at the times when sampling occurred (e.g. 45, 90, 120 minutes). However, later in the study (150 and 180 minutes) the correlations are not necessarily matched for time. The canonical correlation analysis essentially jointly tests whether the correlations in the matrix below are simultaneously zero.
| Pearson Correlation Coefficients, n=129 | |||||
|---|---|---|---|---|---|
| BT45 | BT90 | BT120 | BT150 | BT180 | |
| GE45 | 0.62836 | 0.54218 | 0.48258 | 0.36726 | 0.25435 |
| GE90 | 0.74121 | 0.81413 | 0.78199 | 0.67323 | 0.52818 |
| GE120 | 0.73700 | 0.81807 | 0.83310 | 0.76650 | 0.64339 |
| GE150 | 0.71635 | 0.79103 | 0.83605 | 0.82450 | 0.73545 |
| GE180 | 0.68297 | 0.72519 | 0.78433 | 0.80173 | 0.77191 |
BT = breath test kPCD; GE = proportion of gastric emptying at specified times
Figure 2.

Plot of the first canonical variates (linear combinations with maximal correlation) with scintigraphic variate on the Y-axis and the [13C]-Spirulina platensis GEBT breath kPCD variate on the X-axis. Specifically, the first canonical variate for the GE proportions (Y-axis in figure) has a strong (negative) relationship with the scintigraphically based t ½ values (Spearman correlation of −0.82, p<0.001). The first canonical variate of the kPCD values (X-axis in figure) was also strongly related to these t ½ values (Spearman correlation of −0.73, p<0.001). Since more delayed GE corresponds to larger t ½ values, the correlation of these canonical variates with t ½ values is negative, reflecting the propensity of the more delayed GE subjects in the lower left quadrant and the more accelerated GE subjects in the upper right quadrant.
The results of the multiple linear regression models (incorporating gender and BMI as covariates) provided predicted values for the GE proportions at 45, 90, 120, 150, 180 and 240 minutes. The predicted GE proportions are given by the equations in Table B (on-line version of the manuscript).
Using the predicted GE proportions from the breath test measurements for each subject, a gastric emptying t½ value was computed for each subject (linear interpolation). The observed t½ values obtained in each individual by scintigraphy are plotted against the breath test estimated t½ values in Figure 3, the concordance was 0.86. The corresponding Bland-Altman plot is shown in Figure 4. Although the individual differences (scintigraphic t½ vs. breath test t½) varied from −53 to +75 minutes, the mean difference was less than 2 minutes. More generally, the mean values of the t½ values by breath test and by scintigraphy over any random sample subset of 25 of the 129 patients were very similar. Specifically, the difference in means (mean scintigraphic t½ minus mean breath test estimated t ½) ranged from −16 to +5 minutes over 500 replications (i.e., random sample of size n=25 of the 129 subjects studied was repeated 500 times).
Figure 3.
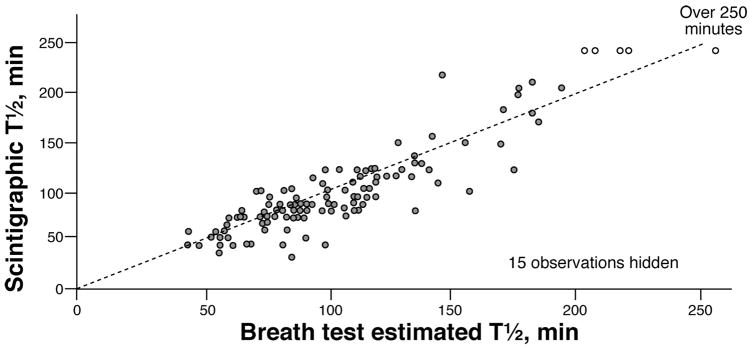
Scatterplot of the scintigraphic measured gastric emptying t ½ values (Y-axis) versus the breath test estimated t ½ values (X-axis) obtained from linear interpolation of breath test predicted GE proportions. The dotted line shows X=Y.
Figure 4.

Bland-Altman plot of the differences between scintigraphic measured t ½ values and breath test estimated t ½ values (Y-axis) versus the average of the two t ½ values (X-axis) in each subject. Note that subjects with t ½ values greater than 240 minutes by scintigraphy are not used.
Based on the normal value study, the 10th and 90th percentiles of GE t½ using scintigraphy were used to classify patients into “delayed” (t½ >86 min), “accelerated” (t½ <52 min) or “normal” (t½ 52–86 minutes) GE. There were 55 patients with delayed GE, 14 with accelerated GE, and 60 patients with normal GE.
The groups (delayed, accelerated and normal) were then used as the dependent variable in a polychotomous logistic regression analysis using the breath test kPCD values to estimate the odds for delayed versus normal, and accelerated versus normal. In the logistic regression model including all participants, breath test samples at 45 minutes (χ2=15.3, p<0.001), 150 minutes (χ2=17.0, p<0.001), and 180 minutes (χ2=11.6, p=0.003) provided the best prediction of the three GE groups: delayed versus normal and accelerated versus normal. From this model, the odds for breath kPCD to identify delayed or accelerated GE were estimated. Thus, larger kPCD values by the breath test at 45 minutes increased the odds for accelerated GE (versus normal), with an odds ratio of 1.38 (95% confidence intervals [CI] of 1.16, 1.64); a smaller kPCD value from the breath test at 150 minutes decreased the odds for delayed GE (versus normal), with an odds ratio of 0.72 (95% CI 0.62, 0.84); a larger kPCD values from the breath test at 180 minutes increased the odds for delayed GE (versus normal), with an odds ratio of 1.25 (95% confidence intervals [CI] of 1.08, 1.45).
Performance Characteristics of the [13C]-Spirulina platensis GEBT Relative to Scintigraphy
Figures 5 and 6 show the ROC curves for individual and combined breath samples and their sensitivity and specificity in the identification of delayed and accelerated GE respectively. Using a model with [13C]-Spirulina platensis breath kPCD values at just two time points, 150 and 180 minutes, the specificity is 80% and the sensitivity is 89% to identify delayed GE with an AUC of 0.893. The predicted probability cutoff for this combination of sensitivity and specificity was 0.400 where the predicted probabilities (PP) are computed from the estimated coefficients in the logistic regression model as:
Figure 5.

ROC curve for the detection of delayed gastric emptying with [13C]-Spirulina platensis GEBT measurements relative to the scintigraphic measurement of gastric emptying. Note that the performance characteristics are uniformly excellent even with a single breath sample at 150 minutes, but the sensitivity reaches 89% at 80% specificity when the 180 minute sample is also included. The AUC for the combined 150 and 180 minute samples was 0.893. Note also that the 45 minute sample adds little to the accuracy of determination of the GEBT for categorizing delayed GE above the accuracy of the combined 150 and 180 minute breath samples. Combining the three time points (45, 150 and 180 minutes) resulted in an AUC of 0.890.
Figure 6.

ROC curve for the detection of accelerated gastric emptying with breath test measurements relative to the scintigraphic measurement of gastric emptying. Note the proportion emptied at 45 minutes provides fair sensitivity and specificity and the best performance is with all three breath samples. However, the 45 minute breath sample in combination with the 180 minute sample yielded a sensitivity of 93% at 80% specificity. The AUC for the combined 45 and 180 minute samples was 0.895. Combining the three time points (45, 150 and 180 minutes) resulted in an AUC of 0.902
Using two different time points, at 45 and 180 minutes, yielded an AUC=0.895 with 80% specificity and 93% sensitivity for identifying accelerated GE at the predicted probability cutoff of 0.0918. The predicted probabilities for accelerated GE are computed as:
Combining the three time points (45, 150 and 180 minutes) resulted in an AUC of 0.890 and 0.902 with sensitivities of 89% and 86% for diagnosing delayed and accelerated GE, respectively, at 80% specificity. The corresponding predicted probability cutoff values were 0.4172 and 0.1199, respectively. The predicted probabilities (PPDelayed, PPAccelerated) for the three time point model are computed as:
DISCUSSION
The main goals of this study were to develop and operationalize a standardized, shelf-stable breath test meal labeled with [13C]-Spirulina platensis for the measurement of GE of solids in a clinical practice setting and to develop the range of normal GE, and a practical approach to measure and report GE results. The study confirms the previous observations obtained with a whole, fresh egg meal in our prior studies (2–6). Moreover this study shows excellent concordance between breath excretion of 13CO2 and the proportion of isotope-labeled meal emptied from the stomach at specified time points that were selected based on previous experience. These times are 45, 90, 120, 150, 180 and 240 minutes. With the lower calorie content and lower solid and non-digestible fiber content of the current test meal, the study shows that the vast majority of symptomatic individuals actually emptied the meal from the stomach in the first three hours and hence the 240 minute observations were non-contributory. The same strategy followed in our prior studies also showed that determining the [13C]-Spirulina platensis GEBT breath kPCD values at just three time points ( 45, 150 and 180 minutes) provided the strongest degree of concordance between the [13C]-Spirulina platensis GEBT and GE by scintigraphy for identifying accelerated and delayed GE. These analyses also show that it is possible to obtain not only an assessment of accelerated vs normal vs delay, using the breath test, but also a very valid estimate of the GE t ½, which many clinicians are accustomed to using in making clinical decisions, and for clinical research, as in pharmacodynamic studies. This is supported by the observation that the difference in means ranged from −16 to +5 minutes.
A strength of this study is that the [13C]-Spirulina platensis GEBT was validated in a prospective manner among subjects at a single center considered for referral to GE scintigraphy. The use of this product was not associated with any adverse event. The subjects who participated in the study had a wide variety of underlying pathologies including functional dyspepsia, diabetes, prior fundoplication and connective tissue disorders. We excluded malabsorption by clinical history and significant liver disease by review of the medical records. The exclusion of subjects with clinically apparent malabsorption or liver disease in this study does not represent a significant limitation to the use of the [13C]-Spirulina platensis GEBT in clinical practice because such conditions rarely present with symptoms that suggest abnormal GE. Thus, assessment of GE in patients with these conditions is only rarely indicated.
The shelf-life of the [13C]-Spirulina platensis GEBT test meal is sufficient to add convenience and avoid wasting of food. The use of a centralized lab or bench top instrument for measurement of breath excretion of 13CO2 as well as the lack of any radiation exposure add to the attraction of the test permitting its use in all categories of patients including children and women of childbearing potential (18). Use of this test would also be reasonable in the primary care setting to screen diabetics for gastroparesis who are being considered for amylin or glucagon-like peptide-1 based therapies (19–23) whose mechanism of action includes delaying the emptying of solids from the stomach. The method also lends itself for use in studies in the field including epidemiological research.
Based on the results of this study and the unique advantages of simplicity and safety compared to scintigraphy, [13C]-Spirulina platensis GEBT could become the initial test of choice in clinical and research settings for evaluating patients with suspected delay in GE. This method also provides versatility in that it could be incorporated in more mechanistic studies that involve other measurements such as simultaneous measurement of antropyloroduodenal motility by intraluminal probes or combined emptying and accommodation responses using 3-dimensional ultrasound, MRI or single photon emission computed tomography.
There are two potential disadvantages with this method. First, if the stable isotope-containing meal is not entirely consumed, the normal values may not necessarily apply. However, this criticism applies to all methods where a reference or normal range is used (e.g., scintigraphy, ultrasonography) to determine normal gastric emptying. Second, the small size of the meal may not “stress” the system and may not be representative of a typical meal ingested by such patients. There is an inevitable trade-off between feasibility, completion of the test, and comparability with the type of meal that might be intolerable or induce patient’s customary symptoms. This criticism also applies to the “egg-beaters” meal which has been accepted by consensus of the American Neurogastroenterology and Motility Society and the Society of Nuclear Medicine (24).
In summary, our data show that the stable isotope technology developed in earlier studies is applicable with a meal consisting of components with a long shelf-life. The [13C]-Spirulina platensis GE breath test has high reproducibility, external validity and excellent performance characteristics. Imprecision with both stable isotope and scintigraphy reflects physiologic variation. Using only three breath samples, this shelf-stable [13C]-labeled standard meal is valid to determine accelerated or delayed GE. We perceive it is applicable in clinical practice and research, and its advantages include point of service feasibility, safety and accuracy. The mathematical models proposed also provide estimates that address the quantitative results so that they can be used to determine whether gastric emptying is normal, accelerated or delayed, as would be desirable in clinical practice or epidemiological studies, or more specifically identifies the GE t½, which would be applicable to clinical research studies.
Table I.
| Table Ia. Subjects in calibration study (phase 1) to establish reference range in health | ||
|---|---|---|
| Males | Females | |
| Number | 11 | 27 |
| Median age (years and IQR) | 21 (19, 21.9) | 37 (20.8, 45.5) |
| Median body mass index (kg/m2 and IQR) | 26 (24.1, 27.2) | 23 (21.0, 26.9) |
| Table 1b. Subjects in prospective validation study (phase 2: 124 patients, 5 healthy subjects): demographics and diagnosis | ||
| Males | Females | |
| Number | 36 | 93 |
| Median age (years and IQR) | 49.7 (34.5, 61.0) | 49.9 (37.3, 61.3) |
| Median body mass index (kg/m2 and IQR) | 28.3 (24.6, 30.7) | 26.8 (22.2, 29.8) |
| Functional Dyspepsia | 11 | 42 |
| Gastroparesis (non-diabetic) | 4 | 4 |
| Diabetes | 5 | 6 |
| Connective tissue disorders | 0 | 2 |
| Other motility disorders | 4 | 4 |
| Gastroesophageal reflux disease | 6 | 5 |
| Status-post fundoplication | 3 | 2 |
| Idiopathic Nausea | 2 | 20 |
| Other | 1 | 3 |
| Healthy (received atropine) | 0 | 5 |
Acknowledgments
This study was supported by a research grant from AB Diagnostics, Brentwood, TN. Dr. Camilleri is supported by a K24 grant DK02638 and RO1 DK 67071 from National Institutes of Health. The studies were conducted in the Mayo Clinic Clinical Research Unit which is supported by grant RR024150 from National Institutes of Health.
Abbreviations
- BT
Breath test
- [13C]
13-carbon
- COV
coefficient of variation
- DOB
delta over baseline
- GE
gastric emptying
- GEBT
gastric emptying breath test
- PCD
percent dose
- kPCD
percent dose multiplied by 1000
- ROI
region of interest
- [99mTc]
99m- technetium
APPENDIX
TABLES FOR ON-LINE VERSION OF THE MANUSCRIPT ONLY.
Table A.
Summary of Gastric Emptying Results by t1/2 Group in 129 Subjects with Clinically Suspected Delayed Gastric Emptying (n=number)
| Group | Proportion emptied at time point | Mean | SD |
|---|---|---|---|
|
| |||
| Normal t ½: 52–86 min n=60 | GE45 | 0.31 | 0.06 |
| GE90 | 0.60 | 0.09 | |
| GE120 | 0.75 | 0.08 | |
| GE150 | 0.86 | 0.07 | |
| GE180 | 0.94 | 0.05 | |
|
| |||
| Accelerated t ½: <52 min n=14 | GE45 | 0.54 | 0.07 |
| GE90 | 0.79 | 0.07 | |
| GE120 | 0.88 | 0.07 | |
| GE150 | 0.94 | 0.05 | |
| GE180 | 0.98 | 0.02 | |
|
| |||
| Delayed t ½: >86 min n=55 | GE45 | 0.18 | 0.08 |
| GE90 | 0.33 | 0.13 | |
| GE120 | 0.45 | 0.16 | |
| GE150 | 0.57 | 0.19 | |
| GE180 | 0.68 | 0.21 | |
Table B.
Predicted Gastric Emptying Proportions at Different Time Points Based on Gender, BMI, and 13CO2 Excretion at Specified Times
| GE45 = −0.00089 − 0.02941*Female + 0.00471*BMI + 0.01240*BT45 + 0.00158*BT90−0.00006*BT120 + 0.00023*BT150 − 0.00248*BT180 |
| GE90 = 0.01612 − 0.02309*Female + 0.00475*BMI + 0.00346*BT45 + 0.00650*BT90 + 0.00694*BT120 − 0.00033*BT150 − 0.00384*BT180 |
| GE120= 0.03945 − 0.04090*Female + 0.00559*BMI + 0.00429*BT45 − 0.00167*BT90 + 0.01138*BT120 + 0.00319*BT150 − 0.00371*BT180 |
| GE150= 0.07400 − 0.03407*Female + 0.00605*BMI + 0.00651*BT45 − 0.00449*BT90 + + 0.00499*BT120 + 0.01062*BT150 − 0.00313*BT180 |
| GE180= 0.12177 − 0.03421*Female + 0.00598*BMI + 0.00776*BT45 − 0.00564*BT90 + 0.00561*BT120 + 0.00232*BT150 + 0.00539*BT180 |
| GE240= 0.37208 − 0.00923*Female + 0.00400*BMI + 0.00439*BT45 − 0.00433*BT90 + 0.00562*BT120 − 0.00392*BT150 + 0.00912*BT180 |
Footnotes
No conflicts of interest exist for all of the authors.
Publisher's Disclaimer: This is a PDF file of an unedited manuscript that has been accepted for publication. As a service to our customers we are providing this early version of the manuscript. The manuscript will undergo copyediting, typesetting, and review of the resulting proof before it is published in its final citable form. Please note that during the production process errors may be discovered which could affect the content, and all legal disclaimers that apply to the journal pertain.
References
- 1.Ghoos YF, Maes BD, Geypens BJ, Mys G, Hiele MI, Rutgeerts PJ, Vantrappen G. Measurement of gastric emptying rate of solids by means of a carbon-labeled octanoic acid breath test. Gastroenterology. 1993;104:1640–1647. doi: 10.1016/0016-5085(93)90640-x. [DOI] [PubMed] [Google Scholar]
- 2.Choi M-G, Camilleri M, Burton DD, Zinsmeister AR, Forstrom LA, Nair KS. 13C-octanoic acid breath test for gastric emptying of solids: accuracy, reproducibility and comparison with scintigraphy. Gastroenterology. 1997;112:1155–1162. doi: 10.1016/s0016-5085(97)70126-4. [DOI] [PubMed] [Google Scholar]
- 3.Choi M-G, Camilleri M, Burton DD, Zinsmeister AR, Forstrom LA, Nair KS. Reproducibility and simplification of 13C-octanoic acid breath test for gastric emptying of solids. Am J Gastroenterol. 1998;93:92–98. doi: 10.1111/j.1572-0241.1998.092_c.x. [DOI] [PubMed] [Google Scholar]
- 4.Lee JS, Camilleri M, Zinsmeister AR, Burton DD, Kost LJ, Klein PD. A valid, accurate, office based non-radioactive test for gastric emptying of solids. Gut. 2000;46:768–773. doi: 10.1136/gut.46.6.768. [DOI] [PMC free article] [PubMed] [Google Scholar]
- 5.Lee J-S, Camilleri M, Zinsmeister AR, Burton DD, Choi M-G, Nair KS, Verlinden M. Toward office-based measurement of gastric emptying in symptomatic diabetics using [13C]octanoic acid breath test. Am J Gastroenterol. 2000;95:2751–2761. doi: 10.1111/j.1572-0241.2000.03183.x. [DOI] [PubMed] [Google Scholar]
- 6.Viramontes BE, Kim D-Y, Camilleri M, Lee JS, Stephens D, Burton DD, Thomforde GM, Klein PD, Zinsmeister AR. Validation of a stable isotope gastric emptying test for normal, accelerated or delayed gastric emptying. Neurogastroenterol Motil. 2001;13:567–574. doi: 10.1046/j.1365-2982.2001.00288.x. [DOI] [PubMed] [Google Scholar]
- 7.[13C]-Spirulina platensis Gastric Emptying Breath Test (GEBT) - Investigator Brochure. Advanced Breath Diagnostics, LLC. Brentwood, TN, 2005
- 8.Ciferri O. Spirulina, the edible microorganism. Microbiol Rev. 1983;47:551–578. doi: 10.1128/mr.47.4.551-578.1983. [DOI] [PMC free article] [PubMed] [Google Scholar]
- 9.FDA Talk Paper. “Spirulina”. June 23, 1981
- 10.Ciferri O, Tiboni O. The biochemistry and industrial potential of Spirulina. Ann Rev Microbiol. 1985;39:503–526. doi: 10.1146/annurev.mi.39.100185.002443. [DOI] [PubMed] [Google Scholar]
- 11.Dillon JC, Phuc AP, Dubacq JP. Nutritional value of the alga Spirulina. World Rev Nutr Dietetics. 1995;77:32–46. doi: 10.1159/000424464. [DOI] [PubMed] [Google Scholar]
- 12.Ricci E. Determination of carbon-12, carbon-13 isotopic abundances and nitrogen-carbon ratios in biological substances by proton-reaction analysis. Analyt Chem. 1971;43:1866–1871. doi: 10.1021/ac60307a024. [DOI] [PubMed] [Google Scholar]
- 13.Klein PD. Clinical applications of 13CO2 measurements. Federation Proceedings. 1982;41:2698–2701. [PubMed] [Google Scholar]
- 14.Schoeller DA, Schneider JF, Solomons NW, Watkins JB, Klein PD. Clinical diagnosis with the stable isotope 13C in CO2 breath tests: methodology and fundamental considerations. J Lab Clin Med. 1977;90:412–421. [PubMed] [Google Scholar]
- 15.Schofield WN. Predicting basal metabolic rate, new standards and review of previous work. Hum Nutr Clin Nutr. 1985;39:541–549. [PubMed] [Google Scholar]
- 16.Carrasco JL, Jover L. Estimating the generalized concordance correlation coefficient through variance components. Biometrics. 2003;59:849–858. doi: 10.1111/j.0006-341x.2003.00099.x. [DOI] [PubMed] [Google Scholar]
- 17.SAS Institute Inc. SAS/STAT Users Guide, Version 6. 4. Vol. 2. Cary, NC: SAS Institute; 1989. pp. 1135–1194. [Google Scholar]
- 18.Klein PD, Malaty HM, Czinn SJ, Emmons SC, Martin F, Graham DY. Normalizing results of 13C-urea breath testing for CO2 production rates in children. J Pediatr Gastroenterol Nutr. 1999;29:297–301. doi: 10.1097/00005176-199909000-00011. [DOI] [PubMed] [Google Scholar]
- 19.Engelgau MM, Geiss LS, Saaddine JB, Boyle JP, Benjamin SM, Gregg EW, Tierney EF, Rios-Burrows N, Mokdad AH, Ford ES, Imperatore G, Narayan KM. The evolving diabetes burden in the United States. Ann Intern Med. 2004;140:945–950. doi: 10.7326/0003-4819-140-11-200406010-00035. [DOI] [PubMed] [Google Scholar]
- 20.Koch KL. Diabetic gastropathy: gastric neuromuscular dysfunction in diabetes mellitus: a review of symptoms, pathophysiology, and treatment. Dig Dis Sci. 1999;44:1061–1075. doi: 10.1023/a:1026647417465. [DOI] [PubMed] [Google Scholar]
- 21.Rayner CK, Samsom M, Jones KL, Horowitz M. Relationships of upper gastrointestinal motor and sensory function with glycemic control. Diabetes Care. 2001;24:371–381. doi: 10.2337/diacare.24.2.371. [DOI] [PubMed] [Google Scholar]
- 22.Schmitz O, Brock B, Rungby J. Amylin agonists: a novel approach in the treatment of diabetes. Diabetes. 2004;53:S233–238. doi: 10.2337/diabetes.53.suppl_3.s233. [DOI] [PubMed] [Google Scholar]
- 23.Drucker DJ. Minireview: the glucagon-like peptides. Endocrinology. 2001;142:521–527. doi: 10.1210/endo.142.2.7983. [DOI] [PubMed] [Google Scholar]
- 24.Abell TL, Camilleri M, Donohoe K, Hasler WL, Lin HC, McCallum RW, Nowak T, Nusynowitz ML, Parkman HP, Shreve P, Szarka LA, Snape WJ, Jr, Ziessman HA. Consensus recommendations for gastric emptying scintigraphy. A Joint Report of the Society of Nuclear Medicine and the American Neurogastroenterology and Motility Society. Am J Gastroenterology. doi: 10.2967/jnmt.107.048116. in press and J Nucl Med Technol (in press) [DOI] [PubMed] [Google Scholar]