

Abstract
Hyperpolarized 13C offers high signal-to-noise ratios for imaging metabolic activity in vivo, but care must be taken when designing pulse sequences because the magnetization cannot be recovered once it has decayed. It has a short lifetime, on the order of minutes, and gets used up by each RF excitation. In this paper, we present a new dynamic chemical-shift imaging method that uses specialized RF pulses designed to maintain most of the hyperpolarized substrate while providing adequate SNR for the metabolic products. These are multiband, variable flip angle, spectral-spatial RF pulses that use spectral selectivity to minimally excite the injected prepolarized 13C-pyruvate substrate. The metabolic products of lactate and alanine are excited with a larger flip angle to increase SNR. This excitation was followed by an RF amplitude insensitive double spin-echo and an echo-planar flyback spectral-spatial readout gradient. In vivo results in rats and mice are presented showing improvements over constant flip angle RF pulses. The metabolic products are observable for a longer window because the low pyruvate flip angle preserves magnetization, allowing for improved observation of spatially varying metabolic reactions.
Keywords: Spectral-spatial RF pulses, multiband RF pulses, hyperpolarization, dynamic MRSI, metabolic imaging
1 Introduction
The use of hyperpolarized contrast agents for in vivo MR imaging and spectroscopy has been made possible by the recent development for maintaining dynamic nuclear polarization (DNP) in solution [1–13]. For 13C agents, this provides a SNR increase of 10,000 over the thermal equilibrium values. Injection of these agents into rats, pigs, dogs, and mice has yielded good results in both imaging and spectroscopy [1,2,4–11]. Furthermore, there is virtually no 13C background signal, so all the signal is a result of the injected agent. Hyperpolarized 13C pyruvate has been used because the metabolic products of alanine, lactate, and bicarbonate are observable and have provided in vivo metabolic imaging of normal and disease processes [4,7–11].
When using hyperpolarized agents, the majority of the magnetization cannot be recovered once it decays to its thermal equilibrium level. This results in a maximum imaging window of approximately 1–2 minutes for the 13C pyruvate substrate and its products because of T1 decay. Furthermore, every RF excitation also uses up some of the hyperpolarized magnetization. For this reason, small flip angle RF pulses are generally used to preserve the magnetization for a longer time [4].
In this paper we present a method using tailored excitation pulses to provide a balance between SNR, temporal window, and consumption of magnetization for dynamic chemical shift imaging. Multiband spectral-spatial RF pulses [14,15], designed using new methods for reduced RF power, improved accuracy and flexibility [16], provide different flip angles for the substrate and products. This imaging method allows for improved observation of the dynamic kinetics because the hyperpolarized substrate is minimally perturbed while the SNR of the products is increased.
2 Theory
Hyperpolarization by DNP offers polarization gains of over 10,000 [1,2] but the enhancement decays back to thermal equilibrium by both T1 and T2 relaxation. The hyperpolarized magnetization is stored longitudinally, and any magnetization that is rotated into the transverse plane will decay by T2 relaxation. For example, a 90° pulse can practically destroy the hyperpolarized magnetization within a couple T2 intervals following the pulse. Unlike thermally polarized spins, the magnetization does not recover by T1, so care must be taken to efficiently use the available hyperpolarization.
When hyperpolarized 13C pyruvate is used as a substrate, it is converted enzymatically in vivo to 13C lactate and 13C alanine, but their signal is much lower and more difficult to observe than the pyruvate. The hydrate form of pyruvate is also seen, and is in equilibrium with pyruvate. In the 13C spectrum at 3T, these four compounds are well separated but within a 550 Hz bandwidth.
RF pulses with spectrally varying flip angles can be used to tradeoff between use of the hyperpolarized magnetization and SNR. The pyruvate substrate stores the majority of the hyperpolarized magnetization, so a small flip angle will preserve this magnetization while still providing adequate SNR. The products benefit from a larger flip angle for higher SNR. Also, pyruvate and its hydrate are in exchange, so tipping the hydrate can also result in a loss of the hyperpolarized pyruvate magnetization.
3 Methods
The experiments presented used new, multiband spectral-spatial pulses. These pulses were designed for good SNR of lactate and alanine while preserving the majority of hyperpolarized magnetization stored in the pyruvate substrate to enable a long imaging window. They were followed in the sequence by an adiabatic double spin-echo and a flyback spectral-spatial readout encoding for time-resolved 2D MRSI.
3.1 RF Excitation Pulse
The RF excitation pulses used were spectral-spatial pulses with multiple spectral bands, each of which can have a different flip angle. These pulses were designed using the method described in [16], which is summarized here. It features a convex optimization design of the spectral filter and correction of chemical-shift slice misregistration. The design is very flexible, allowing for adjustments of the spectral bands and spatial profile, and the resulting pulses are efficient in terms of power and duration. First, the range of spectral sampling frequencies, Fs - the inverse of the distance between the spatial subpulses - is calculated. The maximum sampling frequency, Fmax, is the inverse of the the minimum-time gradient sublobe duration. This gradient satisfies the spatial time-bandwidth (TBW), gradient system constraints, and the specified fraction of the sublobe ramps allowed for applying VERSE [17] to the RF. For flyback gradient designs, the minimum-time gradient rewinder is also included in the sublobe. The minimum sampling frequency, Fmin, is the inverse of the total width of frequencies specified.
For Fs ∈ [Fmin, Fmax], filters are designed that meet the desired spectral response. These are designed using an FIR filter design method based on convex optimization and spectral factorization [18]. This method supports complex filters, which allows for variable amplitude band specification and has no symmetry restrictions on the frequency response. It uses the frequency magnitude response to design the filter, and magnitude bounds are derived based on the desired spectral response. The FIR design problem is solved with a linear program as described in [18]. Additionally, the filter autocorrelation is minimized in the linear program. Including this term explicitly minimizes the transition band energy, which reduces the overall RF power. Such minimization is not available in the complex Parks-McClellan filter design method [19]. The minimum-length filter is also achieved by using the bisection method described in [18], which results in the minimum-time RF pulse. For each realizable spectral filter, a correction is applied to reduce chemical-shift slice misregistration. This misregistration is the result of nonuniform kz-t sampling in excitation k-space that is in a “zig-zag” pattern because of the oscillating gradient and also is the source of Nyquist stopband ghosts [20]. A regularized least-squares fit is used to calculate different filters for each constant kz sampling line that match the uniform sampling spectral filter for the actual, nonuniform excitation k-space locations, as described in [21,22]. They are applied to the spatial subpulses at the appropriate kz locations. Following all of these steps, a set of spectral-spatial pulses with varying Fs is produced. Among the set, one pulse is chosen based on any criteria, such as minimum-time, minimum-power, or minimum-amplitude. For these experiments, the minimum-time Fs pulse was chosen because small flip angles were used and RF amplitude was not a limiting factor.
Figure 1 shows the multiband RF excitation pulse used for the hyperpolarized 13C-pyruvate rat experiments at 3T. This 16.2 ms pulse has a spatial TBW of 3.0 and ripples of 1% with a minimum slice thickness of 15 mm for a gradient amplitude of 4.0 G/cm. A flyback gradient was used and the RF has a 0.081 G peak amplitude. The nonuniform kz-t sampling has been corrected so this pulse has no chemical shift misregistration, as seen by the identical spatial extent across the frequency range of interest in Fig. 1c.
Fig. 1.

Multiband excitation pulse with a flyback gradient and a 15 mm slice thickness. (a) RF pulse - real (solid) and imaginary (dashed) components - and accompanying gradient. (b) Spectral profile, with specified bands (dashed lines) for pyruvate (pyr) of a 1° flip, a 10° flip for alanine (ala), a 4° flip for pyruvate-hydrate (pyr-H2O), and a 10° flip for lactate (lac). (c) Spectral and spatial profile.
The response was specified around the pyruvate, lactate, alanine, and pyruvate-hydrate resonances with a bandwidth of ±0.4 ppm (±13 Hz at 3T), shown by the dashed lines in Fig. 1b. Pyruvate was designed for a 1° flip with a 0.1% ripple so the majority of the hyperpolarization is preserved. Lactate and alanine were designed for a 10° flip and 1% ripple to provide enough SNR for observation. The pyruvate-hydrate flip angle was minimized because saturation of the hydrate magnetization may also saturate the pyruvate magnetization. While keeping the pulse duration less than 20 ms, a 4° flip with 10% ripple was achieved.
Figure 2 shows the pulse used for the mouse experiments in which an echo-planar gradient was used and no pyruvate-hydrate was excited. This pulse was 20.1 ms with a spatial TBW of 3.0, 1% ripple, a 5 mm minimum slice thickness for a 4.0 G/cm gradient, and a peak amplitude of 0.11 G. It was designed to have a 60° flip with 2% ripple for lactate and alanine, a 6° flip with 1% ripple for pyruvate, and no pyruvate-hydrate excitation with a 2% ripple. A ±0.4 ppm bandwidth was used around each peak, and the designed bands are the dashed lines in Fig. 2b.
Fig. 2.

Multiband excitation pulse with an echo-planar gradient, 5 mm slice thickness, and no pyruvate-hydrate excitation. (a) RF pulse - real (solid) and imaginary (dashed) components - and accompanying gradient. (b) Spectral profile, with specified bands (dashed lines) for pyr of a 6° flip, ala and lac of a 60° flip, and 0° flip for pyr-H2O. (c) Spectral and spatial profile.
3.2 Imaging Sequence
The pulse sequence used for dynamic MRSI is shown in Fig. 3. The multiband excitation pulses described previously in this section were followed by two hyperbolic secant adiabatic refocusing pulses. There is no time for correct B1 calibration during the hyperpolarized experiment, and the pair of adiabatic pulses ensured that no magnetization was lost due to flip angle inaccuracies while forming a spin-echo [23].
Fig. 3.

Pulse sequence. The spectral-spatial excitation pulse and accompanying gradient (Fig. 1) are followed by a phase encoding gradient. A pair of adiabatic refocusing pulses are used for a B1-insensitive spin-echo [23], which occurs halfway through the flyback echo-planar readout gradient. The crushers around the adiabatic pulses and after the sequence are not shown, and the adiabatic pulse amplitude has been reduced for visualization.
During the readout, a flyback echo-planar gradient was used to encode both spectral and spatial information [24]. This gradient was 101.48 ms with a spectral resolution of 9.83 Hz and a 581 Hz spectral bandwidth to include all metabolites of interest. A full echo acquisition was used for improved SNR and to allow for magnitude spectral reconstructions [25]. This sequence was repeated for 8 phase encode steps, resulting in a 16×8 effective matrix.
3.3 Animal Experiments
Experiments were performed on a GE Excite 3T clinical MRI system (GE Healthcare, Waukesha, WI, USA) with 40 mT/m, 150 mT/m/ms gradients and a broadband RF amplifier. Custom built, dual-tuned rat and mouse birdcage coils were used for RF transmission and signal reception. For the hyperpolarized experiments, the RF transmitter gain was determined based on previous phantom experiments, and was estimated to be within ±10% of the appropriate value. The center frequency was calibrated using a syringe filled with a 1.77 M concentration of 13C lactate inserted next to the animal in the coil. A compound consisting of 13C pyruvic acid and the trityl radical (GE Healthcare, Oslo, Norway) was polarized in a HyperSense DNP (Oxford Instruments, Abingdon, UK) at 3.35 T and a temperature of 1.4° K. An aliquot was taken and injected into a polarimeter to measure the percent polarization. The pH was monitored using the aliquot and other excess pyruvate.
All animal studies were carried out under a protocol approved by the UCSF Institutional Animal Care and Use Committee. The rat experiments had 10 mm in-plane resolution and a 15 mm slice for 1.5 cc voxels. TE = 160 ms and TR = 625 ms were used, with a temporal resolution of 5 s. A total of 20 time points were acquired starting at the beginning of the pyruvate injection. For 8 phase encodes, the pyruvate had an expected loss of 0.12% of the magnetization for the 1° flip. The lactate and alanine expected loss, with the desired flip angle of 10°, was 11%, while the pyruvate-hydrate was 1.9% for the 4° flip.
The hyperpolarized pyruvate was dissolved to 100 mM, and 2.2 mL of this solution was injected into the tail vein of a rat over 12 seconds. Kidney slices were chosen because of their high accumulation of pyruvate and metabolites. The multiband pulse shown in Fig. 1 was compared to standard slice-selective RF pulses designed with the Shinnar-Le Roux algorithm [26] using flip angles of 5° and 10°. The standard pulse replaced the multiband pulse in the sequence shown in Fig. 3. The comparisons of a constant flip and a multiband pulse were performed within one hour of each other on the same animal at identical locations.
A transgenic adenocarcinoma of mouse prostate (TRAMP) mouse with an advanced tumor was imaged with this dynamic 2D 13C MRSI sequence using a 5 mm slice and a 5×5.4 mm in-plane resolution for 0.135 cc voxels. TE = 160 ms, TR = 250 ms, and a temporal resolution of 5 s were used. A total of 20 time points were acquired starting at the beginning of the pyruvate injection. An intravenous catheter placed in the jugular vein was used for injecting 400 μL of 80 mM hyperpolarized pyruvate solution over 12 s. The imaging slice was centered on the tumor. A variable flip angle scheme was used across all images to minimize blurring and increase the flip angle in later images [27,28]. As shown in Fig. 2, the pulse had a final flip angle of 60° for lactate and alanine, 6° for pyruvate, and 0° for pyruvate-hydrate. The prior flip angles were calculated for a constant lactate and alanine signal, and the pulse was scaled accordingly:
| (1) |
| (2) |
where n is the excitation pulse number. This resulted in an initial flip angle of 4.5° for lactate and alanine, where 2.5% of the magnetization was used per image. This progressed to 7° at 60 s (6.5% magnetization used) and 12° at 85 s after injection (16.2% magnetization used per image). The initial pyruvate flip angle was 0.5°, using only 0.03% of the magnetization, and progressed to 0.6° 40 s after injection (0.04% used) when pyruvate was last observed.
4 Results
The in vivo results in Figs. 4 and 5 compare 5° and 10° excitation pulses to the multiband excitation pulse shown in Fig. 1. In comparison to the 5° pulse (Fig. 4), the multiband pulse shows substantial increases in SNR and signal duration for lactate and alanine throughout the slice. The pyruvate signal is scaled down in the 5° pulse plots in Fig. 4c and d, and was lower by approximately the expected factor of 5. The pyruvate-hydrate signal is similar between the experiments, as expected. The measured polarizations were 18.3% (5°) and 18.9% (multiband).
Fig. 4.

Dynamic hyperpolarized 13C MRSI in a rat comparing a 5° pulse to the multiband pulse in Fig. 1. (a) T2-weighted fast spin-echo image showing the voxel locations. (b) Spectra from the eighth time point for both excitation pulses (37.5 s after injection, at the dashed line in (c) and (d)). (c,d) Dynamic data from two voxels showing the increased lactate and alanine SNR. In these plots the pyruvate signal has been scaled down by 4 for the 5° pulse data.
Fig. 5.

Dynamic hyperpolarized 13C MRSI in a rat comparing a 10° pulse to the multiband pulse in Fig. 1. (a) T2-weighted fast spin-echo image showing the voxel locations. (b) Spectra from the fifth time point for both excitation pulses (22.5 s after injection, at the dashed line in (c) and (d)). (c,d) Dynamic data from two voxels. In these plots the pyruvate signal has been scaled down by 8 for the 10° pulse data. The spectra and dynamics show an increase in SNR and signal duration for lactate and alanine when using the multiband pulse.
In Fig. 5, the flip angle at the lactate and alanine resonances was 10° for both pulses. This was tested before the experiment by acquiring spectra of the 13C lactate syringe with the multiband pulse centered at different frequencies, and was confirmed by the nearly identical SNR of the syringe during the experiments (top-right voxel in Fig. 5b). The spectra in Fig. 5b, acquired 22.5 s after injection, also show generally increased SNR for lactate and alanine with the multiband pulse, which is particularly evident in the highlighted and posterior voxels. The measured polarizations were similar: 21.8% for the 10° pulse and 19.6% for the multiband pulse. Pyruvate and pyruvate-hydrate SNR was reduced with the multiband pulse, as expected.
The change in SNR is also shown in the dynamic curves in Fig. 5c and d. The pyruvate signal, scaled differently in the plots, had approximately the expected factor of 10 difference between the pulses. The lactate and alanine SNR is increased when the pyruvate flip angle is smaller presumably because more hyperpolarized pyruvate 13C signal was retained throughout the repetitive pulsing. The time course of the metabolites also was observed to be generally lengthened, which is particularly noticeable for lactate in Fig. 5d.
The TRAMP mouse experimental results using the echo-planar pulse with a 5 mm slice thickness (Fig. 2) is shown in Fig. 6, which had a polarization of 17.8%. The coronal slice used covers a large portion of the body, only a section of which is shown. Substantial lactate 13C signal was detected in the tumor with a lengthened time course, which is consistent with previous results [7]. The alanine in the liver can also be observed by this slice. The variable flip angle scheme used results in increased SNR at later time points, which allows for a longer observation of the metabolite distribution.
Fig. 6.
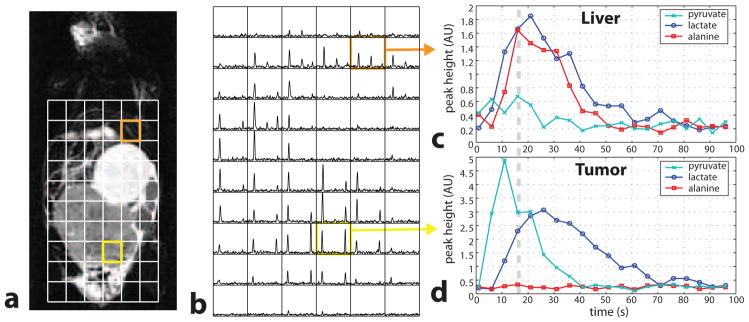
Dynamic hyperpolarized 13C MRSI in a TRAMP mouse. (a) T2-weighted fast spin-echo image, and (b) voxel spectra with 0.135 cc voxels and the multiband excitation from Fig. 2 acquired 20 s after injection (dashed line in c,d). (c,d) Liver and tumor voxel time series. The y-axis is differently scaled between the two plots. The flip angles were increased over time.
5 Discussion
The multiband pulses used in these experiments were the result of testing various pulse designs and balancing the tradeoffs between SNR, observable time, and disruption of metabolite kinetics. The desired flip angles and spectral bandwidths can be modified to adjust these tradeoffs depending on the application, as demonstrated by the two RF pulses shown. The pulse in Figure 1 uses a robust flyback gradient design and does not substantially perturb the magnetization for each acquired image. The pulse in Figure 2 was designed to not excite the pyruvate-hydrate in order to reduce pyruvate saturation due to exchange and also with larger flip angles to use up more of the metabolite magnetization in later images. For kinetic modeling, it may be desirable to alter the pulse design and increase the pyruvate SNR for improved data fitting [29]. The apparent T2 values in vivo for the observed 13C-labeled metabolites has been measured to be between the hundreds of ms up to several seconds [30], and the shortest observed component was 110 ms. Since this is nearly an order of magnitude greater than the excitation pulse durations of 16.2 and 20.1 ms, the effect of decay during the pulse is relatively small and results in a decreased flip angle of 5–10% for this shortest observed component. For the many longer components observed, the effect of decay is negligible. The TE of 160 ms used in the experiments is on the order of these shortest T2 components. However, it has been previously shown in hyperpolarized 13C MRSI that using a longer TE = 140 ms with a symmetric echo acquisition provides consistently better SNR in vivo when compared with a half echo and a shorter TE = 35 ms [25].
This pulse design approach can also be extended to other substrates and metabolite products, and also to different field strengths. The convex optimization spectral filter design algorithm used allows for arbitrary filter specifications, within the achievable design limitations, which makes these extensions to the pulse design relatively straightforward. Another way to increase the flexibility of the pulse design is to allow the desired spectral bands to alias, provided the band amplitudes are self-consistent when they overlap [16]. This can reduce the minimum sampling frequency, Fmin, allowing for wider gradient lobes which, in turn, can be used for higher spatial TBWs or narrower minimum slice widths. The aliasing bands also would be particularly valuable for applications with a broader required bandwidth.
This method can also simply be modified for 3D MRSI by adding a second phase encode direction. Compressed sensing acquisition and reconstruction techniques can also be combined with this method for improved temporal resolution, spatial resolution, or increased volumetric coverage, all without increasing the number of RF excitations required [31,32].
The mouse experiment shown in Fig. 6 used a simple variable flip angle scheme to keep the expected signal level constant between phase encodes thus minimizing blurring. To use up all of the magnetization, as could be desirable for kinetic modeling, a final flip angle of 90° is required, which can be precisely designed using a Shinnar-Le Roux [26] spectral-spatial design. A more complex variable flip angle scheme could also be applied across the images to get the most SNR. For example, only 16.2% of the lactate magnetization was used at 85 s, when lactate was last observed in Fig. 6, and using a larger percentage of this magnetization at these last time points may have increased the overall duration of the observable lactate. Determining the flip angle variations requires assumption of T1s or dynamic curves, which could be based on previous in vivo dynamics. By using different multiband pulses, the flip angle could also vary both spectrally and temporally. For example, the pryuvate resonance, whose signal decays faster, would receive a flip angle that would increase sooner, while the lactate and alanine flip angles would increase later since their magnetization decays later.
6 Conclusion
We have presented a method using specialized RF pulses for dynamic hyperpolarized 13C MRSI with improved SNR over previous methods. The multiband, variable flip angle RF pulses provide improved SNR and longer time courses for the metabolic products over constant flip angle schemes, as demonstrated by the in vivo results. Using this method allows for observation of spatial variations of the substrate uptake, metabolite kinetics, and metabolic time constants.
Acknowledgments
The authors would like to acknowledge Dr. Robert Bok, Vickie Zhang, Srivathsa Veeraraghavan and Mark VanCriekinge for assistance with the experiments, and GE Healthcare for providing research and equipment support.
Footnotes
Publisher's Disclaimer: This is a PDF file of an unedited manuscript that has been accepted for publication. As a service to our customers we are providing this early version of the manuscript. The manuscript will undergo copyediting, typesetting, and review of the resulting proof before it is published in its final citable form. Please note that during the production process errors may be discovered which could affect the content, and all legal disclaimers that apply to the journal pertain.
References
- 1.Ardenkjaer-Larsen JH, Fridlund B, Gram A, Hansson G, Hansson L, Lerche MH, Servin R, Thaning M, Golman K. Increase in signal-to-noise ratio of > 10,000 times in liquid-state NMR. Proc Natl Acad Sci U S A. 2003;100(18):10158–10163. doi: 10.1073/pnas.1733835100. [DOI] [PMC free article] [PubMed] [Google Scholar]
- 2.Golman K, Ardenkjaer-Larsen JH, Petersson JS, Mansson S, Leunbach I. Molecular imaging with endogenous substances. Proc Natl Acad Sci U S A. 2003;100(18):10435–10439. doi: 10.1073/pnas.1733836100. [DOI] [PMC free article] [PubMed] [Google Scholar]
- 3.Wolber J, Ellner F, Fridlund B, Gram A, Johannesson H, Hansson G, Hansson LH, Lerche MH, Mansson S, Servin R, Thaning M, Golman K, Ardenkjaer-Larsen JH. Generating highly polarized nuclear spins in solution using dynamic nuclear polarization. Nucl Instr Meth Phys Res A. 2004;526(1–2):173–181. [Google Scholar]
- 4.Golman K, in‘t Zandt R, Thaning M. Real-time metabolic imaging. Proc Natl Acad Sci U S A. 2006;103(30):11270–11275. doi: 10.1073/pnas.0601319103. [DOI] [PMC free article] [PubMed] [Google Scholar]
- 5.Golman K, Zandt Ri, Lerche M, Pehrson R, Ardenkjaer-Larsen JH. Metabolic Imaging by Hyperpolarized 13C Magnetic Resonance Imaging for In vivo Tumor Diagnosis. Cancer Res. 2006;66(22):10855–10860. doi: 10.1158/0008-5472.CAN-06-2564. [DOI] [PubMed] [Google Scholar]
- 6.Golman K, Petersson JS. Metabolic imaging and other applications of hyperpolarized 13C1. Acad Radiol. 2006;13(8):932–942. doi: 10.1016/j.acra.2006.06.001. [DOI] [PubMed] [Google Scholar]
- 7.Chen AP, Albers MJ, Cunningham CH, Kohler SJ, Yen YF, Hurd RE, Tropp J, Bok R, Pauly JM, Nelson SJ, Kurhanewicz J, Vigneron DB. Hyperpolarized C-13 spectroscopic imaging of the TRAMP mouse at 3T–initial experience. Magn Reson Med. 2007;58:1099–1106. doi: 10.1002/mrm.21256. [DOI] [PubMed] [Google Scholar]
- 8.Kohler SJ, Yen Y, Wolber J, Chen AP, Albers MJ, Bok R, Zhang V, Tropp J, Nelson S, Vigneron DB, Kurhanewicz J, Hurd RE. In vivo 13carbon metabolic imaging at 3T with hyperpolarized 13C-1-pyruvate. Magn Reson Med. 2007;58(1):65–69. doi: 10.1002/mrm.21253. [DOI] [PubMed] [Google Scholar]
- 9.Day SE, Kettunen MI, Gallagher FA, Hu DE, Lerche M, Wolber J, Golman K, Ardenkjaer-Larsen JH, Brindle KM. Detecting tumor response to treatment using hyperpolarized 13C magnetic resonance imaging and spectroscopy. Nat Med. 2007;13(11):1382–1387. doi: 10.1038/nm1650. [DOI] [PubMed] [Google Scholar]
- 10.Nelson SJ, Chen AP, Bok R, Albers MJ, Zierhut ML, Kurhanewicz J, Vigneron DB, Kohler S, Yen Y-F, Tropp J, Gram A, Wolber J, Dirven H, Hurd RE. Hyperpolarized C-13 MRSI data of dog prostate at 3T. Proceedings of the 15th Annual Meeting of ISMRM; Berlin. 2007. p. 536. [Google Scholar]
- 11.Hu S, Chen AP, Zierhut ML, Bok R, Yen Y-F, Hurd RE, Nelson SJ, Kurhanewicz J, Vigneron DB. Initial in vivo carbon-13 dynamic spectroscopy of rat liver and kidney at 3T with hyperpolarized 13C-1-pyruvate. Joint Molecular Imaging Conference; Providence, RI. 2007. p. 305. [Google Scholar]
- 12.Merritt ME, Harrison C, Storey C, Jeffrey FM, Sherry AD, Malloy CR. Hyperpolarized 13C allows a direct measure of flux through a single enzyme-catalyzed step by NMR. Proc Natl Acad Sci U S A. 2007;104(50):19773–19777. doi: 10.1073/pnas.0706235104. [DOI] [PMC free article] [PubMed] [Google Scholar]
- 13.Merritt ME, Harrison C, Mander W, Malloy CR, Sherry AD. Dipolar cross-relaxation modulates signal amplitudes in the 1H NMR spectrum of hyperpolarized [13C]formate. J Magn Reson. 2007;189(2):280–285. doi: 10.1016/j.jmr.2007.09.011. [DOI] [PMC free article] [PubMed] [Google Scholar]
- 14.Schricker AA, Pauly JM, Kurhanewicz J, Swanson MG, Vigneron DB. Dualband spectral-spatial RF pulses for prostate MR spectroscopic imaging. Magn Reson Med. 2001;46(6):1079–1087. doi: 10.1002/mrm.1302. [DOI] [PubMed] [Google Scholar]
- 15.Cunningham CH, Vigneron DB, Marjanska M, Chen AP, Xu D, Hurd RE, Kurhanewicz J, Garwood M, Pauly JM. Sequence design for magnetic resonance spectroscopic imaging of prostate cancer at 3T. Magn Reson Med. 2005;53(5):1033–1039. doi: 10.1002/mrm.20478. [DOI] [PubMed] [Google Scholar]
- 16.Kerr AB, Larson PE, Lustig M, Cunningham CH, Chen AP, Vigneron DB, Pauly JM. Multiband spectral-spatial design for high-field and hyperpolarized C-13 applications. Proceedings of the 16th Annual Meeting of ISMRM; Toronto. 2008. p. 226. [Google Scholar]
- 17.Conolly SM, Nishimura DG, Macovski A, Glover GH. Variable-rate selective excitation. J Magn Reson. 1988;78(3):440–458. [Google Scholar]
- 18.Wu SP, Boyd S, Vandenberghe L. FIR filter design via semidefinite programming and spectral factorization. Proc 35th IEEE Dec and Control. 1996;1:271–276. [Google Scholar]
- 19.Karam LJ, McClellan JH. Complex Chebyshev approximation for FIR filter design. IEEE Transactions on Circuits and Systems II: Analog and Digital Signal Processing. 1995;42(3):207–16. [Google Scholar]
- 20.Meyer C, Pauly J, Macovski A, Nishimura D. Simultaneous spatial and spectral selective excitation. Magn Reson Med. 1990;15(2):287–304. doi: 10.1002/mrm.1910150211. [DOI] [PubMed] [Google Scholar]
- 21.Cunningham CH, Vigneron DB, Chen AP, Xu D, Lustig M, Kelley DA, Pauly JM. Spectral-spatial excitation and refocusing for reduced volume mis-registration at 7 Tesla. Proceedings of the 14th Annual Meeting of ISMRM; Seattle. 2006. p. 72. [Google Scholar]
- 22.Cunningham CH, Chen AP, Lustig M, Lupo J, Xu D, Kurhanewicz J, Hurd RE, Pauly JM, Nelson SJ, Vigneron DB. Pulse sequence for dynamic volumetric imaging of hyperpolarized metabolic products. J Magn Reson. 2008;193(1):139–146. doi: 10.1016/j.jmr.2008.03.012. [DOI] [PMC free article] [PubMed] [Google Scholar]
- 23.Cunningham CH, Chen AP, Albers MJ, Kurhanewicz J, Yen YF, Hurd RE, Pauly JM, Nelson SJ, Vigneron DB. Double spin-echo sequence for rapid spectroscopic imaging of hyperpolarized 13C. J Magn Reson. 2007;187(2):357–362. doi: 10.1016/j.jmr.2007.05.014. [DOI] [PubMed] [Google Scholar]
- 24.Cunningham CH, Vigneron DB, Chen AP, Xu D, Nelson SJ, Hurd RE, Kelley D, Pauly JM. Design of flyback echo-planar readout gradients for magnetic resonance spectroscopic imaging. Magn Reson Med. 2005;54:1286–1289. doi: 10.1002/mrm.20663. [DOI] [PubMed] [Google Scholar]
- 25.Chen AP, Hurd RE, Cunningham CM, Albers M, Zierhut ML, Yen Y-F, Tropp J, Bok R, Nelson SJ, Kurhanewicz J, Vigneron DB. Symmetric echo acquisition of hyperpolarized C-13 MRSI data in the TRAMP mouse at 3T. Proceedings of the 15th Annual Meeting of ISMRM; Berlin. 2007. p. 538. [Google Scholar]
- 26.Pauly J, Le Roux P, Nishimura D, Macovski A. Parameter relations for the Shinnar-Le Roux selective excitation pulse design algorithm. IEEE Trans Med Imaging. 1991;10(1):53–65. doi: 10.1109/42.75611. [DOI] [PubMed] [Google Scholar]
- 27.Zhao L, Mulkern R, Tseng CH, Williamson D, Patz S, Kraft R, Walsworth RL, Jolesz FA, Albert MS. Gradient-echo imaging considerations for hyperpolarized 129Xe MR. J Magn Reson B. 1996;113(2):179–183. [PubMed] [Google Scholar]
- 28.Nagashima K. Optimum pulse flip angles for multi-scan acquisition of hyperpolarized nmr and mri. J Magn Reson. 2008;190(2):183–188. doi: 10.1016/j.jmr.2007.10.011. [DOI] [PubMed] [Google Scholar]
- 29.Zierhut ML, Chen AP, Bok R, Albers MJ, Zhang V, Pels P, Tropp J, Park I, Vigneron DB, Kurhanewicz J, Hurd RE, Nelson SJ, Yen Y-F. Kinetic modeling of hyperpolarized 13C1-pyruvate metabolism using dynamic magnetic resonance spectroscopy. Proceedings of the 15th Annual Meeting of ISMRM; Berlin. 2007. p. 366. [Google Scholar]
- 30.Yen Y-F, Roux PL, Bok R, Tropp J, Chen AP, Zhang V, Zierhut ML, Albers M, Park I, Nelson SJ, Vigneron DB, Kurhanewicz J, Hurd RE. Apparent T2 of 13C-labeled metabolites in vivo. Proceedings of the 16th Annual Meeting of ISMRM; Toronto. 2008. p. 1747. [Google Scholar]
- 31.Lustig M, Donoho D, Pauly JM. Sparse MRI: The application of compressed sensing for rapid MR imaging. Magn Reson Med. 2007;58(6):1182–1195. doi: 10.1002/mrm.21391. [DOI] [PubMed] [Google Scholar]
- 32.Hu S, Lustig M, Chen AP, Crane J, Kerr A, Kelley DAC, Hurd RE, Kurhanewicz J, Nelson SJ, Pauly JM, Vigneron DB. Compressed sensing for resolution enhancement of hyperpolarized 13C flyback 3D-MRSI. J Magn Reson. 2008;192(2):258–264. doi: 10.1016/j.jmr.2008.03.003. [DOI] [PMC free article] [PubMed] [Google Scholar]