

Abstract
The inner ear contains sensory epithelia that detect head movements, gravity and sound. It is unclear how to derive these sensory epithelia from pluripotent stem cells, a process which will be critical for modeling inner ear disorders or developing cell-based therapies for profound hearing loss and balance disorders1,2. To date, attempts to derive inner ear mechanosensitive hair cells and sensory neurons have resulted in inefficient or incomplete phenotypic conversion of stem cells into inner ear-like cells3–7. A key insight lacking from these previous studies is the importance of the non-neural and pre-placodal ectoderm, two critical precursors during inner ear development8–11. Here we report the step-wise differentiation of inner ear sensory epithelia from mouse embryonic stem cells (ESCs) in three-dimensional culture12,13. We show that by recapitulating in vivo development with precise temporal control of BMP, TGFβ and FGF signaling, ESC aggregates transform sequentially into non-neural, pre-placodal and otic placode-like epithelia. Remarkably, in a self-organized process that mimics normal development, vesicles containing prosensory cells emerge from the presumptive otic placodes and give rise to hair cells bearing stereocilia bundles and a kinocilium. Moreover, these stem cell-derived hair cells exhibit functional properties of native mechanosensitive hair cells and form specialized synapses with sensory neurons that have also arisen from ESCs in the culture. Finally, we demonstrate how these vesicles are structurally and biochemically comparable to developing vestibular end organs. Our data thus establish a novel in vitro model of inner ear differentiation that can be used to gain deeper insight into inner ear development and disorder.
During neurulation in vivo, the definitive ectoderm is subdivided into the neuroectoderm and non-neural ectoderm, the latter of which gives rise to the inner ear (Supplementary Figure 1a). Recent studies demonstrated how organogenesis of complex neuroectoderm tissues such as the cerebral cortex and retina can be faithfully reconstituted in vitro by culturing ESCs as a floating aggregate in serum-free media (SFEBq culture)12,14,15. Since the inner ear shares a common precursor with these tissues, the definitive ectoderm, we proposed that SFEBq culture could be redirected to generate inner ear epithelia using carefully timed morphogenetic cues (Fig. 1a and Supplementary Fig. 1b). Led by previous studies, we identified a definitive ectoderm-like epithelium on day 3 of SFEBq culture, prior to expression of neuroectoderm-associated proteins on day 5 (Supplementary Fig. 1c–j)13,16. During early embryogenesis, activation of bone morphogenetic protein (BMP) signaling is critical for induction of the non-neural ectoderm from the definitive ectoderm epithelium11,17. Consistent with this role, in aggregates treated with BMP4 (hereafter, BMP), the non-neural ectoderm marker Dlx3 was upregulated, while the neuroectoderm marker Sox1 was downregulated (Supplementary Fig. 1k, l). Yet BMP-treated aggregates also expressed the mesendoderm marker brachyury, indicating the undesirable induction of mesoderm or endoderm cell types (Fig. 1b–h and Supplementary Fig. 2b)18. To suppress aberrant mesendoderm induction, we combined BMP treatment with the transforming growth factor β (TGFβ) inhibitor SB-431542 (SB; Fig. 1a)19. A combined treatment of SB and BMP (BMP/SB) on day 3 completely abolished brachyury+ cells in the outer-epithelium (Fig. 1d, e, h; see Supplementary Discussion)12,18,19.
Figure 1. Non-neural and pre-placodal ectoderm induction in 3D culture.

a, Non-neural ectoderm induction strategy. de, definitive ectoderm; me, mesendoderm; nne, non-neural ectoderm; ne, neuroectoderm. b-d, Morphology of control (Ctrl), BMP, and BMP/SB aggregates. e, SB decreases the level of brachyury expression induced by BMP (n=3; **P<0.01; mean ± s.e.m.). f-h, Brachyury+ cells are less prevalent in BMP/SB aggregates. i-k, BMP/SB aggregates contain an outer AP2/Ecad+ epithelium and an interior Sox1+ and Ncad+ cell layer. l, BMP/SB aggregate composition on day 5. m, Pre-placodal ectoderm induction strategy. epi, epidermis; ppe, pre-placodal ectoderm. n-p, BMP/SB-FGF/LDN are distinguished by a thickened AP2+ epithelium absent in other conditions. Scale bars, 100 μm.
To test whether BMP/SB treatment indeed induced non-neural ectoderm, we assessed the cellular composition of BMP/SB-treated aggregates by immunofluorescence at differentiation day 5. Remarkably, expression of the non-neural ectoderm marker AP2 was found predominantly in the Ecad+outer-epithelium, but was absent in other regions of treated aggregates (Fig. 1i, j). Moreover, we identified an intermediate layer of each aggregate with Sox1+ and N-cadherin (Ncad)+ cells, indicative of the formation of neuroectoderm (Fig. 1j, k and Supplementary Fig. 1h). In addition, the pluripotency marker Nanog was confined to cells at the core of each aggregate (Supplementary Fig. 2g). Altogether, these data strongly suggest that the outer-epithelium of day 5 BMP/SB-treated aggregates represents non-neural ectoderm, which surrounds an interior layer containing a mixture of mesendodermal and neuroectodermal tissues and a central core of pluripotent cells (Fig. 1l and Supplementary Fig. 2). In support of this conclusion, the outer-epithelium of BMP/SB samples develops into a Krt5/p63+ epithelium, mimicking embryonic development of the epidermis (Supplementary Fig. 3).
The pre-placodal region, a contiguous band of embryonic head ectoderm, arises from the non-neural ectoderm at the neural tube border and is the precursor to all of the cranial placodes (Supplementary Fig. 4a)11. While BMP signaling is required for induction of non-neural ectoderm, recent studies suggest that subsequent BMP inhibition, along with active fibroblast growth factor (FGF) signaling, is necessary for non-neural cells to select a pre-placodal over an epidermal fate (Fig. 1m)9,20,21. With this in mind, we began treating BMP/SB aggregates with various combinations of the specific BMP inhibitor, LDN-193189 (LDN) and FGF2. We found that BMP/SB aggregates treated with LDN on day 4.5 maintained expression of Dlx3, indicating that BMP inhibition after non-neural induction does not reverse cell fate specification (Supplementary Fig. 4c). Consistent with the pre-placodal ectoderm being significantly thicker than the surrounding surface ectoderm8,11, we found thickened patches of epithelia in BMP/SB-LDN aggregates that were not present in BMP/SB epithelia (Supplementary Fig. 4b, h). As observed in vivo, this morphological change appeared to be dependent on endogenous FGFs, as inhibition of FGF signaling by the small molecule SU5402 abolished epithelial thickening (Supplementary Fig. 5a). A combined treatment of recombinant FGF2 and LDN (hereafter, BMP/SB-FGF/LDN) significantly increased the thickness of the epithelium compared to BMP/SB and BMP/SB-LDN aggregates (Fig. 1n–p and Supplementary Fig. 4h). Remarkably, in >95% of BMP/SB-FGF/LDN aggregates, a thickened Gata3/Six1/AP2+ epithelium ruffled and formed ovoid vesicles between days 6–8 (Fig. 1p and Supplementary Fig. 4d–j). These and the following data strongly suggest that the outer-epithelium of BMP/SB-FGF/LDN-treated aggregates is representative of pre-placodal ectoderm.
In vertebrates, the otic placode is derived from a posterior pre-placodal region known as the otic-epibranchial placode domain (OEPD; Fig. 2a). The otic placode is demarcated from other developing placodes by expression of the transcription factors Pax2/8 (see Supplementary Fig. 6 for the in vivo situation)22. Because the induction of the OEPD requires FGF signaling and the otic placode epithelium thickens, invaginates and forms the otic vesicle10, we examined whether the vesicle forming-epithelia of BMP/SB-FGF/LDN aggregates were representative of the primordial inner ear. Our qPCR analysis revealed that Pax2 and Pax8 were significantly upregulated in BMP/SB-FGF/LDN samples compared to other conditions (Fig. 2b, c). By day 6, we observed Pax8+ cells distributed in placode-like patches throughout the outer Ecad+ epithelium of only BMP/SB-FGF/LDN aggregates (Fig. 2d, e). Notably, we also observed a population of Pax8+/Ecad- cells in the interior of each aggregate, suggesting formation of mid-hindbrain tissue in this region (Supplementary Fig. 7). The percentage of Pax8/Ecad+ epithelium dramatically increased between days 6 and 8 (Fig. 2f, g and Supplementary Fig. 8a–e) and the Pax8/Ecad+ epithelium bore a striking morphological resemblance to the developing otic placode (Supplementary Fig. 6). Of note, we did not observe expression of Pax3 or Pax6 in the outer epithelium ruling out the development of other cranial placodes (Supplementary Fig. 7c–g). Taken together, these findings show that FGF/LDN treatment is critically important for in vitro otic placode induction and that treatment is most effective when performed between days 4 and 5 (Supplementary Fig. 8).
Figure 2. Otic induction from the pre-placodal epithelium in vitro.
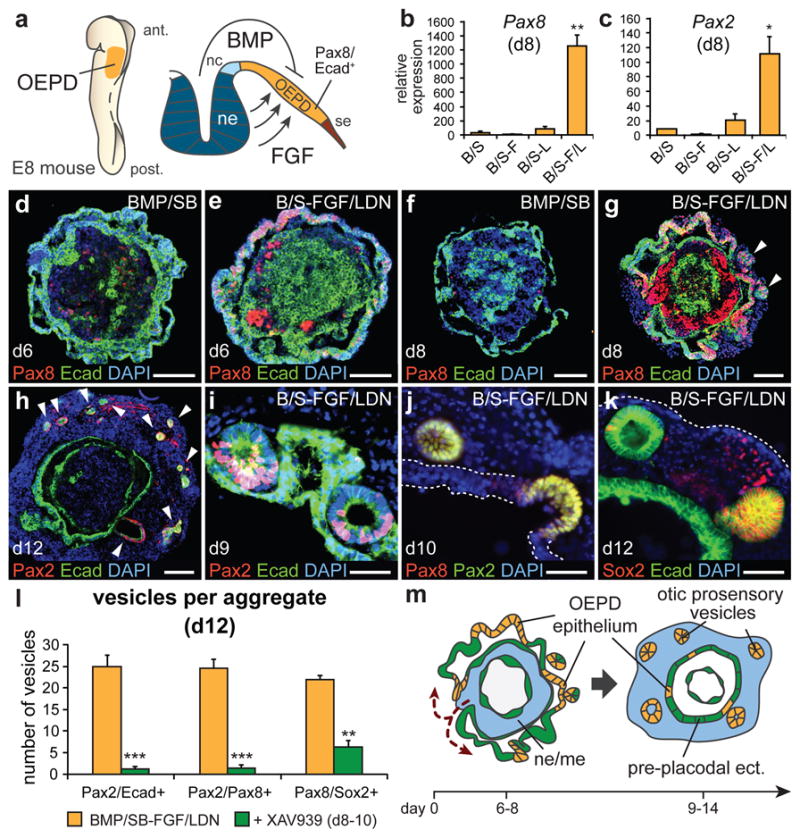
a, OEPD induction in mice. nc, neural crest; se, surface ectoderm. b, Pax8 and c, Pax2 mRNA expression on day 8 (n=3–4; **P<0.01, *P<0.05; mean ± s.e.m.) d-g, Pax8/Ecad expression in (d, f) BMP/SB and (e, g) BMP/SB-FGF/LDN aggregates on day 6 and 8. Arrowheads indicate vesicles. h, Day 12 BMP/SB-FGF/LDN aggregate with Pax2/Ecad+ vesicles (arrowheads). i, Pax2/Ecad+, (j) Pax2/8+, and (k) Pax8/Sox2+ vesicles invaginate from the inner-epithelium from day 9–12. l, XAV939 decreases the number of vesicles expressing Pax2/Ecad, Pax2/Pax8 and Pax8/Sox2 on day 12. (n=9 aggregates; ***P<0.001, **P<0.01; mean ± s.e.m.). m, Self-guided, inside-out rearrangement of BMP/SB-FGF/LDN aggregates and formation of otic vesicles. Scale bars, 100 μm (d, e, f, h), 50 μm (i-k), 25 μm (g).
In vivo, the prosensory domain of the otic placode/vesicle gives rise to the vestibular/cochlear sensory epithelia and inner ear sensory neurons. Otic prosensory cells are defined by expression of Pax2/8, Ecad, Sox2, and Jagged1 (Jag1) (Supplementary Figs. 6 and 12). On day 8 of differentiation, BMP/SB-FGF/LDN aggregates were transferred to a serum-free floating culture to allow self-guided differentiation. In each aggregate analyzed, approximately 24 hours after transfer, the interior cell mass breached the outer-epithelium and formed a heterogeneous cell layer on the exterior of the aggregate (n=253 aggregates; Fig. 2h, m and Supplementary Fig. 9). This indicated that the outer-epithelium transitions to an inner-epithelium lining the core of each aggregate. During days 9–12 we observed the continuous evagination of vesicles containing Pax2/Ecad, Pax2/8, and Sox2/Pax8+ cells from the presumptive OEPD epithelium into the exterior cell layer (Fig. 2h–k and Supplementary Figs. 9 and 10), which resulted in ~20–28 Pax2/8/Sox2+ vesicles per aggregate (Fig. 2l). We hypothesized that endogenous Wnt signaling may underlie induction of vesicles bearing otic prosensory markers in our culture because Wnt signaling is necessary for otic placode formation in vivo10. Confirming this hypothesis, treatment of aggregates with the Wnt inhibitor XAV939 from day 8–10 significantly decreased the number of prosensory vesicles and, specifically, reduced the prevalence of Pax2+ vesicles (Fig. 21). These data indicate that endogenous Wnt signaling induces formation of otic vesicles from the presumptive otic placode using similar mechanisms as observed in vivo. Interestingly, the remaining inner-epithelium developed into Krt5/p63+ epidermis and the exterior layer of cells gave rise to mesenchyme tissues like cartilage and adipose (Supplementary Fig. 11). The basal (p63+) layer of the inner-epithelium was oriented so that the apical surface of the epithelium was facing the interior of the aggregate. Thus, the process of vesicle evagination toward the outside of the aggregate is consistent with the orientation of embryonic otic vesicle invagination into the head mesenchyme (Supplementary Fig. 11).
During development, the prosensory domain of the otic vesicle is destined to become sensory epithelia harboring Myo7a+ sensory hair cells. Surprisingly, the epithelia of Sox2/Jag1+ vesicles became Myo7a+ by day 14, mimicking the diffuse Myo7a staining pattern in the E9.5 otic vesicle (Fig. 3a, b and Supplementary Fig. 12a–f). By day 16, we found that each aggregate contained 15.4 ± 4.8 (n=12 aggregates) vesicles lined with Myo7a/Sox2+ cells bearing the stereotyped morphology of sensory hair cells with a large nuclei (~8 μm diameter) positioned basal to an elongated apical end (Fig. 3c). The Myo7a/Sox2+ cells were organized in a radial pattern with the apical end abutting a lumen of varying sizes (~5–1,100 μm long-axis diameter; Fig. 3c–e). Basal to each layer of Myo7a/Sox2+ cells was a tightly arranged layer of Sox2+ cells reminiscent of supporting cells (Fig. 3c–j and Supplementary Video 1). Mimicking the in vivo sensory epithelia, hair cells and supporting cells could be further distinguished by expression of Brn3c and Cyclin D1, respectively (Supplementary Figs. 13a–f)23. F-actin staining revealed cell-cell tight-junctions along the luminal surface as well as F-actin/Espin+ stereocilia bundles (Fig. 3k–o, Supplementary Fig. 13g–i and Video 2). Every Myo7a+ cell analyzed also had an acetylated-α-Tubulin+ kinocilium protruding from the apical end into the lumen (Fig. 3m, n and Supplementary Fig. 13j–m). Stereocilia and kinocilium were not visible at d16, but the average height increased from d20 to d24 and fell within the range of heights recorded from an adult mouse utricle (Fig. 3o)24. The hair cells also appear to be functional based on the rapid uptake of FM1-43 dye and the diversity of voltage-dependent currents (Fig. 3p–r and Supplementary Fig. 14)25,26. In all cells included in this study we observed outwardly rectifying potassium currents with voltage-dependent activation kinetics to amplitudes ranging from 194 pA to 3,612 pA with a mean of 1,003 ± 527 pA (n=6; Fig. 3r). Additionally, some cells were distinguished by the presence of a transient inward current, likely reflecting calcium channel activity (Supplemental Fig. 14k, l). By day 20 each BMP/SB-FGF/LDN aggregate contained 1,552.3 ± 83.1 Myo7a+ cells with typical hair cell morphology, in striking contrast to other conditions that yielded no Myo7a+ cells (~1–2% of all cells in the aggregate; n=12–16 aggregates per condition; Fig. 3s, t). We conclude from these data that the cytoarchitecture, cellular morphology, and functional characteristics observed in Myo7a/Sox2+ vesicles are identical to sensory epithelia in the inner ear.
Figure 3. Stem cell-derived otic vesicles generate functional inner ear hair cells.

a, b, Expression of Myo7a in the E9.5 otic vesicle (a; OtV) and day 14 vesicles (b). nb, neuroblasts. c-e, Myo7a/Sox2+ hair cells (hc) with underlying Sox2+ supporting cells (sc) on day 15 (c) and 16 (d, e). f-i, Whole-mount immunofluorescence for Myo7a and Sox2 (f) and 3D reconstruction (g-i) of a vesicle in a day 20 BMP/SB-FGF/LDN aggregate. j, Vesicles display the hallmarks of inner ear sensory epithelia. k-m, F-actin (F-act) labels cell-cell junctions on the luminal surface and stereocilia bundles. m, Acetylated-a-Tubulin (Tublin) labels kinocilium and the cuticular plate. n, Transmission electron micrograph of stereocilia bundles and kinocilium (arrow). o, Distribution of stereocilia and kinocilium heights on days 20 and 24 compared to adult mouse utricle, range indicated by gray boxes (n>100 cells; ± max/min). p, Representative hair cell following 1 min FM1-43FX incubation, fixation and staining for F-actin. q, Representative epithelium preparation (inset) and hair cell during electrophysiological recordings. r, Representative voltage-current responses recorded from hair cells. The voltage protocol is shown at the top. s, Day 20 aggregate with Myo7a/Sox2+ vesicles. epi, epidermis (dashed outline). t, Number of hair cells on day 20 (n=12–16; mean ± s.e.m.). Scale bars, 250 μm (f, s, q-inset), 50 μm (d, g, h), 25 μm (a-c, e, i, k, l), 10 μm (q), 5 μm (m, p), 250 nm (n).
There are four distinct populations of hair cells in the mammalian inner ear; type I/II vestibular and inner/outer cochlear hair cells. We wished to reveal which type of hair cells populated the stem cell-derived sensory epithelia in our culture. Previous studies have suggested that expression of Pax2 and Sox2 may distinguish vestibular from cochlear hair cells27,28. Additionally, expression of the calcium binding protein Calretinin and Sox2 uniquely label Type II vestibular hair cells, whereas calyceal innervation from sensory neurons identifies Type I vestibular hair cells (Fig. 4a)27,29,30. On day 20, nearly all stem cell-derived hair cells were Sox2/Pax2+ (n>250 hair cells; Figs. 3c–e, i, 4b). Moreover, every hair cell expressed Calretinin suggesting a uniform population of Type II vestibular hair cells (Fig. 4c, e). From a structural standpoint, we noted the presence of larger lumen vesicles (3.7 ± 0.3 per aggregate, defined as >50 μm long-axis diameter, n=15 aggregates) with regions of sensory (with hair cells) and non-sensory (without hair cells) epithelia identical in organization to a vestibular end organ (Fig. 4d–g and Supplementary Figs. 14b, h and 15). Intriguingly, we also observed discrete populations of Calretinin+ and Brn3a/TuJ1/Neurofilament+ neurons that extended processes toward the sensory epithelia (Fig. 4h and Supplementary Fig. 16a–d). We were surprised to find that, by day 16, hair cells exhibited punctate expression of CtBP2/RIBEYE co-localized with the post-synaptic and neuronal markers TuJ1, Synaptophysin, SNAP-25 and Rab3, indicating the formation of ribbon synapses with adjacent neurons (Fig. 4h–j and Supplementary Fig. 16e–j). Remarkably, the number of ribbon synapses increased over time in culture, suggesting a maturation process similar to inner ear hair cells (Fig. 4k and Supplementary Fig. 16h–j)30. Together, these results indicate that stem-cell derived vesicles in our culture represent immature vestibular end organs, specifically the utricle and/or saccule12,23,28.
Figure 4. Stem cell-derived sensory epithelia are comparable to immature vestibular end organs.

a, Schematic of vestibular end organs and type I/II vestibular hair cells. vgn, vestibular ganglion neurons. b, Pax2 and (c) Calretinin is expressed in all Myo7a+ stem cell-derived hair cells on day 20. CyclinD1 (cD1) is expressed in supporting cells. d-g, The structural organization of vesicles with Calretinin/Myo7a+ hair cells mimics the E18 mouse saccule (sagittal view) in vivo. nse, non-sensory epithelium. h, TuJ1+ neurons extending processes to hair cells. i, The synaptic protein SNAP-25 is localized to the basal end of hair cells. j, The post-synaptic marker synaptophysin (Synp) co-localizes with CtBP2/RIBEYE (arrowheads and inset). hcn, hair cell nucleus. k, Quantification of synapses on day 16, 20 and 24 hair cells (n>100 cells, *P<0.05, ***P<0.001; mean ± s.d.). l, Overview of in vitro differentiation. Scale bars, 50 μm (d, f, h), 25 μm (b, c, e, g), 10 μm (i), 5 μm (j).
In conclusion, our findings highlight a binary mechanism of BMP activation and TGFβ inhibition underlying in vitro non-neural ectoderm induction. Furthermore, subsequent inhibition of BMP signaling concomitant with activation of FGF signaling are required for pre-placodal induction. Remarkably, formation of these precursors is sufficient to trigger self-guided induction of the sensory epithelia, from which hair cells with structural and functional properties of native mechanosensitive hair cells in the inner ear spontaneously arise in significant numbers (~1,500 hair cells/aggregate; see Fig. 4l). This novel approach not only can be used as a potent model system to elucidate the mechanisms underlying inner ear development, but also will provide an easily accessible and reproducible means of generating hair cells for in vitro disease modeling, drug discovery or cellular therapy experiments.
Full Methods
Embryonic stem cell culture
Embryonic stem cells derived from blastocyst-stage embryos of R1 mice were maintained in feeder-free conditions using 2i-LIF Medium as previously described31. Briefly, ESCs were maintained on gelatin and used for experimentation until passage 40. N2B27 Medium consisted of a 1:1 mixture of Advanced DMEM/F12 and Neurobasal Medium (Invitrogen) supplemented with 1mM GlutaMax (Invitrogen) and 1 mM Penicillin/Streptomycin (STEMCELL Technologies). 2i-LIF Medium was made by supplementing N2B27 Medium with 1000 U/mL leukemia inhibitory factor (LIF; Millipore), 3 μM CHIR99021 (Stemgent) and 1 μM PD0325901 (Santa Cruz).
Day 0–3 of SFEBq differentiation was performed as described with slight modifications32. Briefly, ESCs were dissociated with 0.25% Trypsin-EDTA, resuspended in Differentiation Medium and plated 100 μl per well (3000 cells) on 96-well low-cell-adhesion U-bottom plates (Lipidure Coat, NOF). Differentiation Medium was G-MEM supplemented with 1.5% knockout serum replacement (KSR; Invitrogen), 0.1 mM non-essential amino acids, 1 mM sodium pyruvate, 1 mM Penicillin/Streptomycin and 1 mM 2-mercaptoethanol. On day 1, half of the medium in each well was exchanged for fresh Differentiation Medium containing Matrigel (2% v/v final concentration). On day 3 of the protocol, BMP4 (10 ng/mL) and SB-431542 (1 μM) were added to each well at 5X concentration in 25 μL of fresh media. On day 4–5, FGF2 (25 ng/mL) and LDN-193189 (100 nM) were added to each well at 6X concentration in 25 μL of fresh media. The concentration of Matrigel was maintained at 2% (v/v) throughout days 1–8. On day 8 of differentiation, cell aggregates were transferred to 24 well plates (Lipidure Coat, NOF; 4–8 aggregates per well) in N2 Medium containing 1% Matrigel (v/v). N2 Medium contained Advanced DMEM/F12, 1X N2 Supplement, 1mM Penicillin/Streptomycin or 50 μg/mL Normocin (Invivogen) and 1 mM GlutaMax. For some experiments small molecules were added to N2 Medium prior to plating the aggregates. Half of the medium was changed every day during long-term floating culture for up to 30 days.
Signaling molecules and recombinant proteins
The following small molecules and recombinant proteins were used: recombinant human BMP4 (10 ng/mL; Stemgent), human FGF2 (25 ng/mL; Peprotech), XAV939 (1 μM; Santa Cruz), SU5402 (10 μM; BioVision), SB-431542 (1 μM; Tocris Bioscience), and LDN-193189 (100 nM; Stemgent). Notably, we have obtained comparable results using concentrations of up to 1 μM LDN-193189.
Quantitative PCR
As previously described33, RNA was isolated using the RNeasy Minikit (Qiagen) and treated with TURBO DNase (Ambion). Single-stranded cDNA was synthesized using Omniscript reverse transcriptase (Qiagen) and Oligo-dT primers. All amplicons had standardized sizes of 100–110 bps. cDNA samples were amplified on an ABI PRISM 7900HT Sequence Detection System (Applied Biosystems) using the SYBR Green PCR Master Mix (Applied Biosystems). For each PCR reaction, a mixture containing cDNA template (5 ng), Master Mix, and forward and reverse primers (400 nM each) was treated with uracil N-glycosylase at 50°C for 2 min before undergoing the following program: 1 cycles, 95°C, 10 min; 45 cycles, 95°C, 15 sec, 60°C, 1 min; 1 cycles, 95°C, 15 sec, 60°C, 15 sec, 95°C, 15 sec; 72°C, hold. Melting curve analysis was performed to confirm the authenticity of the PCR product. The mRNA level for each gene was calculated relative to L27 mRNA expression.
Primers used: Dlx3, Forward-CAGTACGGAGCGTACCGGGA, Reverse-TGCCGTTCACCATGCGAACC; Sox1, Forward-AACCAGGATCGGGTCAAG, Reverse-ATCTCCGAGTTGTGCATCTT; brachyury, Forward-CACACGGCTGTGAGAGGTACCC, Reverse-TGTCCGCATAGGTTGGAGAGCTC; Reverse-GGGAAGGTGAAGAGATGAGG; Pax8, Forward- CGGCGATGCCTCACAACTCG, Reverse-TGGGCCAAGTCCACAATGCG; Pax2, Forward-CCCGTTGTGACCGGTCGTGATAT, Reverse-TGGGTTGCCTGAGAACTCGCTC.
Immunohistochemistry
Aggregates were fixed with 4% paraformaldehyde. The fixed specimens were cryoprotected with a graded treatment of 10, 20 and 30% sucrose and then embedded in tissue freezing medium. Frozen tissue blocks were sectioned into 10 or 12 μm cyrosections. For immunostaining, a 3% Goat or Horse Serum and 0.1% Triton-X100 solution was used for primary antibody incubation. An Alexa Fluor 488 conjugated anti-mouse IgG or anti-rat IgG and an Alexa Fluor 568 conjugated anti-rabbit IgG (Invitrogen) were used as secondary antibodies. A DAPI counterstain was used to visualize cellular nuclei (Vector, VectaShield). For whole-mount staining, aggregates were placed directly into blocking solution with 1% Triton-X100 following fixation. For confocal imaging and 3D reconstruction experiments, following secondary antibody incubation, aggregates were cleared using ScaleA2 solution for 1–2 days followed by ScaleB4 treatment for another 2 days as described previously34. Microscopy was performed on a Nikon TE2000 Inverted Microscope or an Olympus FV1000-MPE Confocal/Multiphoton Microscope. 3D reconstruction was performed using Voxx (custom software developed by Indiana Center for Biological Microscopy).
The following antibodies were used: anti-E-cadherin (rabbit, Abcam; mouse, BD Biosciences); anti-N-cadherin (mouse, BD Bioscience); anti-Sox1 (rabbit, Cell Signaling Technologies); anti-Nanog (rabbit, Abcam); anti-brachyury (goat, Santa Cruz Biotechnology); anti-AP2α (mouse, DHSB); anti-Pax8 (rabbit, Abcam); anti-Pax2 (rabbit, Invitrogen; mouse, Abnova); anti-Sox2 (mouse, BD Biosciences); anti-Jag1 (rabbit, LSBio); anti-p27kip1 (mouse, BD Biosciences); anti-myosinVIIa (rabbit, Proteus); anti-acetylated-α-Tubulin (mouse, Abcam); anti-TuJ1 (mouse, Covance); anti-Calretinin (mouse, Millipore); anti-Caspr1 (mouse, NeuroMAB); anti-Caspr2 (mouse, NeuroMAB); anti-p63 (mouse, Santa Cruz Biotechnology); anti-Cytokeratin-5 (rabbit, Sigma); anti-Neurofilament (rabbit, Millipore); anti-Brn3a (mouse, Millipore); anti-Islet1 (mouse, DSHB); anti-Synaptophysin (rabbit, Invitrogen); anti-Brn3c (mouse, Santa Cruz Biotechnology); anti-CtBP1 and anti-CtBP2 (mouse, BD Biosciences); anti-Rab3 (mouse, BD Biosciences); anti-SNAP25 (mouse, BD Biosciences); anti-Pax6 (rabbit, Abcam); anti-Pax3 (mouse, DSHB); anti-aPKC (rabbit, Santa Cruz Biotechnology); anti-laminin-B1 (rat, Abcam). For most antibodies, mouse embryonic tissue sections were used as positive controls. Mouse embryos were dissected from time pregnant ICR mice using a protocol approved by the Institutional Animal Care and Use Committee at Indiana University School of Medicine. The embryo fixation and processing procedure was identical to that used for cell aggregates.
The Alcian blue staining procedure was modified from a previously reported method35. Briefly, cyrosections were incubated in Alcian blue staining solution for 10 minutes and subsequently de-stained using 60% ethanol/40 % acetic acid for 20 minutes. A final eosin stain was performed for 30 seconds. For Oil Red O staining, cryosections were kept in 60% isopropanol for 2 minutes and then placed in freshly prepared Oil Red O stain for 5 minutes followed by a 30 second hematoxyline stain.
Image analysis
The percentage of epithelial cells expressing Pax8/Ecad was established by analyzing serial sections of day 6 and 8 aggregates. Data are representative of 6–8 aggregates from at least 3 separate experiments. For analysis of each aggregate, 5 cryosections were chosen at random positions along the z-axis of the aggregate. Using Nikon Elements or NIH ImageJ software, the Ecad+ outer-epithelium was outlined and cell counting of DAPI and Pax8+ nuclei along the length of the epithelium established a percentage for each cryosection.
The apparent thickness of epithelia was determined by analyzing cryosections stained with Ncad (Control) or Ecad (all other conditions) on days 3–6. Data are representative of 6–8 aggregates from at least 3 separate experiments. For each aggregate, 3 serial sections were analyzed. Five points along the epithelium were randomly chosen and the thickness was measured using Nikon Elements image analysis tools.
Similarly, the number of Myo7a+ hair cells in each day 20 aggregate was determined by analyzing 10 μm serial cryosections. Each biological sample represents the average number of hair cells counted in 4–6 cell aggregates and data are representative of the average from 3 separate experiments (15 aggregates total for each condition). Odd and even numbered cryosections were analyzed separately and averaged to avoid double counting. The number of vesicles was quantified similarly, but every 3rd section was analyzed to avoid double counting and allow for analysis of 3 separate staining combinations. Vesicles with a long axis diameter larger than 30 μm were accounted for to avoid double counting.
Stereocilia heights were determined by measuring the apparent length of F-actin labeled structures protruding from Myo7a+ hair cells on day 20 and 24. Likewise, kinocilium heights were determined by measuring the apparent length of acetylated-a-Tubulin labeled protrusions from Myo7a+ hair cells. Regions of interest were chosen randomly for analysis and >100 cells were analyzed across 3–5 separate epithelia for the data shown in Figure 3.
Synapses were quantified by analyzing day 16, 20 and 24 aggregate sections stained for synaptophysin and CtBP2/Ribeye using a previously described method36. Regions of interest were chosen randomly for analysis and >100 cells were analyzed across 4–5 separate epithelia from 3 separate experiments for the data shown in Figure 3. Confocal z-stacks were taken of CtBP2 stained hair cells. The max-intensity projections were used to count the number of CtBP2+ puncta surrounding each hair cell nuclei.
Statistical analysis
Statistical significance was determined using a Student’s t-test for comparison of two groups or a One-Way ANOVA followed by Tukey’s post-hoc test for multiple comparisons, unless stated otherwise. All data were analyzed using Prism 6 or Microsoft Excel software.
FM1-43 labeling
The presence of functional mechanosensitive channels was confirmed using a FM1-43 dye uptake assay similar to previous studies25,37,38. Large lumen aggregates (i.e. >500 μm long-axis diameter), identified by their translucency and spherical morphology relative to surrounding tissue, were used for these experiments. Aggregates were incubated in DMEM-F12 containing FM1-43FX (5 μM; Invitrogen) for 1 minute and then washed 3X in fresh N2 Medium. A faint cellular outline caused by autofluorescence was used to identify potential hair cells in the vesicle wall. In N2 Medium, a 0.25 μm tungsten needle was used to puncture each vesicle in an area away from the site of potential hair cells. The punctured vesicles were incubated in DMEM-F12 containing FM1-43FX (5 μM) for 1 minute with gentle rocking and then washed 3X in fresh N2 Medium. Vesicles were imaged to confirm dye uptake and immediately fixed with 4% paraformaldehyde. For some experiments, epithelia were fixed and incubated in PBS containing 1% Triton-X100 and phalloidin conjugated to Alexa Fluor 647 (Invitrogen) to confirm the identity of hair cells.
Electrophysiological recordings
On day 24 of differentiation, large lumen vesicles (>500 μm diameter) were dissected from cell aggregates following a 30-minute incubation in DMEM/F12 containing Dispase (STEMCELL Technologies). Epithelial regions containing hair cells were identified based on a thickened morphology relative to the rest of the vesicle epithelium. Two incisions were made using tungsten needles on the opposite side of the vesicle in order to expose and flatten the hair cell-containing epithelium. The flattened epithelium was mounted onto round glass coverslip and held in position by two wires glued to the coverslip using MDX4-4210 (Corning). The coverslip was then placed in a submersion-type slice chamber mounted on the stage of a Nikon E600FN Eclipse microscope. Electrophysiological recordings were performed under continuous perfusion of oxygenated artificial cerebrospinal fluid (ACSF) that contained the following (in mM): 130 NaCl, 3.5 KCl, 1.1 KH2PO4, 1.3 MgCl2, 2.5 CaCl2, 30 NaHCO3, 10 glucose, pH 7.4 (320 mOsm/kg). Recording pipettes were pulled from borosilicate capillary glass (WPI) with resistances ranging from 2 to 3 MΩ. Recording pipettes were filled with a potassium gluconate based recording solution that contained the following (in mM): 130 K-Gluconate, 3 KCl, 3 MgCl2, 5 phosphocreatine, 2 K-ATP, 0.2 NaGTP, 10 HEPES, pH 7.3, 290 mOsm/kg. Whole-cell access resistances were monitored throughout each experiment and ranged from 5–20 MΩ; a change of 15% was deemed acceptable.
Hair cells were identified with a 40X water-immersion objective and differential interference contrast (DIC). Only cells with hair bundles on their apical surface were chosen for recording. Positive pressure was maintained as the recording pipette was lowered into the epithelium. When the recording pipette touched the membrane, positive pressure was released and tight seal was formed. Recordings were obtained at 30°C using solution inline heater (Warner Instruments). The cells were held at -60 mV, and data were acquired using whole-cell technique in voltage-clamp mode using a Multiclamp 700B amplifier (Molecular Devices) coupled to a Digidata 1332A board (Molecular Devices). The data were analyzed using the pClamp 10.2 (Molecular Devices). All chemicals were purchased from Sigma-Aldrich.
Transmission electron microscopy
Day 24 aggregates were fixed in 2% Paraformaldehyde/2%Glutaraldehyde in 0.1M phosphate buffer. After fixation the specimens were rinsed with phosphate buffered saline (PBS) followed by post-fixation with 1% osmium tetroxide. Thereafter, the aggregates were dehydrated through a series of graded ethyl alcohols and embedded in Embed 812 (Electron Microscopy Sciences). Ultra-thin sections (70–80 nm) were cut, stained with uranyl acetate and viewed on a Tecnai BioTwin (FEI) transmission electron microscope at 80 kV. Digital images were taken with an Advanced Microscope Techniques CCD camera.
Western blot analysis
Cell aggregates were lysed in RIPA buffer supplemented with a protease inhibitor cocktail (Roche). Cell extracts were centrifuged at 13,000 rpm, 4°C for 10 minutes to remove insoluble debris and chromosomal DNA. Proteins were separated by denaturing poly acrylamide gel electrophoresis (SDS-PAGE) and transferred to PVDF membranes (Biorad). After blocking, membranes were incubated with a primary antibody overnight at 4°C. An anti-βactin (Sigma) antibody was used for confirmation of equal loading of the samples. Blots were detected with an HRP-conjugated goat anti–rabbit or rabbit anti–mouse antibody (Invitrogen) and visualized with the SuperSignal West Pico or -Femto chemiluminescent detection system (Pierce) and exposed to x-ray film.
Supplementary Material
Acknowledgments
The authors would like to thank G. Oxford for contributing unpublished data and discussion; E. Beans, G. Kamocka, K. Dunn and C. Miller for technical assistance; P. Dolle, R. Romand, J. Williams, J. Meyer, X. Zhang and T. Cummins for comments and discussion; E. Tobin, R. Meadows, J. Hamilton, S. Majumdar and G. Wagner for editorial assistance. This work was supported by National Institutes of Health (NIH) grants RC1DC010706 and R01GM086544. K.R.K. was supported by a Paul and Carole Stark Neurosciences Fellowship and an Indiana Clinical and Translational Science Institute Predoctoral Fellowship (NIH TL1RR025759). A.I.M. was supported by NIH R01MH52619 (awarded to A. Shekhar).
Footnotes
Full Methods and any associated references are available in the online version of the paper at www.nature.com/nature.
Supplementary Information is linked to the online version of the paper at www.nature.com/nature.
Reprints and permissions information is available at www.nature.com/reprints.
The authors declare no competing financial interests.
Readers are welcome to comment on the online version of the article at www.nature.com/nature.
Authors’ Contributions
K.R.K. conceived and designed the study, preformed experiments, analyzed data, made figures and wrote the manuscript. A.M.M. and D.P. performed experiments and analyzed data. A.I.M. generated electrophysiological data. E.H. helped design the study, provided financial support, monitored the experiments and wrote the manuscript. All authors read and approved the final manuscript.
References
- 1.Bermingham-McDonogh O, Reh TA. Regulated reprogramming in the regeneration of rensory receptor cells. Neuron. 2011;71:389–405. doi: 10.1016/j.neuron.2011.07.015. [DOI] [PMC free article] [PubMed] [Google Scholar]
- 2.Brigande JV, Heller S. Quo vadis, hair cell regeneration? Nat Neurosci. 2009;12:679–685. doi: 10.1038/nn.2311. [DOI] [PMC free article] [PubMed] [Google Scholar]
- 3.Ouji Y, Ishizaka S, Nakamura-Uchiyama F, Yoshikawa M. In vitro differentiation of mouse embryonic stem cells into inner ear hair cell-like cells using stromal cell conditioned medium. Cell Death Dis. 2012;3:e314. doi: 10.1038/cddis.2012.56. [DOI] [PMC free article] [PubMed] [Google Scholar]
- 4.Oshima K, et al. Mechanosensitive hair cell-like cells from embryonic and induced pluripotent stem cells. Cell. 2010;141:704–716. doi: 10.1016/j.cell.2010.03.035. [DOI] [PMC free article] [PubMed] [Google Scholar]
- 5.Kondo T, et al. Tlx3 exerts context-dependent transcriptional regulation and promotes neuronal differentiation from embryonic stem cells. Proc Natl Acad Sci USA. 2008;105:5780–5785. doi: 10.1073/pnas.0708704105. [DOI] [PMC free article] [PubMed] [Google Scholar]
- 6.Reyes JH, et al. Glutamatergic neuronal differentiation of mouse embryonic stem cells after transient expression of neurogenin 1 and treatment with BDNF and GDNF: in vitro and in vivo studies. J Neurosci. 2008;28:12622–12631. doi: 10.1523/JNEUROSCI.0563-08.2008. [DOI] [PMC free article] [PubMed] [Google Scholar]
- 7.Chen W, et al. Restoration of auditory evoked responses by human ES-cell-derived otic progenitors. Nature. 2012;490:278–282. doi: 10.1038/nature11415. [DOI] [PMC free article] [PubMed] [Google Scholar]
- 8.Schlosser G. Induction and specification of cranial placodes. Dev Biol. 2006;294:303–351. doi: 10.1016/j.ydbio.2006.03.009. [DOI] [PubMed] [Google Scholar]
- 9.Pieper M, Ahrens K, Rink E, Peter A, Schlosser G. Differential distribution of competence for panplacodal and neural crest induction to non-neural and neural ectoderm. Development. 2012;139:1175–1187. doi: 10.1242/dev.074468. [DOI] [PubMed] [Google Scholar]
- 10.Groves AK, Fekete DM. Shaping sound in space: the regulation of inner ear patterning. Development. 2011;139:245–257. doi: 10.1242/dev.067074. [DOI] [PMC free article] [PubMed] [Google Scholar]
- 11.Grocott T, Tambalo M, Streit A. The peripheral sensory nervous system in the vertebrate head: A gene regulatory perspective. Dev Biol. 2012;370:3–23. doi: 10.1016/j.ydbio.2012.06.028. [DOI] [PubMed] [Google Scholar]
- 12.Eiraku M, et al. Self-organizing optic-cup morphogenesis in three-dimensional culture. Nature. 2011;472:51–56. doi: 10.1038/nature09941. [DOI] [PubMed] [Google Scholar]
- 13.Suga H, et al. Self-formation of functional adenohypophysis in three-dimensional culture. Nature. 2011;480:57–62. doi: 10.1038/nature10637. [DOI] [PubMed] [Google Scholar]
- 14.Eiraku M, et al. Self-organized formation of polarized cortical tissues from ESCs and its active manipulation by extrinsic signals. Cell Stem Cell. 2008;3:519–532. doi: 10.1016/j.stem.2008.09.002. [DOI] [PubMed] [Google Scholar]
- 15.Nakano T, et al. Self-formation of optic cups and storable stratified neural retina from human ESCs. Cell Stem Cell. 2012;10:771–785. doi: 10.1016/j.stem.2012.05.009. [DOI] [PubMed] [Google Scholar]
- 16.Kamiya D, et al. Intrinsic transition of embryonic stem-cell differentiation into neural progenitors. Nature. 2011;470:503–509. doi: 10.1038/nature09726. [DOI] [PubMed] [Google Scholar]
- 17.Wilson PA, Hemmati-Brivanlou A. Induction of epidermis and inhibition of neural fate by Bmp-4. Nature. 1995;376:331–333. doi: 10.1038/376331a0. [DOI] [PubMed] [Google Scholar]
- 18.Bernardo AS, et al. BRACHYURY and CDX2 mediate BMP-induced differentiation of human and mouse pluripotent stem cells into embryonic and extraembryonic lineages. Cell Stem Cell. 2011;9:144–155. doi: 10.1016/j.stem.2011.06.015. [DOI] [PMC free article] [PubMed] [Google Scholar]
- 19.Chambers SM, et al. Highly efficient neural conversion of human ES and iPS cells by dual inhibition of SMAD signaling. Nat Biotechnol. 2009;27:275–280. doi: 10.1038/nbt.1529. [DOI] [PMC free article] [PubMed] [Google Scholar]
- 20.Kwon H-J, Bhat N, Sweet EM, Cornell RA, Riley BB. Identification of early requirements for preplacodal ectoderm and sensory organ development. PLoS Genet. 2010;6 doi: 10.1371/journal.pgen.1001133. [DOI] [PMC free article] [PubMed] [Google Scholar]
- 21.Kwon HJ, Riley BB. Mesendodermal signals required for otic induction: Bmp-antagonists cooperate with Fgf and can facilitate formation of ectopic otic tissue. Dev Dyn. 2009;238:1582–1594. doi: 10.1002/dvdy.21955. [DOI] [PMC free article] [PubMed] [Google Scholar]
- 22.Ladher RK, O’Neill P, Begbie J. From shared lineage to distinct functions: the development of the inner ear and epibranchial placodes. Development. 2010;137:1777–1785. doi: 10.1242/dev.040055. [DOI] [PubMed] [Google Scholar]
- 23.Laine H, Sulg M, Kirjavainen A, Pirvola U. Cell cycle regulation in the inner ear sensory epithelia: role of cyclin D1 and cyclin-dependent kinase inhibitors. Dev Biol. 2010;337:134–146. doi: 10.1016/j.ydbio.2009.10.027. [DOI] [PubMed] [Google Scholar]
- 24.Li A, Xue J, Peterson EH. Architecture of the mouse utricle: macular organization and hair bundle heights. J Neurophysiol. 2008;99:718–733. doi: 10.1152/jn.00831.2007. [DOI] [PubMed] [Google Scholar]
- 25.Meyers JR, et al. Lighting up the senses: FM1-43 loading of sensory cells through nonselective ion channels. Journal of Neuroscience. 2003;23:4054–4065. doi: 10.1523/JNEUROSCI.23-10-04054.2003. [DOI] [PMC free article] [PubMed] [Google Scholar]
- 26.Géléoc GSG, Risner JR, Holt JR. Developmental acquisition of voltage-dependent conductances and sensory signaling in hair cells of the embryonic mouse inner ear. Journal of Neuroscience. 2004;24:11148–11159. doi: 10.1523/JNEUROSCI.2662-04.2004. [DOI] [PMC free article] [PubMed] [Google Scholar]
- 27.Oesterle EC, Campbell S, Taylor RR, Forge A, Hume CR. Sox2 and Jagged1 expression in normal and drug-damaged adult mouse inner ear. J Assoc Res Otolaryngol. 2007;9:65–89. doi: 10.1007/s10162-007-0106-7. [DOI] [PMC free article] [PubMed] [Google Scholar]
- 28.Warchol ME, Richardson GP. Expression of the Pax2 transcription factor is associated with vestibular phenotype in the avian inner ear. Dev Neurobiol. 2009;69:191–202. doi: 10.1002/dneu.20684. [DOI] [PMC free article] [PubMed] [Google Scholar]
- 29.Desai SS, Zeh C, Lysakowski A. Comparative morphology of rodent vestibular periphery. I. Saccular and utricular maculae. J Neurophysiol. 2005;93:251–266. doi: 10.1152/jn.00746.2003. [DOI] [PubMed] [Google Scholar]
- 30.Lysakowski A, et al. Molecular microdomains in a sensory terminal, the vestibular calyx ending. Journal of Neuroscience. 2011;31:10101–10114. doi: 10.1523/JNEUROSCI.0521-11.2011. [DOI] [PMC free article] [PubMed] [Google Scholar]
- 31.Ying QL, et al. The ground state of embryonic stem cell self-renewal. Nature. 2008;453:519. doi: 10.1038/nature06968. [DOI] [PMC free article] [PubMed] [Google Scholar]
- 32.Eiraku M, Sasai Y. Mouse embryonic stem cell culture for generation of three-dimensional retinal and cortical tissues. Nat Protoc. 2012;7:69–79. doi: 10.1038/nprot.2011.429. [DOI] [PubMed] [Google Scholar]
- 33.Koehler KR, et al. Extended passaging increases the efficiency of neural differentiation from induced pluripotent stem cells. BMC Neurosci. 2011;12:82. doi: 10.1186/1471-2202-12-82. [DOI] [PMC free article] [PubMed] [Google Scholar]
- 34.Hama H, et al. Scale: a chemical approach for fluorescence imaging and reconstruction of transparent mouse brain. Nat Neurosci. 2011;14:1481–1488. doi: 10.1038/nn.2928. [DOI] [PubMed] [Google Scholar]
- 35.Jegalian BG, De Robertis EM. Homeotic transformations in the mouse induced by overexpression of a human Hox3.3 transgene. Cell. 1992;71:901–910. doi: 10.1016/0092-8674(92)90387-r. [DOI] [PubMed] [Google Scholar]
- 36.Coate TM, et al. Otic Mesenchyme cells regulate spiral ganglion axon fasciculation through a Pou3f4/EphA4 signaling pathway. Neuron. 2012;73:49–63. doi: 10.1016/j.neuron.2011.10.029. [DOI] [PMC free article] [PubMed] [Google Scholar]
- 37.Gale JE, Marcotti W, Kennedy HJ, Kros CJ, Richardson GP. FM1-43 dye behaves as a permeant blocker of the hair-cell mechanotransducer channel. Journal of Neuroscience. 2001;21:7013–7025. doi: 10.1523/JNEUROSCI.21-18-07013.2001. [DOI] [PMC free article] [PubMed] [Google Scholar]
- 38.Hu Z, Corwin JT. Inner ear hair cells produced in vitro by a mesenchymal-to-epithelial transition. [DOI] [PMC free article] [PubMed] [Google Scholar]
Associated Data
This section collects any data citations, data availability statements, or supplementary materials included in this article.