

Abstract
The rapidly rising prevalence and cost of Alzheimer’s disease (AD) in recent decades has made the imaging of amyloid-β (Aβ) deposits the focus of intense research. Several amyloid imaging probes with purported specificity for Aβ plaques are currently at various stages of FDA approval. However, a number of factors appear to preclude these probes from clinical utilization. As the available “amyloid specific” PET imaging probes have failed to demonstrate diagnostic value and have shown limited utility for monitoring therapeutic interventions in humans, a debate on their significance has emerged. The aim of this review is to identify and discuss critically the scientific issues contributing to the extensive inconsistencies reported in the literature on their purported in vivo amyloid specificity and potential utilization in patients.
Keywords: amyloid imaging, amyloid ‘specific’ imaging probes, Amyvid, PIB, critical review, neuropathologic criteria, silent medial temporal lobe
(I) Introduction
The rapidly increasing incidence of Alzheimer’s disease that has accompanied upward trends in life expectancy across the developed world has imposed serious medical, social, and financial burdens that only stand to grow more onerous in the years to come. It is for this reason that the development of biomarkers—PET imaging in particular—for the understanding, diagnosis, and monitoring of various therapeutic approaches to control the progression of AD is a widely accepted need. A great deal of interest has been given to a class of PET biomarkers targeting the amyloid-β (Aβ) peptide, which has been proposed as the root cause of AD. This “amyloid hypothesis” has been a central assumption of research in this field for decades and has underpinned much of the research on the diagnosis and treatment of AD [1]. However, the recent failures of several anti-amyloid therapies in the late stages of clinical testing have raised questions about the utility of measuring Aβ plaque as a biomarker of disease progression in patients with substantial clinical impairment. These developments, when combined with the inconsistent data and unexplained anomalies reported in amyloid-PET imaging studies, call for a critical examination of the modality. This review aims to address some of these vital questions regarding Aβ probesby analyzing documented discrepancies between pathological findings, clinical diagnoses, and amyloid imaging observationsand examining the essential attributes of PET probes for tissue-specific molecular imaging.
(II) Amyloid Imaging in the Clinical Setting
On April 6, 2012, the Food and Drug Administration (FDA) approved the clinical use of the Aβ imaging probe Amyvid (Florbetapir F-18 Injection) for the evaluation of patients suspected of having AD. This marks the first time a PET biomarker has been approved since 2003, when FDG, sodium [18F]fluoride, and [13N]ammonia were “grandfathered in” based on literature review. Although the approval of [18F]florbetapir can certainly be considered a regulatory breakthrough from this perspective, it has also raised a number of valid questions and caveats regarding its possible uses and potential pitfalls in the clinical setting. The Alzheimer’s Association, in a statement released after the approval of [18F]florbetapir, expressed concern (http://www.alz.org/news_and_events_approval-of-florbetapir.asp) by calling [18F]florbetapir’s approval a double-edged sword, citing fears that unscrupulous operators would make “unrealistic promises” on the value of the tracer when offering imaging services.
This uneasiness is rooted in the severe limitations imposed by the FDA on [18F]florbetapir, the clinical utilization of which has been strictly limited to “ruling out AD.” The explicit exclusion of the more significant applications of “predicting [the] development of dementia” and “monitoring response to therapies” from the FDA’s list of approved indications signifies that [18F]florbetapir scans cannot be used at this time to establish a positive diagnosis of AD or even suggest the likelihood of onset, nor can they be used to validate anti-amyloid pharmaceuticals. These restrictions run counter to claims that “the functionality, sensitivity, and specificity of Aβ-plaque imaging agents,” which have been designed “to detect Aβ pathology…before the onset of clinically significant cognitive symptoms,” are sufficient for clinical use [2]. In reference to the Aβ imaging agent [N-methyl-11C]2-(4′-methylaminophenyl)-6-hydroxybenzothiazole (Pittsburgh compound B or [11C]PiB), it was stated that the probe is “very suitable in the early diagnosis of AD and can be used for the detection of pathological changes before there is a significant loss in cognitive function.” Such claims have frequently been repeated in the literature, which begs the question of why [18F]florbetapir, the first Aβ imaging probe to be reviewed by the FDA, was at first conditionally endorsed and subsequently approved with such stringent limits on its utilization.
Figure 1 (adapted from Figure 2 from Fleisher et al. [3]), may give an indication as to why the FDA did not approve the use of [18F]florbetapir as a diagnostic tool for AD. The scatter plot presents scan results performed with the subject population likely to receive [18F]florbetapir scans for their clinical assessment: older adults free of dementia (OHC; N=82), subjects with mild cognitive impairment (MCI; N=68) and possible AD patients (PAD; N=60) (as compared with younger adults (YNC)). As seen from the reported results, the vast majority of the subjects at all levels of cognitive impairment will fall within a range of cortical standardized uptake value ratios (SUVR) between 0.80 and 1.50, with the cerebellum—which generally lacks Aβ aggregates of the type to which [18F]florbetapir is expected to bind—established as the reference tissue.
Fig. 1.
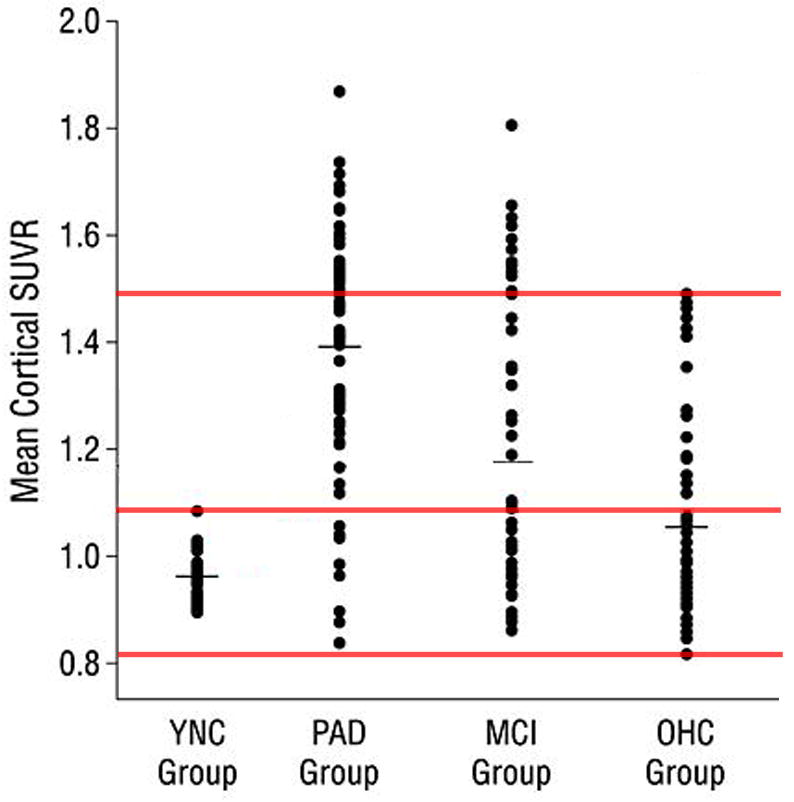
[18F]Florbetapir mean cortical SUVRs of subjects with probable AD (PAD) and mild cognitive impairment (MCI), as compared to older healthy controls (OHC) and young adults (YNC). The top and bottom red lines demarcate the SUVR range that most subjects fall into, regardless of their clinical diagnosis, while the middle line demarcates the highest SUVR values observed in young adults (YNC). Note the significant overlap among the groups. (From Fleisher et al. [3]; with permission)
Fig. 2.

Correlation between SUVRs of [18F]flutemetamol and [11C]PiB in the cortical region (A), lateral frontal region (B), striatum (C), and subcortical white matter (D) of AD patients (solid diamonds) and MCI patients (empty squares). (From Vandenberghe et al. [45]; with permission)
These results from Fleisher et al. [3] indicate that [18F]florbetapir would be of limited clinical value for physicians intending to acquire diagnostic information on individual patients. The substantial overlap of SUVRs across elderly subjects at all levels of cognitive function (Figure 1) implies that an individual patient whose SUVR in [18F]florbetapir PET scan falls between 0.8 and 1.5 cannot be clinically classified within any of the aforementioned groups (OHC, MCI, or PAD) based solely on these results. Furthermore, the data displayed in Figure 1 also support the view that the lone indication that the FDA approved for [18F]florbetapir—ruling out AD with a negative PET scan—may also have severe limitations, as “amyloid-negative” scans would be found in all three major patient groups.
The possible reasons for this extensive overlap between dementia indications and controls (Figure 1) can be categorized as either (i) biological or (ii) technical (i.e., methodological) in nature.
(i) Biological
It may be that one of the neuropathological pathognomonic elements of AD, Aβ aggregation, does not correlate well with symptomatology. Once the disease process is underway, it is apparent that there are a number of factors, including the accumulation of amyloid plaques, that govern a patient’s symptoms. However, it is less clear which of these factors are responsible for the initiation of AD [4]. The belief that Aβ commences the cascade of neurodegeneration (i.e., the amyloid hypothesis) [1] has most recently led to the conclusion that soluble Aβ oligomers are the form of amyloid that prove deleterious to neurons [5]. An alternative hypothesis suggests that intracellular toxic products (TP) of amyloid precursor protein (APP) processing create neuronal dysfunction and degeneration [6]. But in either case, a linear relationship between Aβ oligomers, internal toxic products, and extracellular amyloid plaque, which are purportedly detectable by current Aβ imaging methods, would not necessarily follow.
(ii) Technical
Another possibility is that amyloid plaque density may be a useful measure for diagnosis, but imaging with [18F]florbetapir and other current “amyloid-specific tracers” may not be able to provide an accurate measure of Aβ.
(III) Aβ Imaging and Neuropathological Criteria for AD Diagnosis
The diagnostic utility of PET amyloid imaging, which has been claimed to have outstanding specificity for Aβ, appears closely connected to the validity of the amyloid hypothesis [1]. This hypothesis, which proposes that amyloid in its various forms—namely oligomers, fibrils, and neuritic plaques—are etiologically involved in AD has been widely held in the field for a number of decades, but has recently been challenged. Questions regarding the theoretical basis of PET amyloid imaging [7] were met with strenuous objections; advocates of the modality rejected the notion that the uncertainty of the amyloid hypothesis posed a potentially serious limitation, as the hypothesis was “not highly relevant to the feasibility and validity of Aβ imaging” [2].
However, for the intended indication of predicting the development of AD to be viable, the assumption must be made that Aβ is linked to the disease’s clinical symptoms. The same is true for the development of anti-amyloid therapies that amyloid imaging probes have been designed to validate [8, 9]. This assumption has been the subject of increasing scrutiny, especially in light of the recent failures of prominent anti-amyloid pharmaceuticals and the adverse effects observed with anti-amyloid vaccines [10] and the γ-secretase inhibitor Avagacestat [11, 12]. It has even been suggested on the basis of these developments that widespread amyloid deposition in the brain is unrelated to clinical symptoms [13].
The diagnostic value of current amyloid-PET imaging probes is also challenged by the established Consortium to Establish a Registry for Alzheimer’s Disease (CERAD) criteria for a neuropathological diagnosis of AD (National Institutes of Aging-Alzheimer’s Association (NIA-AA)), which entails a complex regional localization of tau and Aβ neuroaggregates rather than the mere presence of a widely-distributed amyloid burden [14, 15]. More specifically, it requires an “ABC” score for AD neuropathologic change that incorporates:
histopathologic assessments of β-amyloidosis in the medial temporal lobe structures, as described by Thal et al. [16, 17];
staging of neurofibrillary tangles (Braak tau pathology stages)[18]; and
scoring of neuritic plaques (based on semi-quantitative determination of senile plaque densities (sparse, moderate, frequent) in at least five neocortical regions, which must include the middle frontal gyrus, superior and middle temporal gyri, inferior parietal lobule, hippocampus, entorhinal cortex, and amygdala) [19].
In its current state, amyloid-PET imaging can only fulfill criterion (C); the available amyloid imaging agents fail to meet criteria (A) and (B), as they are silent in the medial temporal lobe and insensitive to tau deposition [2]. For this reason alone, current Aβ imaging technology is not suitable as a stand-alone method of diagnosis for AD. Although this caveat has been stated repeatedly in the literature, there is a common misconception—often seen in the portrayal of these probes in the media—that amyloid imaging offers a path to diagnosis.
(IV) Properties of the Aβ Imaging Probe [18F]Florbetapir
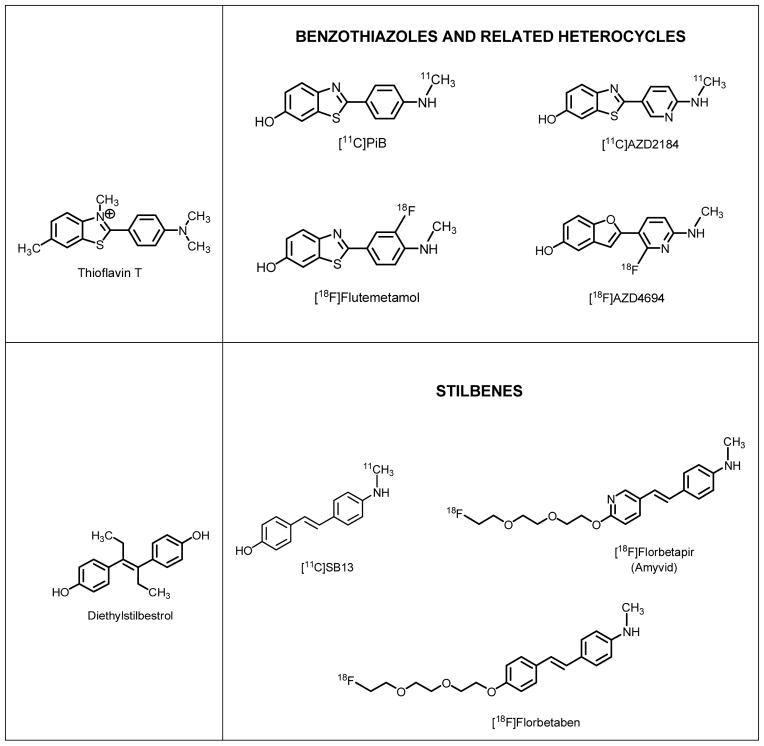
[18F]Florbetapir is classified as a member of the trans-stilbene family and a ring isostere of the Thioflavin-T family of imaging probes (Table 1). Three fundamental observations from the literature need to be highlighted with regard to the development and utilization of this imaging probe:
Table 1.
The Molecular Structures of Amyloid Imaging Probes
|
-
Although reports of their purported aggregate specificity in in vitro experiments are abundant in the literature, the trans-stilbene derivatives [18F]florbetapir and [18F]florbetaben (Table 1) lack data on in vivo Aβ specificity. Assuming in vivo neuroaggregate Aβ target specificity based solely on in vitro determinations in brain specimens is not appropriate in this case, for at least two fundamental reasons:
in vitro assay conditions generally used for binding determinations do not resemble in vivo conditions; and (b) these experiments are frequently performed in the presence of solvents (e.g., 10% ethanol) [20] and under conditions that are optimized for neuroaggregate binding and for the chemical properties of the tested imaging probe. These experimental conditions are not optimal for the localization of other possible tissue targets (e.g., enzyme-mediated probe transformations), which would necessitate a different set of conditions for their detection and quantification.
As shown by the parallels in their structural backbones, [18F]florbetapir has a close connection with estradiol and potent estrogen analogs (e.g., diethylstilbestrol) (Table 1). However, in spite of these structural similarities with estrogens, no significant reports exist in the scientific literature describing the possibility of any in vivo interaction of the trans-stilbene [18F]florbetapir—or its congener Aβ imaging probe [18F]florbetaben—with estrogen tissue targets, including estrogen receptors and estrogen-related enzymes. This in vivo interaction would be expected because trans-stilbene derivatives bind to estrogen receptors with high affinities [21] and have been known for many decades to have agonistic and antagonistic estrogen effects in vivo. Due to this possibility, [18F]florbetapir’s in vitro and in vivo interactions with estrogen-related targets in the brain are to be expected, and these tissue interactions are likely to influence the in vivo tissue specificity of [18F]florbetapir and—by extension—limit the ability to accurately quantify Aβ plaque loads using this modality.
It has been reported in the literature that [18F]florbetapir is rapidly metabolized peripherally in rodents: the plasma half-life has been shown to be 6 minutes in mice and 11 minutes in rats. Merely 2 minutes after the intravenous injection of [18F]florbetapir, only 56% of the activity in the brain was found to be attributable to the parent molecule, meaning that metabolites account for the remaining 44% [22]. The pharmacokinetic properties of this compound were established in rat plasma, while the identities of its metabolites found in liver microsomes were established by high performance liquid chromatography and mass spectrometry.
The brain penetrability of [18F]florbetapir’s peripheral metabolites was confirmed independently by investigators of Avid Pharmaceuticals. In this study [23], at least two of the [18F]florbetapir metabolites identified were shown to have good blood-brain barrier (BBB) penetrability in the mouse brain. In vivo radiodefluorination was also reported to have been observed with both [18F]florbetapir and the closely related probe [18F]florbetaben [24].
Considering the labile nature of pegylated–O-substitution and the reactivity of trans-stilbenes with metabolic enzymes, the possibility that stilbene molecules such as [18F]florbetapir and [18F]florbetaben are metabolized in vivo is not altogether surprising. However, the implications of metabolite activity in the brain being as high as 44% only 2 minutes after the injection of [18F]florbetapir are stark and unsettling. Considering the high peripheral metabolic rate reported in rodents and the high BBB penetrability of these metabolites, it is reasonable to assume that the percent brain accumulation of metabolites would increase to even greater levels over time. At 40 to 60 minutes—the time frame when Logan analysis for quantification (e.g., distribution volume ratio (DVR)) is made [25]—only a small percentage of the activity observed in all regions of the brain PET scan would be from the parent molecules (i.e., [18F]florbetapir or [18F]florbetaben), effectively eliminating any possibility of accurately estimating Aβ loads.
Limited BBB transport of metabolites would be acceptable as long as their transport is accounted for in a tracer kinetic model for quantification, but the magnitude of the reported peripheral metabolism for [18F]florbetapir and [18F]florbetaben makes it highly unlikely that this would be the case. It is to be expected that metabolism translation from rodents to primates would favor higher probe stability in humans, but the quantitative nature of this critical information has not been presented.
The rapidly increasing concentrations of brain metabolites of [18F]florbetapir and [18F]florbetaben, which produce high background signal and hinder signal specificity for Aβ aggregates, could be one of the reasons leading to the difficulties in reading [18F]florbetapir scans. It is therefore a likely contributor to the inter-reader variability [26] that necessitated the development of a special training program and stimulated the commercialization of specially designed software to facilitate brain scan reading with this amyloid probe. For these reasons, a discussion of the significance and possible implications of the presence of these metabolites on the quantification of Aβ plaque loads is crucial, especially since transport of peripheral metabolites to the brain is one of the most basic considerations in the design and utilization of optimal PET imaging probes [27].
(V) A Second Family of Aβ Imaging Probes: Uncharged Derivatives of Thioflavin-T (ThT)
Table 1 illustrates another family of Aβ imaging probes in addition to the trans-stilbene derivatives represented by [18F]florbetapir and [18F]florbetaben: the uncharged derivatives of the histological dye Thioflavin-T (ThT) [28]. A comparison of these two families of compounds as Aβ imaging probes can be made using an abundance of peer-reviewed studies in the literature.
[11C]PiB, which is an uncharged thioflavin analog, was the first reported Aβ-specific imaging probe—that is, the first probe to bind exclusively to Aβ aggregates instead of tau or prion fibrils, among other β-sheet-containing amyloid aggregates [29]. Even though the binding of [11C]PiB and other uncharged 6-hydroxy derivatives of thioflavins (e.g., [18F]flutemetamol) was reported to be Aβ-specific (Table 1), the charged ThT dye that they are derived from is known to target β-sheet conformations present in multiple neuroaggregates (e.g., Aβ, tau, prions, etc.). No specific molecular data exist in the literature, however, to suggest that the binding properties of these uncharged 6-hydroxybenzothiazole derivatives (i.e., [11C]PiB and related molecules) would differ from those of ThT. Furthermore, no explanation can be found in the literature as to why they would be specific for Aβ fibrils or to which fibril site they would bind that is not present in the other neuroaggregates.
The claim of specificity on the part of these probes was mainly based on in vitro determinations of tissue specimens, as no evidence of in vivo specificity is available [2]. Trans-stilbenes derivatives such as [18F]florbetapir were consequently presumed to be Aβ-specific probes as well, since they shared similar brain cortical profiles on their PET scans. However, independent evidence in support of this claim is also lacking in the literature.
A key difference between the two families of imaging probes is that the tissue binding of the parent molecules of thioflavin derivatives has been studied more extensively than those of the stilbene derivatives. Studies performed on the former group have suggested that Aβ binding of ThT is either monomeric, dimeric, or micellar [30]. Obviously, neither dimeric nor micellar binding are likely to be achieved under tracer conditions used in in vivo imaging experiments, where the molecular recognition mechanism of these uncharged ThT for amyloid fibrils would best be explained through the motor rotor effect [31].
It should also be noted that binding to Aβ fibrils by multiple dyes and probes has complex characteristics [32]. Several studies have suggested multiple binding sites, and at least three distinct types of binding sites have been identified in Aβ(1–40) fibrils [31]. These binding sites were differentiated by kinetic displacement studies when bound to Aβ fibrils, presumably because each dye binds to a distinct site on the Aβ aggregates. Recent crystallographic determinations confirm the existence of multiple forms of binding of small molecules to amyloids [33]. At this time, it is not known whether the tracers derived from 6-hydroxybenzothiazole used in in vivo studies in humans have the same binding affinities for non-Aβ tissue targets as ThT (e.g., binding to acetylcholinesterases [34] and DNA [35]).
(VI) Key Questions with Current Amyloid Imaging Probes
In a recent editorial, Villemagne et al. [2] acknowledged a host of fundamental limitations involving all “Aβ specific” imaging probes, including:
the extensive and uncharacterized uptake of Aβ PET tracers in the white matter of the brain;
tissue target specificity of imaging results with the different tertiary forms of Aβ found at autopsy; and
the lack of data in support for the in vivo specificity of these PET probes.
(A) The Extensive and Uncharacterized Uptake of Amyloid Probes in the White Matter
A pervasive finding in amyloid-PET imaging that appears to affect both dementia patients and controls is the substantial retention of these radiotracers in the white matter, a region that is largely spared by Aβ pathology. This phenomenon of apparent non-specific binding in the white matter, which is observed in all existing Aβ-specific PET tracers to varying degrees, is generally accepted and has not been a point of contention [2, 36] The implications of this recognized non-specificity, however, are a different matter in light of the aforementioned evidence of rapid peripheral metabolism and significant BBB transport of metabolites.
It has been maintained that the unexplained retention in the white matter does not pose a significant threat to the diagnostic accuracy of Aβ PET tracers, and that “this limitation has not proven to be a major hurdle to the quantitation of Aβ deposits in cortical gray matter, neither in the in vivo/postmortem cross-validation studies, nor in studies on the predictive value of the Aβ imaging findings, with regard to future cognitive decline” [2]. These claims are not entirely consistent with reported findings in the literature: an earlier paper on [11C]PiB by Klunk et al. acknowledged that Patlak-Gjedde models had difficulties quantifying signals in regions with very low intensity due to “a small but significant net accumulation of tracer in the cerebellum, perhaps because of non-specific retention in the white matter” [29]. The strikingly high SUVRs of the white matter of both controls and patients hint at the scope of the non-specific binding of existing Aβ tracers, which has also been thought to “limit the sensitivity of PET imaging especially in a prodromal phase of AD when plaque levels might be low” [29].
Furthermore, it has been established that this white matter PET signal produces a significant spill-over effect. Spill-over is an especially crucial concern in AD, since cortical atrophy would intensify the partial-volume effect. The relatively narrow width of the cortical grey matter in AD subjects makes it particularly susceptible to the partial-volume effect and the associated spillover from the white matter, which demonstrates a level of retention that is at least equivalent to—and in many cases substantially greater than—that of the grey matter [37]. The importance of partial volume corrections (PVC) in amyloid-PET imaging and the potential for biases that could lead to erroneous inferences about uptake in certain regions has been recently described in the literature [38]. Thus, the dismissal of the potentially disruptive effects of the strong PET signal consistently detected in the white matter does not appear justified.
A common explanation for the high white matter signal proposes that the phenomenon is “largely attributable to slower…white matter kinetics” [2, 36]. Blood flow has indeed been shown to be slower in white matter than in grey matter; multiple studies have measured the difference in arterial transit times to be approximately 650 milliseconds [39, 40]. However, the supposition that this disparity in clearance rate is largely responsible for the non-specific signal in the white matter is challenged by a number of findings. Chief among these is the reported difference in white matter retention that is seen in AD patients and controls. A recent [11C]PiB study involving dynamic imaging revealed that the non-specific retention appears appreciably higher in controls at all-time points [40]. Similarly, it has been demonstrated that [18F]florbetaben has significantly higher (p<.0001) retention in the cerebral and cerebellar white matter of controls [41]. Studies show that cerebral blood flow in the subcortical regions of AD patients is either lower than or equivalent to what is observed in healthy controls, so it would be expected that non-specific retention would either be equal in the two groups or higher in patients [36, 41]. The observation of higher non-specific retention in controls therefore appears to be inconsistent with the hypothesis that a slower clearance rate is primarily responsible.
The implication that extensive non-specificity underlies the hitherto unexplained retention in the white matter is further underscored by a paper published by Grimmer et al. [42]. The study, which examined white matter hyperintensities on the MRIs of AD patients, concluded that this phenomenon is “a consequence of thickening and sclerosis of arterial small vessel walls…which might lead to impaired perivascular drainage of molecules including Aβ”. However, the data revealed no significant association between white matter hyperintensities and [11C]PiB uptake at cross-sectional analysis, indicating that reduced clearance may not be at the root of this anomaly.
By most indications, the extent of the non-specific retention of Aβ imaging agents, particularly those labeled with [18F]fluorine, appears to be more serious than what has been suggested. Although it has been claimed that “the typical retention of Aβ radiotracers in gray matter is…at least comparable to threefold higher [than in white matter] in typical Aβ-positive scans” [2], it is well-documented with 18F-labeled tracers that this is not the case. In AD patients, the average ratios of the signal in the frontal cortices to that in the white matter for [18F]florbetapir, [18F]florbetaben, and [18F]flutemetamol have been reported to have a mean of 0.87, 1.1, and 0.7, respectively [43–46]. In controls, these ratios tumble even further to 0.8, 0.7, and 0.4, indicating that tracer retention in the white matter is in fact markedly higher than that in the grey matter in all cases. These findings are in line with other [18F]florbetaben and [18F]flutemetamol studies that reported that the retention in the white matter far outstripped any cortical region in both AD patients and controls [37, 45].
As illustrated in Table 2 from a [18F]florbetaben study performed by Barthel et al., tracer retention in the white matter has been observed to be significantly higher than that in the frontal, temporal, and parietal lobes in Aβ-positive cases [37]. Similar SUVR values for white matter [18F]florbetaben were also more recently reported in a comparative study of [11C]PiB and [18F]florbetaben in AD and controls [47]. Similarly, Vandenberghe et al. [45] (Graph D in Figure 2) report that accumulation of the fluorinated PiB derivative [18F]flutemetamol is significantly higher in the white matter than in all cortical areas in AD and mild cognitive impaired (MCI) patients.
Table 2.
Subject differences in brain regional cortical [18F]florbetaben uptake. SUV ratios (MV ± SD) obtained from the 80–90 min p.i. image time frames of the AD patients and HCs, together with individual SUVRs of the one false-negative (according to visual PET image analysis by three blinded readers) AD patient and the one false-positive HC. Cerebellar cortex served as reference region. Apart from pons/midbrain (singular region), mean SUVRs were taken from corresponding left and right hemispherical SUVRs. Composite SUVRs for neocortex combine volume-weighted means of frontal, parietal, lateral temporal, anterior and posterior cingulate and occipital cortex SUVRs (From [37]; with permission)
| AD patients | Healthy controls | Effect size | p | |||
|---|---|---|---|---|---|---|
| All subjects (n =10) | False-negative (n = 1) | All subjects (n = 10) | False-positive (n = 1) | |||
| Frontal cortex | 1.82 ± 0.32 | 1.39 | 1.36 ± 0.18 | 1.67 | 1.75 | 0.003 |
| Lateral temporal cortex | 1.57 ± 0.25 | 1.2 | 1.24 ± 0.10 | 1.36 | 1.73 | 0.01 |
| Mesial temporal cortex | 1.36 ± 0.19 | 1.22 | 1.25 ± 0.10 | 1.23 | 0.74 | 0.29 |
| Parietal cortex | 1.65 ± 0.26 | 1.26 | 1.36 ± 0.12 | 1.54 | 1.45 | 0.01 |
| Occipital cortex | 1.58 ± 0.16 | 1.4 | 1.37 ± 0.09 | 1.48 | 1.65 | 0.006 |
| Anterior cingulate cortex | 1.82 ± 0.31 | 1.49 | 1.43 ± 0.15 | 1.62 | 1.59 | 0.005 |
| Posterior cingulate cortex | 1.89 ± 0.45 | 1.34 | 1.37 ± 0.13 | 1.59 | 1.58 | 0.005 |
| Caudate head | 1.55 ± 0.25 | 1.39 | 1.18 ± 0.12 | 1.14 | 1.92 | 0.002 |
| Putamen | 1.80 ± 0.25 | 1.52 | 1.52 ± 0.13 | 1.66 | 1.38 | 0.013 |
| Thalamus | 1.68 ± 0.27 | 1.59 | 1.59 ± 0.12 | 1.65 | 0.42 | 0.62 |
| Pons/midbrain | 1.94 ± 0.30 | 2.17 | 2.05 ± 0.20 | 2.06 | 0.44 | 0.52 |
| White matter (centrum semiovale) | 2.08 ± 0.32 | 2.4 | 2.18 ± 0.25 | 2 | 0.34 | 0.85 |
| Neocortex | 1.72 ± 0.28 | 1.33 | 1.35 ± 0.12 | 1.53 | 1.73 | 0.008 |
This signal is also highly variable, which insinuates that, similar to [18F]florbetapir and [18F]florbetaben, the imaging probe [18F]flutemetamol is subject to a more complex mechanism of accumulation than has been suggested. The range of SUVRs for [18F]flutemetamol in the white matter is shown to lie between 2.0 and 3.5, as compared with the range of 1.0 to 3.0 for the cortices and striatum. It is also illustrated that non-specific signals in the white matter are substantially more intense with [18F]flutemetamol than with [11C]PiB [44]. These findings are inconsistent with the expectation for the simple non-specific binding that is typically characterized by multiple tissue binding sites with low binding affinities, which produce an essentially uniform distribution of activity in the cortices, subcortical area, and white matter (i.e., SUVRs approaching 1 throughout the brain). This large white matter signal would unavoidably cause spill-over and partial volume effects over any potential cortical signal, making any reading determination unreliable and inconsistent among readers.
The white matter binding pattern observed with these amyloid probes points to high-affinity targets other than Aβ aggregates. Although it has been hypothesized that “fluorinated ligands [are] more prone to [having] high non-specific white matter binding” due to their higher lipophilicity, no evidence has been published to confidently identify the origin of this apparent non-specific retention. There are other accounts of the sources of non-specificity in the white matter, including a recent paper that attributed [11C]PiB white matter retention to myelin [48]. Similarly, other studies with 4,4′-disubstituted stilbenes [49, 50] provide direct evidence in vitro and in vivo that these derivatives do bind to myelin with high affinity (Ki in the nM range). These findings provide additional evidence that specific non-Aβ tissue targets rather that the non-specific binding are responsible for the high retention of Aβ imaging probes in white matter.
(B) Tissue Target Specificity of Imaging Results with the Different Tertiary Forms of Aβ Found at Autopsy
The question of the specificity of amyloid imaging probes can be broken down into two components: (1) the in vivo tissue targets of Aβ probes, and (2) the quantitative correlation of regional imaging signals and autopsy findings.
(1) The In Vivo Binding Properties of Aβ Imaging Probes
The literature contains highly divergent reports of the binding selectivity of the tertiary forms of Aβ for amyloid tracers. Most of these correlative measures have been made with [11C]PiB, but recent correlative studies have also been reported with [18F]flutemetamol PET [51] or [18F]florbetapir PET and pathology load [52].
Though it is often claimed that [11C]PiB “binds strongly to fibrillar Aβ…but only weakly to diffuse Aβ plaques,” [53] a number of studies have observed significant [11C]PiB retention in correlation with the presence of both fibrillar and diffuse Aβ plaques, leading authors to assert that this tracer “cannot differentiate neuritic from diffuse amyloid plaques” [54]. An affinity for diffuse plaques was suggested in a paper by Kantarci et al. [55], which reported that “diffuse plaques contribute significantly to [11C]PiB signal in Lewy body dementia.”
Similarly, while some studies have suggested that cerebral amyloid angiopathy (CAA) is not detectable by PET using [11C]PiB, others have found “prominent [11C]PiB staining of CAA [56, 57]. Such findings have led authors to conclude that “[11C]PiB is not specific for classical plaques” due to the fact that “it additionally binds a range of Aβ containing lesions including diffuse plaques and CAA” [58, 59]. A paper by Sojkova et al. [60] reported that “in a group of 6 individuals with ([11C]PiB) in vivo imaging and post mortem evaluation, in vivo amyloid imaging showed limited overall agreement with CERAD neuritic plaque ratings.” Moreover, the affinity of amyloid tracers for the Aβ42 and Aβ40 isoforms is the subject of some disagreement in the literature. Although it is commonly stated that [11C]PiB labels “both Aβ42- and Aβ40-immunoreactive plaques,” [61] a recent study correlating distribution volume ratios to histopathology found that this was only true in amyloid-positive scans; in amyloid-negative cases, [11C]PiB was only correlated with Aβ42 [62].
A significant number of cases have also been reported where [11C]PiB PET cortical signal is either low or missing (i.e., negative [11C]PiB scans) in the presence of substantial brain Aβ loads at autopsy [8]. These cases generally involve subjects with specific mutations (e.g., E693G substitution in the APP gene–”Arctic mutation” or APParc; “Osaka mutation” E693), leading Ringman et al. [63] to reiterate the hypothesis that “different ‘conformations’ of Aβ deposits affect the binding patterns of tracers and that Aβ imaging may not recognize all types of Aβ deposits with equal sensitivity.” They cautioned that “interpreting a negative result is a perilous endeavor” [63]. Similar negative or low binding results have been reported with [11C]PiB scans in transgenic mice with large cortical amyloid deposition [64] and with [3H]PiB in brain specimens of non-human primates [65].
Thus, readers of these amyloid PET scans are left without a clear understanding of what the cortical signal is attributable to. It is uncertain how amyloid probes such as [11C]PiB interact with many forms of Aβ: diffuse and fibrillar, Aβ40 and Aβ42. A possible explanation of these striking contradictions is that the observations and inferences were mostly made by correlating PET imaging results of Aβ tracers with autopsy findings using immunohistochemistry and related techniques. An inherent pitfall of these inconsistent results is that correlative measures do not indicate causality; that is, the inconsistent results may be explained by PET imaging signals not necessarily caused by these aggregates in any of their forms, but rather by tissue targets partially related (e.g., inflammatory tissue targets) or unrelated to these pathologies.
(2) Quantitative Correlation of Regional Imaging Signals and Autopsy Findings
Correlation studies of imaging results and pathology deposition have been termed “semiquantitative” [2]. Therefore, as a part of testing the hypothesis that these probes bind to Aβ it is necessary to examine and correlate PET signals with pathology distribution on qualitative (i.e., matching spatial distribution of both signals) as well as quantitative levels (i.e., matching densities of both signals). Furthermore, if the hypothesis is correct, then PET imaging should predict the distribution and quantitative levels of pathology post mortem.
To date, at least one biopsy study [66] and several autopsy studies have reported the correlation of pathology with [11C]PiB in subjects with AD [52, 54, 67], dementia with Lewy bodies [55, 62], Parkinson’s disease with dementia [68] and sporadic Creutzfeldt-Jakob disease [69]. However, with the exception of the study by Ikonomovic et al. [53], which was limited to one AD brain slice, none of these studies mapped out Aβ pathologies in sufficient detail to allow for quantitative regional cortical correlation of amyloid imaging signal with underlying pathology throughout the whole brain, irrespective of the neurodegenerative disease.
Considering the established NIA/AA pathology criteria requirements for the diagnosis of AD [14, 15, 19], the question of why Aβ imaging probes have low amyloid binding in the medial temporal lobe is of particular interest. It has been suggested that factors such as cortical atrophy “may contribute to the underestimation of [11C]PiB accumulation in medial temporal lobe” [70]. Other possible factors may include topographical differences in the distribution of Aβ, which is expressed in lower densities in limbic areas such as the hippocampus and subiculum, where neurofibrillary pathology is more prevalent [71]. Yet, in other medial temporal lobe areas, such as the entorhinal, perirhinal, and rhinal cortices, as well as the parahippocampal gyrus, β-amyloid plaque densities (both diffuse and neuritic) reach levels observed in the lateral temporal lobe and other cortical areas [16, 72]. Partial volume effects are expected in all cortical areas, particularly in severe dementia, but it is considered unlikely that the negligible binding of [11C]PiB in the medial temporal lobe at all levels of cognitive impairment is entirely due to the combined effects of low Aβ plaque densities and atrophy [70].
The typical [11C]PiB pattern in AD, for example, manifests levels of signal that are high in most cortical areas, except in the isocortical medial temporal lobe, an area high in Aβ. These results conflict with data from neuropathological AD studies in the literature (Figure 3) showing high densities of Aβ plaques in the inferior temporal cortex (Brodmann area 20) and perirhinal cortex (isocortical medial temporal lobe, Brodmann areas 35/36) exceeding levels observed in the frontal lobe [71]. Instead, [11C]PiB shows high signal in the precuneus, which has been found to have an Aβ load that is similar to other surrounding neocortical regions [71]. Arnold et al. [71] report that densities of neuritic plaques (defined as Thioflavin-S positive plaques) in both areas of the temporal lobe in AD subjects are at comparable or higher levels than the frontal lobe or precuneus (Brodmann area 7). Several other published studies also describe comparisons of plaque densities in the frontal lobe (Brodmann area 9) and inferior temporal gyrus (Brodmann area 20) that either reveal no difference between the regions or higher densities in the inferior temporal gyrus [73]. This low profile of [11C]PiB accumulation in the inferior and medial regions of the temporal lobe in comparison to the frontal lobe, parietal lobe, precuneus, and lateral temporal lobe has been widely reported in PET studies on AD. Similar patterns have also been demonstrated with [18F]flutemetamol, [18F]florbetapir and [18F]florbetaben PET scans.
Fig. 3.

I. Phases of β-amyloidosis in medial temporal lobe (MTL) structures as described by Thal et al. (reference [17]) are incorporated in the NIA-AA revised neuropathologic criteria for AD diagnosis (references [14] and [15]). II. Relationship between cortical and MTL amyloid-β deposition is demonstrated on coronal brain tissue slices of a whole hemisphere stained with Campbell-Switzer silver stain (see Thal et al. [16]) for details) on an example of Thal Aβ Phase 2 case (left image) and an example of widespread amyloidosis in a Thal Aβ Phase 4 case (right image). Note that in Thal Aβ Phase 2 (equivalent to Braak amyloid stage B) some MTL structures (red arrowheads) already have amyloid-β deposits when amyloid-β deposition in neocortex is still confined to a limited number of neocortical brain regions (e.g. frontal lobe, temporal lobe) and many cortical brain regions still appear free of amyloid-β deposits (e.g. cingulate gyrus; large black arrows). In Thal Aβ Phase 4 (equivalent to Braak amyloid stage C) MTL structures beyond hippocampus show dense amyloid-β deposits comparable in density to other neocortical structures (right image) III. Correlation of Thal phases of β-amyloidosis in MTL structures with Braak NFT stages (from reference [17]). IV. Correlation of both pathology measures with pre-mortem CDR scores (from reference [16]). (This Figure contains parts of Figures from references [16] and [17]; with permission)
In the early stages of dementia, including MCI, [11C]PiB cortical accumulation has a bi-modal character that resembles the typical profile of either AD patients (“positive PIB scan”) or controls (“negative PIB scan”) [74]. In these cases, discrepancies are also observed with known neuropathological profiles that are defined by the NIA/AA diagnosis criteria and Thal et al. [14–19]. Figure 3 shows that in Thal Aβ phase 2 (the equivalent of Braak amyloid stage B), medial temporal lobe structures already present accumulation of Aβ deposits while Aβ deposition in neocortex remains limited. Indeed, at this early stage, Aβ deposition is confined to a small number of neocortical brain regions, with many cortical brain regions still free of Aβ [16, 17].
This discrepancy between neuropathological studies and [11C]PiB (and other Aβ imaging probes) binding is most evident in voxel-to-voxel comparisons where [11C]PiB binding in the medial temporal lobe—comprising both limbic (i.e., hippocampus, amygdala, entorhinal cortex) and neocortical (i.e., Brodmann 35/36) areas—fail to separate control and AD groups (Figure 4) [75, 76]. The inconsistency between imaging results and neuropathological findings raises the crucial question of why [11C]PiB and related Aβ imaging probes produce such weak signal in an area rich in both diffuse and neuritic amyloid plaques [17, 72]—a question that has yet to be presented and addressed in the literature.
Fig. 4.

Mismatch between neuropathological results and ‘amyloid specific’ imaging probe signal in the medial temporal lobe. In AD medial temporal lobe structures have abundant amyloid-β deposit, both diffuse and neuritic plaques, comparable in density to those observed in the cortex as shown for temporal lobe by Price and Morris [72](upper image in the right column) and Thal and colleagues [16](lower image in the right column). Left column shows coronal view of the [11C]PiB PET image (upper image), of the MRI image from the same subject (lower image) and overlay of [11C]PiB PET image on MRI imaging for anatomical reference. Images in the central column show expanded temporal lobe structures on overlay of [11C]PiB PET image on MRI image (upper insert) and on the MRI image (lower image).The mismatch between amyloid PET imaging results and pathology in medial temporal lobe is demonstrated on an example of the AD [11C]PiB PET scan (upper image in the left row). The [11C]PiB PET signal is highly elevated throughout the cortex but is missing in the medial temporal lobe. Similar results have been reported for other “amyloid-specific” imaging probes. (This Figure contains parts of Figures from references [16] and [72]; with permission)
(C) In Vivo Specificity of Amyloid Probes
As pointed out by Villemagne et al. [2], dose-escalation and competitive displacement studies have not been performed on any Aβ imaging agents, meaning that the in vivo binding properties of these tracers have not been fully characterized. In addition to the reported inconsistencies between the signal produced by Aβ imaging probes and tissue localization of pathology, the recent critical finding that the observed [11C]PiB accumulation in stroke [77] and meningioma patients [78] (Figure 5) is not due to the presence of Aβ in the lesions or tumors further underscores the possible role of tissue targets other than Aβ in causing tracer accumulation in the human brain. These observations add to those discussed earlier for white matter signal [49, 50] and demonstrate that [11C]PiB and other Aβ-specific probe retention, as observed in PET images, is not necessarily indicative of Aβ content. Logically these PET scans require caution in their interpretation.
Fig. 5.
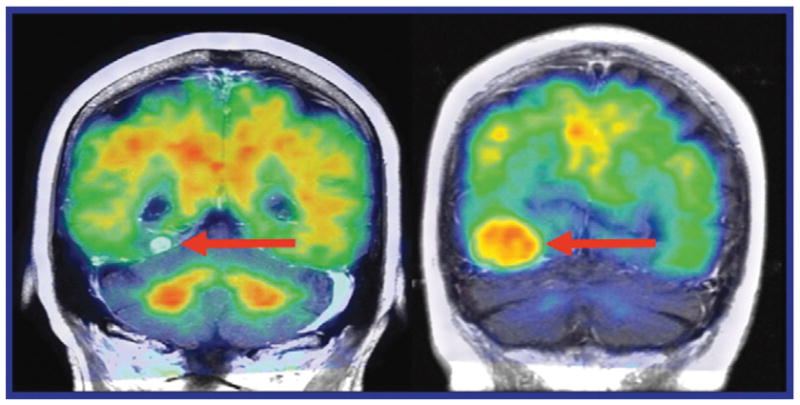
Coronal [11C]PiB PET/CT images fused with MR findings in patients with (left) melanoma metastasis and (right) meningioma. Both patients had tumors along the tentorium (From Bengel and Minoshima [78]; with permission)
The observation that 6-hydroxybenzothiazoles, the parent molecular structure of [11C]PiB and [18F]flutemetamol, are excellent substrates of brain estrogen sulfotransferase (SULT1E1) offers an interesting alternative interpretation to the retention of these imaging probes in the brain in a manner similar to FDG for hexokinase [79]. Published results in rodents suggest that [11C]PiB and its derivatives are retained in vivo in brain tissue mainly as 6-O-sulfates—with a small percentage of 6-O-glucuronidates—producing a signal unrelated to Aβ deposition. There is evidence that the sulfation of [11C]PiB is not limited to rodents; rather, it appears that the compound is subject to similar peripheral metabolism in humans, producing 6-O-sulfate (or [11C]PIB-6-O-sulfate) as the main [11C]PiB metabolite in plasma. This stable, charged metabolite of [11C]PiB, as well as all other 6-hydroxy congeners, does not cross the BBB. However, the presence of estrogen sulfotransferase has been independently confirmed in the human brain [80], which implies that 6-O-sulfation of [11C]PiB (and related 6-hydroxy derivatives) (Table 1) is also feasible in the brains of human subjects.
It is worth noting that the sulfation of [11C]PiB was initially demonstrated in the rat brain, but later dismissed in humans based on a single reported autopsy experiment on a frozen brain tissue specimen [81]. Due to enzyme inactivation, the brain estrogen sulfotransferase and ATP-dependent sulfation of [11C]PiB and its 6-hydroxy analogs generally cannot be measured in tissue specimens unless they are fresh, which is a rarity in human brain autopsies. For this reason, brain specimen preparations that are appropriate for detection of amyloid aggregates (i.e., formalin/sucrose fixed or frozen for long periods of time) would not be conducive to the detection of other tissue targets, such as the active sulfotransferase-mediated trapping of [11C]PiB and related 6-hydroxy derivatives.
These observations in rodents, along with the presence of estrogen sulfotransferase in the human brain, add to the need for unequivocal confirmation that the PET signal obtained in vivo in the human brain with [11C]PiB or any of its radiofluorinated 6-hydroxy derivatives (e.g., [18F]flutemetamol, [18F]AZD4694 [79] and [11C]AZD2184) (Table 1) is attributable to binding of the parent molecular imaging probe to brain Aβ aggregates and not to the action of estrogen sulfotransferase, among other possible tissue targets. This may further explain why all 6-hydroxysubstituted benzothiazole/benzoxazoles in current use have in vivo behavior similar to [11C]PiB [82].
Using thioflavin (or structurally related) derivatives that lack 6-hydroxy substitution but retain tight binding to Aβ fibrils would remove estrogen sulfotransferase as a tissue target and help clarify uncertainties as to the origin of the brain imaging signal obtained. This information is already available in published studies: Klunk et al. [83] report that the “binding of 2-(4′-methylaminophenyl)benzothiazole (BTA-1) [a thioflavin analog of PiB lacking the 6-hydroxy group] to AD brain is dominated by a specific interaction with Aβ amyloid deposits.” BTA-1 has a very tight nanomolar binding (Ki) to Aβ fibrils in vitro and to AD brain homogenates, properties that parallel the Aβ binding parameters for [11C]PiB (Figure 6).
Fig. 6.
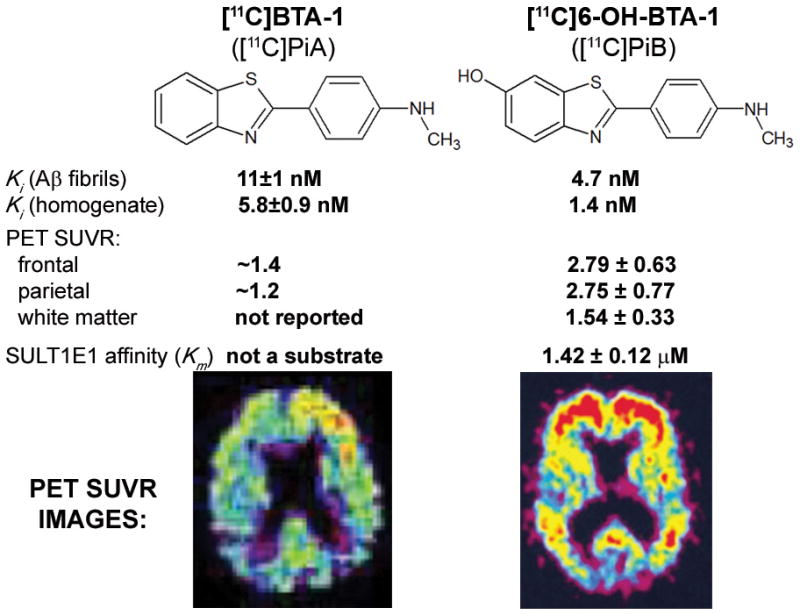
Molecular structures, binding constants, SUVRs, and affinities of the Aβ imaging probes [11C]PiA and [11C]PiB vs. SUVR PET image. SUVR values are referenced to cerebellar grey matter and are therefore independent the influence of variable peripheral metabolism. Standardized uptake value ratio (SUVR) images, normalized to cerebellum, of two Alzheimer’s disease patients independently injected with both imaging probes ([11C]PiB, [26]; [11C]PiA, [84]). No color scale is available in the case of BTA-1. SUVR values are based on values reported in text on page 277 in [84]. (This Figure contains parts of Figures from references [26] and [84]; with permission)
The absence of the 6-hydroxy-substitution, present in [11C]PiB, means that BTA-1 is not a substrate for estrogen sulfotransferases, making it an appropriate candidate for specific Aβ binding in vivo. Even though the Aβ binding properties of BTA-1 and PiB are similar [83], Neumaier et al. [84] report that [11C]BTA-1 PET in vivo imaging properties are quite different from those of [11C]PiB, particularly with regard to cortical distribution and SUVR (Figure 6). Therefore, since [11C]BTA-1 binding to AD brain is dominated by a specific interactions with Aβ deposits, as reported by Klunk et al. [83], the differential cortical distribution and the much higher cortical accumulation of [11C]PiB in the AD brain warrants explanation. Since SUVRs are relative measurements (e.g., cortical signal vs. cerebellum), differences in peripheral metabolism are not expected to substantially affect (semi)quantitative interpretation of PET signals. It needs to be investigated whether, as suggested by the rodent studies [79], this disparity is attributable to the sulfation of [11C]PiB in the human brain.
(VII) Conclusions
The promotion of research on PET biomarkers for all amyloids (i.e., Aβ, tau, prions, etc.) is of the utmost importance for the progress of the field. A fundamental advantage of PET that distinguishes it from other imaging techniques is its ability to quantify the functional activity of specific tissue targets in human health and disease. To achieve that goal, there are well-established requirements imposed on the design of molecular imaging probes that have been extensively discussed in the literature [1]. The two most vital requirements for the molecular imaging PET probes designed for the regional visualization and quantification of Aβ in the living human brain are: (a) the in vivo signal obtained with PET is only the result of the probe binding to the Aβ neuroaggregates, and (b) the peripheral metabolism of the probe is minimized or, if it occurs, the metabolites either do not penetrate the BBB or do so in a predictable manner that allows for appropriate quantification of the specific signal emerging from the interaction of the probe with Aβ.
The pertinent question is whether the current Aβ PET imaging probes meet these requirements. The lack of in vivo binding validation of these probes and the consequent deficiency in the understanding of their tissue binding and specificity are genuine concerns. Further complications stemming from the rapid peripheral and central metabolism of these probes and the brain transport of metabolites (e.g., in the case of trans-stilbene probes such as [18F]florbetapir) are severe limitations at the very heart of the tracer design and development. The data collected from in vitro binding determinations and autoradiography findings, which are typically obtained with various concentrations of tracers and solvents not mimicking in vivo conditions, simply cannot supplant the results of necessary in vivo experiments.
There exists a host of apparent contradictions regarding the Aβ specificity of amyloid tracers that require in vivo evidence before the regional accumulation of PET tracer can be confidently interpreted as the result of regional Aβ deposition. Moreover, the absence of an adequate model for transforming regional amyloid tracer accumulation data into a meaningful measure of regional Aβ density has led to the postulation of unsubstantiated inferences about AD biology that seek to explain the observed anomalies. For example, without further neuropathological evidence, the aforementioned overlap among MCI and AD patients and asymptomatic older controls has been interpreted to mean that 30% of normal asymptomatic controls have Aβ brain deposition at levels present in full blown AD [85]. Equally worrisome are the opposite findings where patients with positive evidence of pathology deposition and a clinical AD diagnosis demonstrate negative Aβ scans [62, 63, 66, 67].
The existing NIA-AA criteria for the neuropathological diagnosis of AD confirms the importance of both brain tau and Aβ aggregate deposition, since they include (A) β-amyloidosis in the medial temporal lobe (B) Braak tau pathology stages (I-VI stages); (C) CERAD neuritic plaque staging [14, 15]. These diagnostic criteria represent a significant challenge to the logic behind the utilization of “Aβ-specific” imaging probes as AD diagnostic tools, which the literature points to as their intended use. Villemagne et al. [2] aptly report, however, that “it may be best to not equate amyloid deposition to clinical diagnosis. Rather than as a method of diagnosis (for AD), it might be best to first think of [11C]PiB retention more fundamentally as a method to detect and quantify brain β-amyloidosis…It does not provide a diagnosis by itself.”
If diagnosis cannot be performed with Aβ PET imaging probes, it would seem that most of the possible benefits of these imaging agents would be derived from their potential application in validating anti-amyloid drugs, assuming they label brain amyloid deposits in vivo. The promise for amyloid tracers to aid in the development of anti-amyloid drugs has been repeatedly touted in the literature. However, in the most recent FDA AD Drug Development Guidance (www.fda.gov/downloads/Drugs/GuidanceComplianceRegulatoryInformation/Guidances/UCM338287.pdf) the agency states that it “will not be in a position to consider an approval (of a therapeutic drug) based on the use of a biomarker as a surrogate outcome measure in AD (at any stage of the illness).”
Furthermore, all the reported clinical trials using anti-Aβ antibody (or related) therapies have fallen short of expectations. The most glaring failures have been the recently reported negative results on the phase III clinical trials of bapineuzumab and solanezumab [10] and the Phase II evaluation of the γ-secretase inhibitor Avagacestat [11, 12]. Using Aβ PET imaging agents as their standard for quantification, bapineuzumab and other anti-amyloid therapies have been shown to substantially reduce Aβ loads in AD patients while still allowing clinical symptoms to progress.
In summary, without a thorough understanding of the elements to play within a scan, an image cannot offer accurate and reliable information. With regards to amyloid imaging, the in vivo specificity of the probes has not been fully established, the sources of their non-specific uptake have not been identified, and the implications of the physical limitations of standard PET systems have not been considered, all of which limit the clinical utility of the modality. All available evidence indicates that (i) current Aβ PET imaging probes do not fulfill the established neuropathological criteria for successful AD diagnosis [14–18]; (ii) diagnostic use is no longer an intended or plausible application of these probes [2]; (iii) their utilization in monitoring anti-Aβ therapies has been very limited, and (iv) anti-Aβ therapies have been repeatedly shown to be ineffective. Placing the available amyloid-PET probes on the market before these critical issues are resolved would therefore run the risk of eroding the trust of the scientific and medical communities in current and future Aβ probes.
(VIII) Epilogue
“We absolutely must leave room for doubt or there is no progress and no learning. There is no learning without having to pose a question. And a question requires doubt” Richard P. Feynman (1918–1988), California Institute of Technology, Nobel Laureate, Physics. From lecture “What is and What Should be the Role of Scientific Culture in Modern Society”, given at the Galileo Symposium in Italy, 1964.
This statement by the renowned scientist Richard Feynman is quite apropos to the current saga of Aβ-specific PET probes. AD and related disorders are critical issues facing the aging population, both in developed and developing countries. However, the available data reported thus far on amyloid imaging probes have generated serious doubts as to their validity and usefulness vis-à-vis their proposed indications relating to AD. These concerns have led to relevant questions that must be addressed to better understand the underlying causes of dementia. Any future progress in the PET imaging of AD and related disorders depends on how well these doubts are cleared and lingering questions are answered.
The diagnosis and treatment monitoring of dementia generally stands to benefit tremendously from PET imaging. However, in light of the discussions presented earlier in this review, it appears likely that current probes will face a host of problems in the clinical setting that will limit its diagnostic and prognostic value. Ultimately, Professor Feynman’s axiom of critically assessing scientific approaches and asking pertinent and valid questions in order to establish scientific truth would be necessary for the development and utilization of a truly successful amyloid-PET biomarker.
Acknowledgments
Special thanks are given to the many colleagues and friends who encouraged us to write this review for the benefit of science and the many patients and their families who suffer the devastating effects of Alzheimer’s and other neurodegenerative diseases. This work was supported by federal and university funds at the various institutions, including the UCLA ADRC (NIH grant P50 AG 16570) and SNSF grant 31003A-135576.
Footnotes
Disclosures
The authors did not receive support for this work from any for-profit entity, including licensing agreements. One of us (JRB) was the chair of a PET Radiopharmaceutical Committee (1997–2006) representing the scientific and medical community [Academy of Molecular Imaging (AMI), the Society of Nuclear Medicine (SNM) and the American College of Nuclear Physicians (ACNP)] as mandated by the US Congress (FDAMA 97) to work in consultation with the FDA for the clinical approval of PET radiopharmaceuticals (e.g., 2-deoxy-2-[18F]fluoro-D-glucose (FDG), sodium [18F]fluoride and [13N]ammonia), and the development of current Good Manufacturing Practice (cGMP) regulations.
References
- 1.Hardy J, Selkoe DJ. The amyloid hypothesis of Alzheimer’s disease: progress and problems on the road to therapeutics. Science. 2002;297:353–356. doi: 10.1126/science.1072994. [DOI] [PubMed] [Google Scholar]
- 2.Villemagne VL, Klunk WE, Mathis CA, Rowe CC, Brooks DJ, Hyman BT, Ikonomovic MD, Ishii K, Jack CR, Jagust WJ, Johnson KA, Koeppe RA, Lowe VJ, Masters CL, Montine TJ, Morris JC, Nordberg A, Petersen RC, Reiman EM, Selkoe DJ, Sperling RA, Van Laere K, Weiner MW, Drzezga A. Aβ Imaging: feasible, pertinent, and vital to progress in Alzheimer’s disease. Eur J Nucl Med Mol Imaging. 2012;39:209–219. doi: 10.1007/s00259-011-2045-0. [DOI] [PMC free article] [PubMed] [Google Scholar]
- 3.Fleisher AS, Chen K, Liu X, Roontiva A, Thiyyagura P, Ayutyanont N, Joshi AD, Clark CM, Mintun MA, Pontecorvo MJ, Doraiswamy PM, Johnson KA, Skovronsky DM, Reiman EM. Using positron emission tomography and florbetapir F18 to image cortical amyloid in patients with mild cognitive impairment or dementia due to Alzheimer disease. Arch Neurol. 2011;68:1404–1411. doi: 10.1001/archneurol.2011.150. [DOI] [PubMed] [Google Scholar]
- 4.Lee H, Zhu X, Castellani RJ, Nunomura A, Perry G, Smith MA. Amyloid-β in Alzheimer disease: The null versus the alternate hypotheses. J Pharm Experimental Therap. 2007;321:823–829. doi: 10.1124/jpet.106.114009. [DOI] [PubMed] [Google Scholar]
- 5.Zhao LN, Long HW, Mu Y, Chew LY. The toxicity of amyloid β oligomers. Int J Mol Sci. 2012;13:7303–7327. doi: 10.3390/ijms13067303. [DOI] [PMC free article] [PubMed] [Google Scholar]
- 6.Cohen RM. The role of the immune system in Alzheimer’s disease. J Lifelong Learning Psych. 2009;7:28–35. [Google Scholar]
- 7.Moghbel MC, Saboury B, Basu S, Metzler SD, Torigian DA, Langstrom B, Alavi A. Amyloid-β imaging with PET in Alzheimer’s disease: is it feasible with current radiotracers and technologies? Eur J Nucl Med Mol Imaging. 2012;39:202–208. doi: 10.1007/s00259-011-1960-4. [DOI] [PubMed] [Google Scholar]
- 8.Holtzman JL. Amyloid-β vaccination for Alzheimer’s dementia. Lancet. 2008;372:1381. doi: 10.1016/S0140-6736(08)61578-0. [DOI] [PubMed] [Google Scholar]
- 9.Panza F, Frisardi V, Solfrizzi V, Imbimbo BP, Logroscino G, Santamato A, Greco A, Seripa D, Pilotto A. Immunotherapy for Alzheimer’s disease: from anti-β-amyloid to tau-based immunization strategies. Immunotherapy. 2012;4:213–238. doi: 10.2217/imt.11.170. [DOI] [PubMed] [Google Scholar]
- 10.Fagan T. Bapineuzumab Phase 3: Target Engagement, But No Benefit. Alzheimer Research Forum. 2012 http://www.alzforum.org/new/detail.asp?id=3268.
- 11.Dickey Zakaib G. Drug Company Halts Development of γ-Secretase Inhibitor Avagacestat. Alzheimer Research Forum, ?id=3344 2012 [Google Scholar]
- 12.Coric V, van Dyck CH, Salloway S, Andreasen N, Brody M, Richter RW, Soininen H, Thein S, Shiovitz T, Pilcher G, Colby S, Rollin L, Dockens R, Pachai C, Portelius E, Andreasson U, Blennow K, Soares H, Albright C, Feldman HH, Berman RM. Safety and tolerability of the γ-secretase inhibitor avagacestat in a phase 2 study of mild to moderate Alzheimer disease. Arch Neurol. 2012;69:1430–1440. doi: 10.1001/archneurol.2012.2194. [DOI] [PubMed] [Google Scholar]
- 13.Nelson PT, Alafuzoff I, Bigio EH, Bouras C, Braak H, Cairns NJ, Castellani RJ, Crain BJ, Davies P, Del Tredici K, Duyckaerts C, Frosch MP, Haroutunian V, Hof PR, Hulette CM, Hyman BT, Iwatsubo T, Jellinger KA, Jicha GA, Kövari E, Kukull WA, Leverenz JB, Love S, Mackenzie IR, Mann DM, Masliah E, McKee AC, Montine TJ, Morris JC, Schneider JA, Sonnen JA, Thal DR, Trojanowski JQ, Troncoso JC, Wisniewski T, Woltjer RL, Beach TG. Correlation of Alzheimer disease neuropathologic changes with cognitive status: a review of the literature. J Neuropathol Exp Neurol. 2012;71:362–381. doi: 10.1097/NEN.0b013e31825018f7. [DOI] [PMC free article] [PubMed] [Google Scholar]
- 14.Montine TJ, Phelps CH, Beach TG, Bigio EH, Cairns NJ, Dickson DW, Duyckaerts C, Frosch MP, Masliah E, Mirra SS, Nelson PT, Schneider JA, Thal DR, Trojanowski JQ, Vinters HV, Hyman BT. National Institute on Aging-Alzheimer’s Association guidelines for the neuropathologic assessment of Alzheimer’s disease: a practical approach. Acta Neuropathol. 2012;123:1–11. doi: 10.1007/s00401-011-0910-3. [DOI] [PMC free article] [PubMed] [Google Scholar]
- 15.Hyman BT, Phelps CH, Beach TG, Bigio EH, Cairns NJ, Carrillo MC, Dickson DW, Duyckaerts C, Frosch MP, Masliah E, Mirra SS, Nelson PT, Schneider JA, Thal DR, Thies B, Trojanowski JQ, Vinters HV, Montine TJ. Institute on Aging-Alzheimer’s Association guidelines for the neuropathologic assessment of Alzheimer’s disease. Alzheimers Dement. 2012;8:1–13. doi: 10.1016/j.jalz.2011.10.007. [DOI] [PMC free article] [PubMed] [Google Scholar]
- 16.Thal DR, Rüb U, Orantes M, Braak H. Phases of A beta-deposition in the human brain and its relevance for the development of AD. Neurology. 2002;58:1791–1800. doi: 10.1212/wnl.58.12.1791. [DOI] [PubMed] [Google Scholar]
- 17.Thal DR, Rüb U, Schultz C, Sassin I, Ghebremedhin E, Del Tredici K, Braak E, Braak H. Sequence of Abeta-protein deposition in the human medial temporal lobe. J Neuropathol Exp Neurol. 2000;59:733–748. doi: 10.1093/jnen/59.8.733. [DOI] [PubMed] [Google Scholar]
- 18.Braak H, Braak E. Neuropathological stageing of Alzheimer-related changes. Acta Neuropathol. 1991;82:239–259. doi: 10.1007/BF00308809. [DOI] [PubMed] [Google Scholar]
- 19.Mirra SS, Heyman A, McKeel D, Sumi SM, Crain BJ, Brownlee LM, Vogel FS, Hughes JP, van Belle G, Berg L. The Consortium to Establish a Registry for Alzheimer’s Disease (CERAD) Part II. Standardization of the neuropathologic assessment of Alzheimer’s disease. Neurology. 1991;41:479–486. doi: 10.1212/wnl.41.4.479. [DOI] [PubMed] [Google Scholar]
- 20.Mathis CA, Wang Y, Holt DP, Huang GF, Debnath ML, Klunk WE. Synthesis and evaluation of 11C-labeled 6-substituted 2-arylbenzothiazoles as amyloid imaging agents. J Med Chem. 2003;46:2740–2754. doi: 10.1021/jm030026b. [DOI] [PubMed] [Google Scholar]
- 21.Waibel M, De Angelis M, Stossi F, Kieser KJ, Carlson KE, Katzenellenbogen BS, Katzenellenbogen JA. Bibenzyl- and stilbene-core compounds with non-polar linker atom substituents as selective ligands for estrogen receptor beta. Eur J Med Chem. 2009;44:3412–3424. doi: 10.1016/j.ejmech.2009.02.006. [DOI] [PMC free article] [PubMed] [Google Scholar]
- 22.Jackson A, Smith GE, Brown SL, Morisson-Iveson V, Chau W, Durrant CL, Wilson IA. Radiosynthesis, biodistribution and metabolic fate of three PET agents for amyloid-β in rats: [18F]flutemetamol, florbetapir F18 (18F-AV-45) and florbetaben (BAY 94-9172) (PW012) Eur J Nucl Med Mol Imaging. 2011;38(Suppl 2):S231–S232. [Google Scholar]
- 23.Choi SR, Golding G, Zhuang Z, Zhang W, Lim N, Hefti F, Benedum TE, Kilbourn MR, Skovronsky D, Kung HF. Preclinical properties of 18F-AV-45: A PET agent for Abeta plaques in the brain. J Nucl Med. 2009;50:1887–1894. doi: 10.2967/jnumed.109.065284. [DOI] [PMC free article] [PubMed] [Google Scholar]
- 24.Yin W, Zhou X, Qiao J, Zhu L. Study the pharmacokinetics of AV-45 in rat plasma and metabolism in liver microsomes by ultra-performance liquid chromatography with mass spectrometry. Biomed Chromatogr. 2012;26:666–671. doi: 10.1002/bmc.1714. [DOI] [PubMed] [Google Scholar]
- 25.Logan J, Fowler JS, Volkow ND, Wang GJ, Ding YS, Alexoff DL. Distribution volume ratios without blood sampling from graphical analysis of PET data. J Cereb Blood Flow Metab. 1996;16:834–840. doi: 10.1097/00004647-199609000-00008. [DOI] [PubMed] [Google Scholar]
- 26.Carome M, Wolfe S. Florbetapir-PET imaging and postmortem β-amyloid pathology. JAMA. 2011;305:1857–1858. doi: 10.1001/jama.2011.579. [DOI] [PubMed] [Google Scholar]
- 27.Phelps ME. PET molecular imaging and its biological applications. New York: Springer; 2003. [Google Scholar]
- 28.Klunk WE, Wang Y, Huang GF, Debnath ML, Holt DP, Mathis CA. Uncharged thioflavin-T derivatives bind to amyloid-beta protein with high affinity and readily enter the brain. Life Sci. 2001;69:1471–1484. doi: 10.1016/s0024-3205(01)01232-2. [DOI] [PubMed] [Google Scholar]
- 29.Klunk WE, Engler H, Nordberg A, Wang Y, Blomqvist G, Holt DP, Bergström M, Savitcheva I, Huang GF, Estrada S, Ausén B, Debnath ML, Barletta J, Price JC, Sandell J, Lopresti BJ, Wall A, Koivisto P, Antoni G, Mathis CA, Långström B. Imaging brain amyloid in Alzheimer’s disease with Pittsburgh Compound- B. Ann Neurol. 2004;55:306–319. doi: 10.1002/ana.20009. [DOI] [PubMed] [Google Scholar]
- 30.Biancalana M, Koide S. Molecular mechanism of Thioflavin-T binding to amyloid fibrils. Biochim Biophys Acta – Proteins Proteomics. 2010;1804:1405–1412. doi: 10.1016/j.bbapap.2010.04.001. [DOI] [PMC free article] [PubMed] [Google Scholar]
- 31.Agdeppa ED, Kepe V, Liu J, Small GW, Huang SC, Petric A, Satyamurthy N, Barrio JR. 2-Dialkylamino-6-acylmalononitrile substituted naphthalenes (DDNP analogs): novel diagnostic and therapeutic tools in Alzheimer’s disease. Mol Imaging Biol. 2003;5:404–417. doi: 10.1016/j.mibio.2003.09.010. [DOI] [PubMed] [Google Scholar]
- 32.Cai L, Innis R, Pike VW. Radioligand development for PET imaging of β-amyloid (Aβ) - Current status. Current Med Chem. 2007;14:19–52. doi: 10.2174/092986707779313471. [DOI] [PubMed] [Google Scholar]
- 33.Landau M, Sawaya MR, Faull KF, Laganowsky A, Jiang L, Sievers SA, Liu J, Barrio JR, Eisenberg D. Towards a pharmacophore for amyloid. PLoS Biol. 2011;2011:e1001080. doi: 10.1371/journal.pbio.1001080. [DOI] [PMC free article] [PubMed] [Google Scholar]
- 34.De Ferrari GV, Mallender WC, Inestrosa NC, Rosenberry TL. Thioflavin T is a fluorescent probe of the acetylcholinesterase peripheral site that reveals conformational interactions between the peripheral and acylation sites. J Biol Chem. 2001;276:23282–23287. doi: 10.1074/jbc.M009596200. [DOI] [PubMed] [Google Scholar]
- 35.Ilanchelian M, Ramaraj R. Emission of thioflavin T and its control in the presence of DNA. J Photochem Photobiol A: Chemistry. 2004;162:129–137. [Google Scholar]
- 36.Fodero-Tavoletti MT, Rowe CC, McLean CA, Leone L, Li QX, Masters CL, Cappai R, Villemagne VL. Characterization of PiB binding to white matter in Alzheimer disease and other dementias. J Nucl Med. 2009;50:198–204. doi: 10.2967/jnumed.108.057984. [DOI] [PubMed] [Google Scholar]
- 37.Barthel H, Gertz HJ, Dresel S, Peters O, Bartenstein P, Buerger K, Hiemeyer F, Wittemer-Rump SM, Seibyl J, Reininger C, Sabri O Florbetaben Study Group. Cerebral amyloid-β PET with florbetaben (18F) in patients with Alzheimer’s disease and healthy controls: a multicentre phase 2 diagnostic study. Lancet Neurol. 2011;10:424–435. doi: 10.1016/S1474-4422(11)70077-1. [DOI] [PubMed] [Google Scholar]
- 38.Thomas BA, Erlandsson K, Modat M, Thurfjell L, Vandenberghe R, Ourselin S, Hutton BF. The importance of appropriate partial volume correction for PET quantification in Alzheimer’s disease. Eur J Nucl Med Mol Imaging. 2011;38:1104–1119. doi: 10.1007/s00259-011-1745-9. [DOI] [PubMed] [Google Scholar]
- 39.Van Gelderen P, de Zwart JA, Duyn JH. Pittfalls of MRI measurement of white matter perfusion based on arterial spin labeling. Magn Reson Med. 2008;59:788–795. doi: 10.1002/mrm.21515. [DOI] [PubMed] [Google Scholar]
- 40.Liu P, Uh J, Devous MD, Adinoff B, Lu H. Comparison of relative cerebral blood flow maps using pseudo-continuous arterial spin labeling and single photon emission computed tomography. NMR Biomed. 2012;25:779–786. doi: 10.1002/nbm.1792. [DOI] [PMC free article] [PubMed] [Google Scholar]
- 41.Tohgi H, Yonezawa H, Takahashi S, Sato N, Kato E, Kudo M, Hatano K, Sasaki T. Cerebral blood flow and oxygen metabolism in senile dementia of Alzheimer’s type and vascular dementia with deep white matter changes. Neuroradiology. 1998;40:131–137. doi: 10.1007/s002340050553. [DOI] [PubMed] [Google Scholar]
- 42.Grimmer T, Faust M, Auer F, Alexopoulos P, Forstl H, Henriksen G, Perneczky R, Sorg C, Yousefi BH, Drzezga A, Kurz A. White matter hyperintensities predict amyloid increase in Alzheimer’s disease. Neurobiol Aging. 2012;33:2766–2773. doi: 10.1016/j.neurobiolaging.2012.01.016. [DOI] [PubMed] [Google Scholar]
- 43.Villemagne VL, Ong K, Mulligan RS, Holl G, Pejoska S, Jones G, O’Keefe G, Ackerman U, Tochon-Danguy H, Chan JG, Reininger CB, Fels L, Putz B, Rohde B, Masters CL, Rowe CC. Amyloid imaging with (18)F-florbetaben in Alzheimer disease and other dementias. J Nucl Med. 2011;52:1210–1217. doi: 10.2967/jnumed.111.089730. [DOI] [PubMed] [Google Scholar]
- 44.Rowe CC, Ellis KA, Rimajova M, Bourgeat P, Pike KE, Jones G, Fripp J, Tochon-Danguy H, Morandeau L, O’Keefe G, Price R, Raniga P, Robins P, Acosta O, Lenzo N, Szoeke C, Salvado O, Head R, Martins R, Masters CL, Ames D, Villemagne VL. Amyloid imaging results from the Australian imaging, Biomarkers and Lifestyle (AIBL) study of aging. Neurobiol Aging. 2010;31:1275–1283. doi: 10.1016/j.neurobiolaging.2010.04.007. [DOI] [PubMed] [Google Scholar]
- 45.Vandenberghe R, Van Laere K, Ivanoiu A, Salmon E, Bastin C, Triau E, Hasselbalch S, Law I, Andersen A, Korner A, Minthon L, Garraux G, Nelissen N, Bormans G, Buckley C, Owenius R, Thurfjell L, Farrar G, Brooks DJ. 18F-flutemetamol amyloid imaging in Alzheimer disease and mild cognitive impairment: a phase 2 trial. Ann Neurol. 2010;68:319–329. doi: 10.1002/ana.22068. [DOI] [PubMed] [Google Scholar]
- 46.Wong DF, Rosenberg PB, Zhou Y, Kumar A, Raymont V, Ravert HT, Dannals RF, Nandi A, Brasi JR, Ye W, Hilton J, Lyketsos C, Kung HF, Joshi AD, Skovronsky DM, Pontecorvo MJ. In vivo imaging of amyloid deposition in Alzheimer disease using the radioligand 18F-AV-45 (florbetapir F 18) J Nucl Med. 2010;51:913–920. doi: 10.2967/jnumed.109.069088. [DOI] [PMC free article] [PubMed] [Google Scholar]
- 47.Villemagne VL, Mulligan RS, Pejoska S, Ong K, Jones G, O’Keefe G, Chan JG, Young K, Tochon-Danguy H, Masters CL, Rowe CC. Comparison of 11C-PiB and 18F-florbetaben for Aβ imaging in ageing and Alzheimer’s disease. Eur J Nucl Med Mol Imaging. 2012;39:983–989. doi: 10.1007/s00259-012-2088-x. [DOI] [PubMed] [Google Scholar]
- 48.Stankoff B, Freeman L, Aigrot MS, Chardain A, Dollé F, Williams A, Galanaud D, Armand L, Lehericy S, Lubetzki C, Zalc B, Bottlaender M. Imaging central nervous system myelin by positron emission tomography in multiple sclerosis using [methyl-11C]-2-(4′-methylaminophenyl)-6-hydroxybenzothiazole. Ann Neurol. 2011;69:673–680. doi: 10.1002/ana.22320. [DOI] [PubMed] [Google Scholar]
- 49.Wu C, Wei J, Tian D, Feng Y, Miller RH, Wang Y. Molecular probes for imaging myelinated white matter in CNS. J Med Chem. 2008;51:6682–6688. doi: 10.1021/jm8003637. [DOI] [PMC free article] [PubMed] [Google Scholar]
- 50.Wu C, Wang C, Popescu DC, Zhu W, Somoza EA, Zhu J, Condie AG, Flask CA, Miller RH, Macklin W, Wang Y. A novel PET marker for in vivo quantification of myelination. Bioorg Med Chem. 2010;18:8592–8599. doi: 10.1016/j.bmc.2010.10.018. [DOI] [PMC free article] [PubMed] [Google Scholar]
- 51.Wolk DA, Grachev ID, Buckley C, Kazi H, Grady MS, Trojanowski JQ, Hamilton RH, Sherwin P, McLain R, Arnold SE. Association between in vivo fluorine 18-labeled flutemetamol amyloid positron emission tomography imaging and in vivo cerebral cortical histopathology. Arch Neurol. 2011;68:1398–1403. doi: 10.1001/archneurol.2011.153. [DOI] [PMC free article] [PubMed] [Google Scholar]
- 52.Clark CM, Schneider JA, Bedell BJ, Beach TG, Bilker WB, Mintun MA, Pontecorvo MJ, Hefti F, Carpenter AP, Flitter ML, Krautkramer MJ, Kung HF, Coleman RE, Doraiswamy PM, Fleisher AS, Sabbagh MN, Sadowsky CH, Reiman EM, Zehntner SP, Skovronsky DM for the AV45-A07 Study Group. Use of florbetapir-PET for imaging β-amyloid pathology. JAMA. 2011;305:275–283. doi: 10.1001/jama.2010.2008. [DOI] [PMC free article] [PubMed] [Google Scholar]
- 53.Ikonomovic MD, Klunk WE, Abrahamson EE, Mathis CA, Price JC, Tsopelas ND, Lopresti BJ, Ziolko S, Bi W, Paljug WR, Debnath ML, Hope CE, Isanski BA, Hamilton RL, DeKosky ST. Post-mortem correlates of in vivo PiB-PET amyloid imaging in a typical case of Alzheimer’s disease. Brain. 2008;131:1630–1645. doi: 10.1093/brain/awn016. [DOI] [PMC free article] [PubMed] [Google Scholar]
- 54.Kadir A, Marutle A, Gonzalez D, Schöll M, Almkvist O, Mousavi M, Mustafiz T, Darreh-Shori T, Nennesmo I, Nordberg A. Positron emission tomography imaging and clinical progression in relation to molecular pathology in the first Pittsburgh Compound B positron emission tomography patient with Alzheimer’s disease. Brain. 2011;134:301–317. doi: 10.1093/brain/awq349. [DOI] [PMC free article] [PubMed] [Google Scholar]
- 55.Kantarci K, Yang C, Schneider JA, Senjem ML, Reyes DA, Lowe VJ, Barnes LL, Aggarwal NT, Bennett DA, Smith GE, Petersen RC, Jack CR, Jr, Boeve BF. Ante mortem amyloid imaging and β-amyloid pathology in a case with dementia with Lewy bodies. Neurobiol Aging. 2010;33:878–885. doi: 10.1016/j.neurobiolaging.2010.08.007. [DOI] [PMC free article] [PubMed] [Google Scholar]
- 56.Gurol ME, Dierksen G, Betensky R, Gidicsin C, Halpin A, Becker A, Carmasin J, Ayres A, Schwab K, Viswanathan A, Salat D, Rosand J, Johnson KA, Greenberg SM. Predicting sites of new hemorrhage with amyloid imaging in cerebral amyloid angiopathy. Neurology. 2012;79:320–326. doi: 10.1212/WNL.0b013e31826043a9. [DOI] [PMC free article] [PubMed] [Google Scholar]
- 57.Johnson KA, Gregas M, Becker JA, Kinnecom C, Salat DH, Moran EK, Smith EE, Rosand J, Rentz DM, Klunk WE, Mathis CA, Price JC, Dekosky ST, Fischman AJ, Greenberg SM. Imaging of amyloid burden and distribution in cerebral amyloid angiopathy. Ann Neurol. 2007;62:229–234. doi: 10.1002/ana.21164. [DOI] [PubMed] [Google Scholar]
- 58.Lockhart A, Lamb JR, Osredkar T, Sue LI, Joyce JN, Ye L, Libri V, Leppert D, Beach TG. PIB is a non-specific imaging marker of amyloid-beta (Abeta) peptide-related cerebral amyloidosis. Brain. 2007;130:2607–2615. doi: 10.1093/brain/awm191. [DOI] [PubMed] [Google Scholar]
- 59.Han BH, Zhou M, Vellimana AK, Milner E, Kim DH, Greenberg JK, Chu W, Mach RH, Zipfel GJ. Resorufin analogs preferentially bind cerebrovascular amyloid: potential use as imaging ligands for cerebral amyloid angiopathy. Mol Neurodegener. 2011;6:86. doi: 10.1186/1750-1326-6-86. [DOI] [PMC free article] [PubMed] [Google Scholar]
- 60.Sojkova J, Driscoll I, Iacono D, Zhou Y, Codispoti KE, Kraut MA, Ferrucci L, Pletnikova O, Mathis CA, Klunk WE, O’Brien RJ, Wong DF, Troncoso JC, Resnick SM. In vivo fibrillar beta-amyloid detected using [11C]PiB positron emission tomography and neuropathologic assessment in older adults. Arch Neurol. 2011;68:232–240. doi: 10.1001/archneurol.2010.357. [DOI] [PMC free article] [PubMed] [Google Scholar]
- 61.Svedberg MM, Hall H, Hellström-Lindahl E, Estrada S, Guan Z, Nordberg A, Långström B. [(11)C]PIB-amyloid binding and levels of Abeta40 and Abeta42 in postmortem brain tissue from Alzheimer patients. Neurochem Int. 2009;54:347–357. doi: 10.1016/j.neuint.2008.12.016. [DOI] [PubMed] [Google Scholar]
- 62.Ikonomovic MD, Abrahamson EE, Price JC, Hamilton RL, Mathis CA, Paljug WR, Debnath ML, Cohen AD, Mizukami K, DeKosky ST, Lopez OL, Klunk WE. Early AD pathology in a [C-11]PiB-negative case: a PiB-amyloid imaging, biochemical, and immunohistochemical study. Neuropathol. 2012;123:433–447. doi: 10.1007/s00401-012-0943-2. [DOI] [PMC free article] [PubMed] [Google Scholar]
- 63.Ringman JM, Teplow DB, Villemagne VI. The exception makes the rule. Not all Aβ plaques are created equal. Neurology. 2012;79:206–207. doi: 10.1212/WNL.0b013e31825fe11f. [DOI] [PubMed] [Google Scholar]
- 64.Klunk WE, Lopresti BJ, Ikonomovic MD, Lefterov IM, Koldamova RP, Abrahamson EE, Debnath ML, Holt DP, Huang GF, Shao L, DeKosky ST, Price JC, Mathis CA. Binding of the positron emission tomography tracer Pittsburgh compound-B reflects the amount of amyloid-beta in Alzheimer’s disease brain but not in transgenic mouse brain. J Neurosci. 2005;25:10598–10606. doi: 10.1523/JNEUROSCI.2990-05.2005. [DOI] [PMC free article] [PubMed] [Google Scholar]
- 65.Rosen RF, Walker LC, Levine H., 3rd PIB binding in aged primate brain: enrichment of high-affinity sites in humans with Alzheimer’s disease. Neurobiol Aging. 2011;32:223–234. doi: 10.1016/j.neurobiolaging.2009.02.011. [DOI] [PMC free article] [PubMed] [Google Scholar]
- 66.Leinonen V, Alafuzoff I, Aalto S, Suotunen T, Savolainen S, Någren K, Tapiola T, Pirttilä T, Rinne J, Jääskeläinen JE, Soininen H, Rinne JO. Assessment of beta-amyloid in a frontal cortical brain biopsy specimen and by positron emission tomography with carbon 11-labeled Pittsburgh Compound B. Arch Neurol. 2008;65:1304–1309. doi: 10.1001/archneur.65.10.noc80013. [DOI] [PubMed] [Google Scholar]
- 67.Cairns NJ, Ikonomovic MD, Benzinger T, Storandt M, Fagan AM, Shah AR, Reinwald LT, Carter D, Felton A, Holtzman DM, Mintun MA, Klunk WE, Morris JC. Absence of Pittsburgh compound B detection of cerebral amyloid beta in a patient with clinical, cognitive, and cerebrospinal fluid markers of Alzheimer disease: a case report. Arch Neurol. 2009;66:1557–1562. doi: 10.1001/archneurol.2009.279. [DOI] [PMC free article] [PubMed] [Google Scholar]
- 68.Burack MA, Hartlein J, Flores HP, Taylor-Reinwald L, Perlmutter JS, Cairns NJ. In vivo amyloid imaging in autopsy-confirmed Parkinson disease with dementia. Neurology. 2010;74:77–84. doi: 10.1212/WNL.0b013e3181c7da8e. [DOI] [PMC free article] [PubMed] [Google Scholar]
- 69.Villemagne VL, McLean CA, Reardon K, Boyd A, Lewis V, Klug G, Jones G, Baxendale D, Masters CL, Rowe CC, Collins SJ. 11C-PiB PET studies in typical sporadic Creutzfeldt-Jakob disease. J Neurol Neurosurg Psychiatry. 2009;80:998–1001. doi: 10.1136/jnnp.2008.171496. [DOI] [PubMed] [Google Scholar]
- 70.Shin J, Kepe K, Small GW, Phelps ME, Barrio JR. Multimodal imaging of Alzheimer pathophysiology in the brain’s default mode network. Int J Alzheimers Dis. 2011;2011:687945. doi: 10.4061/2011/687945. [DOI] [PMC free article] [PubMed] [Google Scholar]
- 71.Arnold SE, Hyman BT, Flory J, Damasio AR, Van Hoesen GW. The topographical and neuroanatomical distribution of neurofibrillary tangles and neuritic plaques in the cerebral cortex of patients with Alzheimer’s disease. Cereb Cortex. 1991;1:103–116. doi: 10.1093/cercor/1.1.103. [DOI] [PubMed] [Google Scholar]
- 72.Price JL, Morris JC. Tangles and plaques in nondemented aging and “preclinical” Alzheimer’s disease. Ann Neurol. 1999;45:358–368. doi: 10.1002/1531-8249(199903)45:3<358::aid-ana12>3.0.co;2-x. [DOI] [PubMed] [Google Scholar]
- 73.Cupidi C, Capobianco R, Goffredo D, Marcon G, Ghetti B, Bugiani O, Tagliavini F, Giaccone G. Neocortical variation of Abeta load in fully expressed, pure Alzheimer’s disease. J Alzheimers Dis. 2010;19:57–68. doi: 10.3233/JAD-2010-1205. [DOI] [PubMed] [Google Scholar]
- 74.Mintun MA, Larossa GN, Sheline YI, Dence CS, Lee SY, Mach RH, Klunk WE, Mathis CA, DeKosky ST, Morris JC. [11C]PIB in a nondemented population: potential antecedent marker of Alzheimer disease. Neurology. 2006;67:446–452. doi: 10.1212/01.wnl.0000228230.26044.a4. [DOI] [PubMed] [Google Scholar]
- 75.Ziolko SK, Weissfeld LA, Klunk WE, Mathis CA, Hoge JA, Lopresti BJ, DeKosky ST, Price JC. Evaluation of voxel-based methods for the statistical analysis of PIB PET amyloid imaging studies in Alzheimer’s disease. Neuroimage. 2006;33:94–102. doi: 10.1016/j.neuroimage.2006.05.063. [DOI] [PubMed] [Google Scholar]
- 76.Kemppainen NM, Aalto S, Wilson IA, Någren K, Helin S, Brück A, Oikonen V, Kailajärvi M, Scheinin M, Viitanen M, Parkkola R, Rinne JO. PET amyloid ligand [11C]PIB uptake is increased in mild cognitive impairment. Neurology. 2007;68:1603–1606. doi: 10.1212/01.wnl.0000260969.94695.56. [DOI] [PubMed] [Google Scholar]
- 77.Ly JV, Rowe CC, Villemagne VL, Zavala JA, Ma H, Sahathevan R, O’Keefe G, Gong SJ, Gunawan R, Churilov L, Saunder T, Ackerman U, Tochon-Danguy H, Donnan GA. Subacute ischemic stroke is associated with focal 11C PiB positron emission tomography retention but not with global neocortical Aβ deposition. Stroke. 2012;43:1341–1346. doi: 10.1161/STROKEAHA.111.636266. [DOI] [PubMed] [Google Scholar]
- 78.Bengel FM, Minoshima S. 2012 SNM highlights lectures. J Nucl Med. 2012;53:15N–31N. [PubMed] [Google Scholar]
- 79.Cole GB, Keum G, Liu J, Small GW, Satyamurthy N, Kepe V, Barrio JR. Specific estrogen sulfotransferase (SULT1E1) substrates and molecular imaging probe candidates. Proc Natl Acad Sci U S A. 2010;107:6222–6227. doi: 10.1073/pnas.0914904107. [DOI] [PMC free article] [PubMed] [Google Scholar]
- 80.Miki Y, Nakata T, Suzuki T, Darnel AD, Moriya T, Kaneko C, Hidaka K, Shiotsu Y, Kusaka H, Sasano H. Systemic distribution of steroid sulfatase and estrogen sulfotransferase in human adult and fetal tissues. J Clin Endocrinol Metab. 2002;87:5760–5768. doi: 10.1210/jc.2002-020670. [DOI] [PubMed] [Google Scholar]
- 81.Mathis CA, Holt DP, Wang Y, Huang GF, Debnath ML, Shao L, Klunk WE. Species-dependent metabolism of the amyloid imaging agent [C-11]PIB. J Nucl Med. 2004;45(Suppl):114P. [Google Scholar]
- 82.Cselényi Z, Jönhagen ME, Forsberg A, Halldin C, Julin P, Schou M, Johnström P, Varnäs K, Svensson S, Farde L. Clinical validation of 18F-AZD4694, an amyloid-β-specific PET radioligand. J Nucl Med. 2012;53:415–424. doi: 10.2967/jnumed.111.094029. [DOI] [PubMed] [Google Scholar]
- 83.Klunk WE, Wang Y, Huang GF, Debnath ML, Holt DP, Shao L, Hamilton RL, Ikonomovic MD, DeKosky ST, Mathis CA. The binding of 2-(4′-methylaminophenyl)benzothiazole to postmortem brain homogenates is dominated by the amyloid component. J Neurosci. 2003;23:2086–2092. doi: 10.1523/JNEUROSCI.23-06-02086.2003. [DOI] [PMC free article] [PubMed] [Google Scholar]
- 84.Neumaier B, Deisenhofer S, Fürst D, von Arnim CA, Thees S, Buck AK, Glatting G, Landwehrmeyer GB, Krause BJ, Müller HD, Sommer C, Reske SN, Mottaghy FM. Radiosynthesis and evaluation of [11C]BTA-1 and [11C]3′-Me-BTA-1 as potential radiotracers for in vivo imaging of beta-amyloid plaques. Nuklearmedizin. 2007;46:271–280. [PubMed] [Google Scholar]
- 85.Jack CR, Jr, Knopman DS, Jagust WJ, Petersen RC, Weiner MW, Aisen PS, Shaw LM, Vemuri P, Wiste HJ, Weigand SD, Lesnick TG, Pankratz VS, Donohue MC, Trojanowski JQ. Tracking pathophysiological processes in Alzheimer’s disease: an updated hypothetical model of dynamic biomarkers. Lancet Neurol. 2013;12:207–216. doi: 10.1016/S1474-4422(12)70291-0. [DOI] [PMC free article] [PubMed] [Google Scholar]