
Fig. 5.
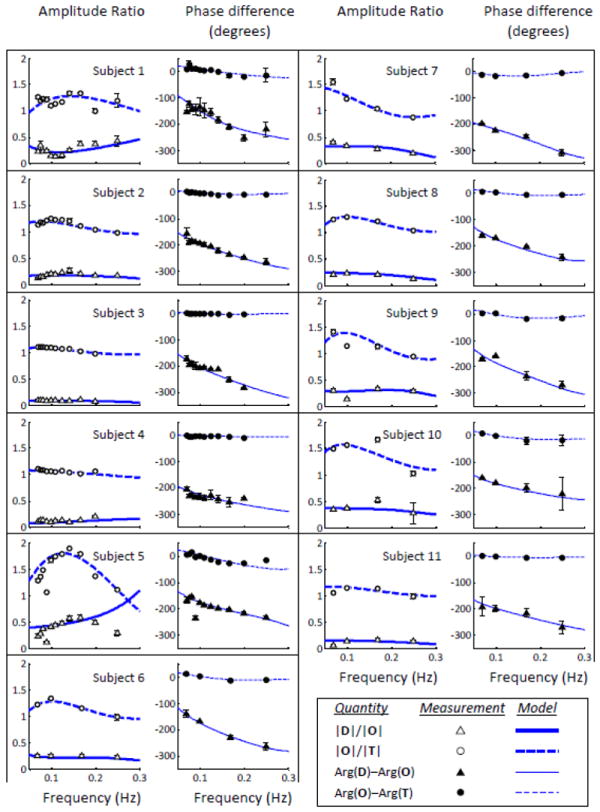
Measured CHS spectra on the forehead of all eleven subjects (symbols), and best fits with the hemodynamic model (lines) for all eleven subjects. For each subject, the left panel shows the amplitude ratio spectra (|O|/|T| and |D|/|O|), and the right panel shows the phase difference spectra (Arg(O)-Arg(T) and Arg(D)-Arg(O)).