

Abstract
Objectives. We sought to quantify how socioeconomic, health care, demographic, and geographic effects explain racial disparities in low birth weight (LBW) and preterm birth (PTB) rates in Brazil.
Methods. We employed a sample of 8949 infants born between 1995 and 2009 in 15 cities and 7 provinces in Brazil. We focused on disparities in LBW (< 2500 g) and PTB (< 37 gestational weeks) prevalence between infants of African ancestry alone or African mixed with other ancestries, and European ancestry alone. We used a decomposition model to quantify the contributions of conceptually relevant factors to these disparities.
Results. The model explained 45% to 94% of LBW and 64% to 94% of PTB disparities between the African ancestry groups and European ancestry. Differences in prenatal care use and geographic location were the most important contributors, followed by socioeconomic differences. The model explained the majority of the disparities for mixed African ancestry and part of the disparity for African ancestry alone.
Conclusions. Public policies to improve children’s health should target prenatal care and geographic location differences to reduce health disparities between infants of African and European ancestries in Brazil.
Large health disparities exist between Black and White infants in Brazil.1−4 Infant mortality is more than twice as common among Black as White infants in Southern Brazil (30.4 vs 13.9 per 1000).5 Poor birth outcomes including low birth weight (LBW) and preterm birth (PTB) are also more common among Black infants. Racial disparities are also reported in prenatal and postnatal care, with White mothers having more and higher-quality prenatal visits and greater use of postnatal care.6,7
Documenting the prevalence and magnitude of racial disparities in infant’s and children’s health is important. However, of more importance is explaining these disparities and identifying the pathways through which they arise to identify contributors that can be targeted by policy interventions. Such effort has lifelong implications because of the importance of children’s health for adult health and human capital attainment.8−12 Because children’s health may have multiplicative effects on health over life, early health disparities may extend into large health and human capital disparities later in life.13,14
Studies in the United States have shed light on several pathways that lead to racial disparities in infant’s and children’s health.15−21 Individual-level factors including socioeconomic status (SES),22 maternal age, prenatal care use,22−24 and stressful life events before delivery,17 as well as differences in health care access and quality25−27 and social inequalities because of residential segregation and poverty,15,28,29 are thought to be important contributors to racial disparities in infants’ health in the United States.
To our knowledge, there are no studies that simultaneously quantify the contributions of a large number of conceptually relevant factors to racial disparities in infants’ health in Brazil. In this study, we examined the extent to which socioeconomic, health care, demographic, and geographic effects explain disparities in LBW (< 2500 grams) and PTB (< 37 gestational weeks) rates by African ancestry in Brazil. Unlike any previous study for Brazil, we evaluated the contributions of the explanatory factors to the disparities by different degrees of African ancestry. We focused on disparities by African ancestry because they are the most prevalent and affect a large percentage of the Brazilian population.1−5
Our study is the first to simultaneously quantify the contributions of several factors both as a group and each on its own (with control for the others) to explaining racial disparities in infant health in Brazil. Such a study is needed not only because Brazil is the largest country in South America but also because there are many historical, demographic, economic, social, cultural, and health care system differences between Brazil and other racially admixed countries such as the United States. These differences limit the generalizability of studies of racial infant health disparities in the United States to the Brazilian population as these differences may modify the underlying factors and the extent of their contributions to the disparities.
There is a sharp contrast in perception of race between Brazil and the United States.30 Race for individuals of African and European ancestry in Brazil has been historically and socially defined on a “continuum” of skin color including Black, Brown (mixed between Black and White), or White, instead of the Black or White color line as in the United States. This is in part because of the large racial admixing in Brazil.31 The difference in perceptions of racial identity between Brazil and the United States implies potential differences in cultural and socioeconomic factors related to race and how these may affect health and contribute to racial disparities. Brazil also differs significantly in its economic growth and extent of economic disparities by race from the United States.32 Finally, there are major differences in access to and quality of health care between Brazil and the United States.33,34 For all of these reasons, a study that explains the racial disparities in LBW and PTB in Brazil is needed to draw inferences that can help to inform policymaking and interventions to reduce these disparities in that country.
METHODS
We employed a unique sample of 8949 singleton live births between 1995 and 2009 in 7 provinces, 15 cities, and 25 hospitals in Brazil. The sample was identified by the Latin American Collaborative Study of Congenital Malformations (ECLAMC) epidemiological research and surveillance program for birth defects in South America.35,36 The ECLAMC study involves a voluntary collaboration with a network of hospitals and health professionals (mostly pediatricians). The health professionals enroll into ECLAMC infants born in their hospitals with and without birth defects before discharge after birth. For each infant with a birth defect, ECLAMC professionals match an unaffected infant by birth date, sex, and hospital of birth. All infants are recruited with the same criteria and data are systematically collected by using the same questionnaires across all affiliated hospitals.
The ECLAMC professionals obtain data on infant health, prenatal history, and several demographic and socioeconomic characteristics by interviewing mothers before discharge and through abstraction of hospital records as needed. The ECLAMC professionals receive the same standard training before initiating data collection and attend annual group meetings organized by ECLAMC, which is expected to enhance the quality and consistency of data collection. The data from ECLAMC have been used in several previous studies of infant health.36−39 A detailed description of ECLAMC is available elsewhere.35
We only included infants without birth defects who represented the majority of the infant population as birth defects increase LBW and PTB risks37,40 and may modify the underlying etiology of racial disparities. Even though our study sample was not randomly selected from the total birth population, there are several factors that suggest that it is representative of a large proportion of the population. Because there are no inclusion criteria into ECLAMC for unaffected infants that are related to infant health (LBW and PTB) and the study explanatory variables, the sample is unlikely to be biased. Even though infants without birth defects enrolled in ECLAMC were matched to the affected infants by sex and birth date, birth defects are not related to birth date and only few of them vary slightly by sex. Indeed, the male-to-female ratio in our study sample is close to that of the Brazilian birth population (1.2 vs 1.05).31 Also, ECLAMC has a high infant-participation rate, with about 95% of infants without birth defects identified to participate enrolling in the program (e-mail communication, E. Castilla, ECLAMC Coordinator, Iowa City, IA, December 4, 2009). Furthermore, there are no barriers or inclusion or exclusion criteria for hospitals and pediatricians to join ECLAMC, which is built on a voluntary participation model. Also, ECLAMC hospitals serve geographically and socioeconomically diverse communities as reflected in the sample’s variation of these characteristics, which further enhances the sample’s representativeness and generalizability of results.
We limited the sample to infants with birth weights between 500 grams and 6000 grams and gestational ages between 19.5 weeks and 46.5 weeks. These restrictions are standard in this literature to avoid data-recording errors (most babies below the minimum thresholds are stillbirths). This resulted in 10 777 infants out of 10 928 initial observations. The 8949 infants included in our analysis are those with no missing values for any of the variables used.
Study Measures and Empirical Model
Similar to in the United States, race is a social construct in Brazil. However, measuring race is complicated particularly in Brazil because of the large admixture of multiple ancestries.30 The fact that race is perceived in Brazil on a color continuum instead of on the White–Black line such as in the United States and the lack of clearly defined racial color lines makes racial identification flexible and varying.29,41 As a result, race in Brazil is arguably more accurately measured on the basis of self-report because such a measure will reflect the perceived social identity of the individual.29,42,43 Race or color is reported in the Brazilian Census under one of the following categories: Black, White, Brown, Yellow, or Indigenous.32 Because we focused on disparities between Black and White infants, the 3 categories of a skin-color–based measure of race that were most related to our analysis were White, Brown, and Black.
The ECLAMC study does not ask about skin color, but obtains a related measure, which is ethnic ancestry. Mothers were asked to report all the ethnic ancestries of the child including mainly African, European, Native, and other minority groups. Therefore, multiple ancestries were reported for children who had admixed race/ethnicity. This measure allows for creating an ethnic ancestry continuum to represent different racial/ethnic groups.
We studied 3 groups of African ancestries—African-only (AO), African–European (AE), and African–non-European (ANE)—and a group of European-only (EO) ancestry. The AO group indicated that the mother reported that the child has African ancestry without any other ancestry. Although we did not observe a skin-color–based measure of race, we expected the AO group to mostly include individuals who would self-identify as Black. The AE group indicated that both African and European ancestries were reported, but no other ancestries. The ANE group indicated that both African and other non-European ancestries were reported, but no European ancestry. We expected both the AE and ANE groups to mostly include individuals who would self-identify as Brown based on the skin-color race measure used in the Brazilian Census. The EO group included children for whom only European ancestry was reported and we expected it to mostly include individuals who would self-identify as White. Therefore, our measure of ethnic ancestry was consistent with perceptions of race in Brazil and accommodates the flexibility of its racial identity continuum. This measure has been used in several previous studies of infant and maternal health in Brazil including studies of racial disparities.33,40,44,45 We separately compared each of the 3 African-ancestry groups to the EO group because the contributions of the evaluated explanatory variables to racial disparities may vary among these groups.
We employed a multivariate model for infant health that included several theoretically relevant demographic, socioeconomic, health care, and geographic effects. The underlying pathways for disparities are complex and multilevel including both individual- and geographic-level effects.16,46−48 Recognizing this complexity is essential for explaining disparities. Given that our goal was to simultaneously quantify the extent to which several variables explained the observed racial disparities and to explain as much of these disparities as possible, we did not limit our conceptual framework to a single theory for health determinants or disparities. Relying on a single existing theory to specify our model would have significantly hindered our study goal.
Instead, our selection of explanatory variables was motivated by several theories for determinants of health and racial disparities and by results from previous studies that have highlighted an important role for these variables. We appealed to general microeconomic and psychosocial theories that highlight the importance of education, prenatal care, geographic location, and residential segregation, and other factors for children’s health and racial disparities16,22,46,47,49−53 and to previous studies22,36,37,40,54−60 when possible for selecting conceptually relevant explanatory variables. We chose the following model:
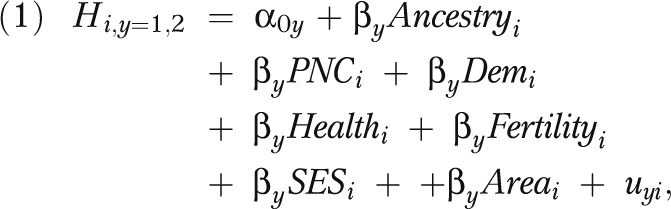 |
where for child i, H is health measured by either LBW (y = 1) or PTB (y = 2) and is a function of child ancestry (Ancestry), prenatal care (PNC), demographic characteristics (Dem), maternal health (Health), maternal fertility (Fertility), socioeconomic status (SES), and geographic effects (Area); u is the error term.
We measured prenatal care by the number of prenatal visits. Several studies have highlighted the importance of prenatal care for LBW and PTB.36,40,55,56,61 Notable disparities in the number and quality of prenatal care visits exist between White and Black or mixed-race women in Brazil.5,6,62,63 Demographic characteristics include a binary indicator for infant sex, continuous maternal and paternal age variables, and age squared. In addition to their direct effects on infant health (especially in the case of infant’s sex and maternal age), these characteristics also influence parental health preferences and behaviors.12,64 Because we did not have a direct measure of marital status, which is relevant for LBW and PTB,65 we included length of parents’ cohabitation before child’s birth as a proxy similar to previous studies.66 A number of studies have found that cohabitation status58,60 and cohabitation length59 are associated with a decrease in LBW and fetal death in Brazil. Maternal health and fertility history are relevant for LBW and PTB and affect maternal health behaviors as shown in several previous studies.34,38,40,45,67 These were measured by indicators for acute and chronic illnesses during pregnancy, history of conception difficulty, and numbers of previous live births and miscarriages or stillbirths.
We also included family SES measured by mother’s and father’s education and employment or occupational status. Parental education and SES may affect infant health in several ways including by increasing the health benefit that the mother obtains from prenatal care through enhanced information processing and greater compliance with treatment plans, improving psychosocial status and social networking, improving maternal health and health behavior, and increasing access to health care.12,53 Many studies reported a positive association between maternal education and infant health in Brazil.40,49,68,69 Maternal occupation may also influence infant health through several indirect pathways such as by affecting income and maternal time for health investments, but also through occupational or environmental exposures.70−73
We also included geographic location represented by binary indicators for the city of child’s birth to evaluate the contribution of geographic effects to racial disparities in infant health, which may result from differences in residential distribution by race and geographic variation in health care availability and quality, economic growth, and social infrastructure. Residential segregation may affect health by reducing access to social, economic, health care, and environmental resources needed for maternal and infant health.74,75 Several studies have highlighted adverse consequences for infant health from reductions in the quality of the physical and socioeconomic environments in Brazil including from pollution,76 poverty concentration,77 and residence in the Northeast region.78−80
We estimated equation 1 by using logistic regression separately for each of the 3 African ancestry groups compared with EO infants. We adjusted the standard errors for nonindependence across the city of birth by using a Huber-type robust variance estimator.81 We also estimated a nested-specification of equation 1 that only included the ancestry indicator to evaluate the total racial disparity in LBW and PTB.
Disparity Decomposition
Although comparing the ancestry effects on infant health between the full and nested specifications for equation 1 allows for evaluating the extent to which all model variables as a group explain the racial disparities, this comparison does not quantify the individual variable contributions. Such decomposition is needed to identify the factors that are most relevant for explaining these disparities. We employed the Fairlie decomposition model82 to quantify the contributions of the model explanatory variables to the racial disparities in LBW and PTB. This model is an extension of the Oaxaca–Blinder decomposition model to nonlinear models for binary outcomes and has been successfully applied in previous studies.33,54,83,84 The model identifies the extent to which differences in a particular characteristic between 2 groups explains the difference in their outcomes, and has been previously used to explain racial health disparities in other contexts.33,54
For each racial comparison (e.g., AO vs EO), the model first estimated equation 1. Because the sample sizes for the 2 ancestry groups were different, the model randomly selected a subsample from the majority group equal in size to the minority group. From equation 1, we predicted outcome (e.g., LBW) probabilities for each observation in the minority sample and majority subsample. Within each group, the observations were ranked by their probability, and the observations were then matched 1-to-1 between the 2 groups by their rank. One at a time for each explanatory variable in equation 1, the model substituted the variable value of each observation in the minority group by that of the matched observation from the majority subsample. By using equation 2, the model then estimated the contribution (C) of variable k to the outcome difference between the 2 groups as follows:
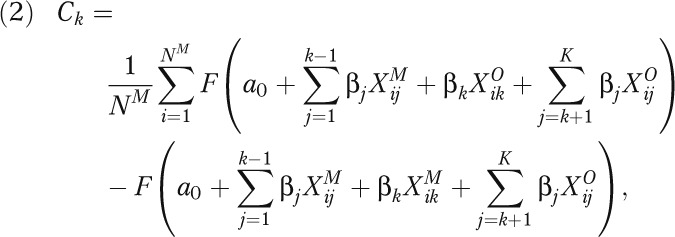 |
where M and O indicate minority and majority groups, respectively, j indicates the variable order (1 to K), NM is the number of individuals in the minority group, and F is the cumulative density function. The model was repeated for all variables in the model (last evaluated variable was of order K).
We first decomposed the LBW and PTB disparities over categories of conceptually related variables as defined in equation 1 by using the same steps listed previously. We ordered the categories of variables (instead of individual variables) and switched the values of all variables within the same category simultaneously between the majority and minority observations. Then, we repeated the decomposition over each variable (instead of over variable categories) to identify variables within categories that were most relevant for these disparities.
Because results may change with the particular selected majority subsample, we performed 2000 random subsample selections and averaged the results across these replications.82 Also, because the variable (or category) order j in the model could affect results, we randomly selected this order at the time of majority subsample selection, which provided an approximation of all possible orders.
RESULTS
Table 1 shows the variable distributions in the study sample. About 9%, 51%, and 17% were AO, AE, and ANE, respectively. The LBW and PTB rates were 12.4% and 18.9%, respectively, for infants of any African ancestry compared with 8.1% and 15% for EO infants. The LBW and PTB rates were overall comparable among the 3 African ancestry groups. There were several differences in the explanatory variables among the ancestry groups. The average number of prenatal visits was 5.9, 6.5, 7.0, and 6.8 among AO, AE, ANE, and EO ancestries, respectively. Conception difficulty and number of previous live births were highest among AO ancestry, and the rate of chronic illness was highest among ANE ancestry. Educational attainment was highest among EO ancestry.
TABLE 1—
Descriptive Statistics for Study Variables by Ancestry: Brazil, 1995–2009
| African-Only Ancestry (n = 827) |
African–Non-European Mixed Ancestry (n = 1514) |
African–European Mixed Ancestry (n = 4583) |
European-Only Ancestry (n = 2025), Mean (SD) or % | ||||
| Variable | Mean (SD) or % | P | Mean (SD) or % | P | Mean (SD) or % | P | |
| Prenatal care visits, no. | 5.9 (2.6) | < .001 | 7.0 (2.6) | .008 | 6.5 (2.4) | < .001 | 6.8 (2.2) |
| Infant characteristics | |||||||
| Low birth weight (< 2500 g) | 12.1 | .001 | 12.2 | < .001 | 12.8 | < .001 | 8.10 |
| Preterm birth (< 37 wk of gestation) | 18.6 | .016 | 19.6 | .001 | 18.4 | .001 | 15.0 |
| Female infants | 46.1 | .239 | 48.0 | .011 | 44.3 | .653 | 43.7 |
| Maternal demographics | |||||||
| Acute illnesses | 45.7 | .001 | 48.8 | .005 | 43.9 | < .001 | 53.5 |
| Chronic illnesses | 14.9 | .756 | 18.0 | .004 | 15.6 | .227 | 14.4 |
| Conception difficulty | 15.2 | .007 | 10.6 | .389 | 7.64 | < .001 | 11.6 |
| Number of live births | 1.67 (2.11) | < .001 | 1.33 (1.92) | .028 | 1.30 (2.04) | .047 | 1.20 (1.78) |
| Number of spontaneous stillbirths | 0.296 (0.819) | .966 | 0.302 (0.803) | .796 | 0.298 (0.855) | .877 | 0.295 (0.798) |
| Age 13–49 y | 25.40 (6.68) | .169 | 26.19 (6.90) | .072 | 25.28 (6.64) | .006 | 25.77 (6.58) |
| Age 13–49 y squared | 689.69 (366.51) | .232 | 733.32 (384.62) | .043 | 683.34 (362.66) | .012 | 707.67 (363.95) |
| Cohabitation length | 1.85 (3.69) | .002 | 1.74 (3.65) | .006 | 1.61 (3.41) | .034 | 1.42 (3.37) |
| Maternal educationa | |||||||
| No schooling and cannot read | 1.69 | .001 | 1.39 | .003 | 1.11 | .008 | 0.44 |
| Primary school complete | 12.8 | .004 | 13.5 | .003 | 14.7 | .008 | 17.2 |
| Secondary school incomplete | 16.2 | .444 | 16.1 | .391 | 15.7 | .531 | 15.1 |
| Secondary school complete | 18.7 | .001 | 20.9 | .009 | 21.6 | .006 | 24.7 |
| University incomplete | 0.85 | .001 | 1.98 | .007 | 1.99 | .001 | 3.51 |
| University complete | 0.73 | < .001 | 2.97 | .006 | 3.08 | .001 | 4.79 |
| Maternal occupationb | |||||||
| Unemployed | 5.80 | < .001 | 7.0 | < .001 | 4.06 | .005 | 2.67 |
| Unskilled blue collar | 13.1 | .081 | 15.8 | < .001 | 16.3 | < .001 | 10.8 |
| Skilled blue collar | 4.84 | .001 | 8.78 | .609 | 5.26 | < .001 | 9.28 |
| Independent | 1.45 | < .001 | 1.85 | < .001 | 3.14 | .001 | 4.79 |
| Clerk | 12.9 | .915 | 10.4 | .032 | 12.7 | .88 | 12.8 |
| Executive | 0.85 | .001 | 1.25 | .001 | 1.94 | .001 | 3.26 |
| Paternal demographics | |||||||
| Age 13–69 y | 28.72 (8.18) | .045 | 29.09 (7.77) | .288 | 28.64 (7.69) | .001 | 29.37 (7.73) |
| Age 13–69 y squared | 891.55 (536.26) | .155 | 906.43 (506.56) | .366 | 879.37 (502.76) | .002 | 922.13 (513.82) |
| Paternal educationa | |||||||
| No schooling and cannot read | 1.33 | .046 | 2.05 | .001 | 1.55 | .001 | 0.59 |
| Primary school complete | 17.3 | .688 | 16.5 | .272 | 18.7 | .468 | 17.9 |
| Secondary school incomplete | 14.9 | .234 | 14.7 | .208 | 13.0 | .822 | 13.2 |
| Secondary school complete | 17.9 | < .001 | 19.5 | < .001 | 19.8 | < .001 | 25.3 |
| University incomplete | 1.09 | .001 | 2.11 | .002 | 1.78 | < .001 | 4.00 |
| University complete | 0.73 | < .001 | 2.05 | < .001 | 2.20 | < .001 | 5.33 |
| Paternal occupationc | |||||||
| Unskilled blue collar | 38.2 | < .001 | 38.4 | < .001 | 42.5 | < .001 | 27.2 |
| Skilled blue collar | 19.1 | .054 | 24.5 | <.137 | 17.5 | < .001 | 22.4 |
| Independent | 4.96 | < .001 | 7.13 | < .001 | 7.16 | < .001 | 11.2 |
| Clerk | 26.7 | < .001 | 17.9 | < .001 | 19.4 | < .001 | 24.4 |
| Executive | 2.17 | < .001 | 2.97 | < .001 | 4.62 | < .001 | 9.43 |
Note. The table reports the descriptive statistics including frequencies for categorical variables and means with standard deviations in parentheses for continuous variables based on observations with complete data on all study variables.
Reference category is incomplete primary education and literate without formal schooling.
Reference category is stay-home mothers.
Reference category is unemployed or stay-home fathers.
Table 2 reports the unadjusted and adjusted odds ratios (ORs) for ancestry effects on LBW and PTB from equation 1. When unadjusted, African ancestry (alone or mixed) significantly increased LBW and PTB risks by about 1.6 to 1.7 and 1.3 to 1.4 times, respectively. When adjusted for all explanatory variables in Table 1, the effects of African ancestry became small and insignificant (OR = 1.0–1.3).
TABLE 2—
Overall Effects of African Ancestry Indicators on Low Birth Weight and Preterm Birth: Brazil, 1995–2009
| Unadjusted |
Adjusted |
|||
| Total Model Sample | LBW, OR (95% CI) | PTB, OR (95% CI) | LBW, OR (95% CI) | PTB, OR (95% CI) |
| African-only ancestrya (n = 2852) | 1.56** (1.20, 2.03) | 1.30* (1.05, 1.61) | 1.28 (0.99, 1.65) | 1.10 (0.97, 1.58) |
| African–non-European mixed ancestrya (n = 3539) | 1.66** (1.39, 2.00) | 1.39** (1.16, 1.65) | 1.10 (0.76, 1.42) | 1.09 (0.92, 1.32) |
| African–European mixed ancestrya (n = 6608) | 1.58** (1.27, 1.97) | 1.28** (1.11, 1.48) | 1.02 (0.75, 1.22) | 1.01 (0.89, 1.30) |
Note. CI = confidence interval; LBW = low birth weight; OR = odds ratio; PTB = preterm birth. The table shows ORs for the effects of ethnic ancestry on low birth weight and preterm birth with 95% CIs. We estimated a separate model for each African ancestry group relative to European-only ancestry. The model sample size is the sum of each African ancestry group sample and that of the European-only ancestry group and is the same for all adjusted and unadjusted models for LBW and PTB for a certain ancestry comparison. The adjusted model included as covariates all the explanatory variables listed in Table 1.
Reference is European-only ancestry.
*P < .05; **P < .01.
Tables 3 and 4 show the results from decomposing the LBW and PTB disparities, respectively, in relation to the explanatory variable categories. The difference in LBW or PTB rate by ancestry and the difference jointly explained by all model variables are shown, as well as the difference in LBW or PTB rate by ancestry that is independently explained by each category of the study variables. Figures A and B (available as a supplement to the online version of this article at http://www.ajph.org) show the percentages of the LBW and PTB disparities that were significantly explained by the study variable categories. Variable categories that did not explain these disparities are not shown in these figures.
TABLE 3—
Decomposition of Racial Disparities in Low Birth Weight: Brazil, 1995–2009
| AO vs EO (n = 2852), Difference, %, or Difference (SE) | ANE vs EO (n = 3539), Difference, %, or Difference (SE) | AE vs EO (n = 6608), Difference, %, or Difference (SE) | |
| Total difference in LBW rate and difference jointly explained by variables | |||
| Difference in LBW rate (0–1) | 0.0399 | 0.0412 | 0.0469 |
| Explained difference | 0.0178 | 0.0299 | 0.0439 |
| % explained | 44.6 | 72.6 | 93.6 |
| % unexplained | 55.4 | 27.4 | 6.4 |
| Difference in LBW rate independently explained by variable categories | |||
| Prenatal visits | 0.0148** (0.0034) | −0.0049* (0.0023) | 0.0062** (0.0015) |
| Maternal fertility history | −0.0019 (0.0011) | −0.0009 (0.0007) | −0.0004 (0.0008) |
| Maternal health | −0.0009 (0.0013) | −0.0006 (0.0013) | −0.0046** (0.0012) |
| Household demographics | 0.0011 (0.0013) | 0.0035* (0.0015) | 0.0002 (0.0011) |
| Socioeconomic status | 0.0030 (0.0040) | 0.0038 (0.0023) | 0.0032* (0.0013) |
| Geographic location | 0.0017 (0.0041) | 0.0289** (0.0067) | 0.0394** (0.0049) |
Note. AE = African–European mixed ancestry; ANE = African–non-European mixed ancestry; AO = African-only ancestry; EO = European-only ancestry; LBW = low birth weight. The table reports the differences in LBW rate (on a scale between 0 and 1) by ancestry and the contributions of the model variables to these differences. For example, the number of prenatal care visits explains 0.0148 points of the 0.0399-point difference (or 1.48 percentage points of the 3.99 percentage-point difference) in LBW rate between infants of AO and EO ancestries. The model sample size is the sum of each African ancestry group sample and that of the EO group.
*P < .05; **P < .01.
The study variables explain a large percentage of the LBW and PTB disparities between African and EO ancestries, ranging from 44.6% of the LBW gap for AO to 93.9% of the PTB gap for AE ancestry. Geographic effects were most relevant for explaining disparities for the mixed African ancestries, explaining 70% to 80% of the gaps. Prenatal care was the only relevant variable for explaining disparities for AO ancestry, explaining 37% to 63% of the gaps, and second-most relevant for AE ancestry. We further describe these results in the next paragraphs and highlight the most relevant variables within each category (detailed results for individual variable contributions available from the authors).
As shown in Tables 3 and 4, the model variables explained 44.6% and 64.2% of the LBW and PTB gaps, respectively, between AO and EO ancestries. Most of the explained gaps (about 37.1% of the LBW gaps and 63.1% of the PTB gaps) were accounted for by the lower number of prenatal visits for AO ancestry. None of the other variable categories had significant effects on these disparities.
TABLE 4—
Decomposition of Racial Disparities in Preterm Birth, Brazil, 1995–2009
| AO vs EO (n = 2852), Difference, %, or Difference (SE) | ANE vs EO (n = 3539), Difference, %, or Difference (SE) | AE vs EO (n = 6608), Difference, %, or Difference (SE) | |
| Total difference in PTB rate and difference jointly explained by variables | |||
| Difference in PTB rate (0–1) | 0.0366 | 0.0465 | 0.0347 |
| Explained difference | 0.0235 | 0.0348 | 0.0326 |
| % Explained | 64.2 | 74.8 | 93.9 |
| % Unexplained | 35.8 | 25.2 | 6.1 |
| Difference in PTB rate independently explained by variable categories | |||
| Prenatal visits | 0.0231** (0.0041) | −0.0060** (0.0016) | 0.0095** (0.0024) |
| Maternal fertility history | 0.0022 (0.0018) | −0.0004 (0.0007) | 0.0007 (0.0004) |
| Maternal health | −0.0018 (0.0015) | −0.0011 (0.0012) | −0.0028* (0.0014) |
| Household demographics | 0.0009 (0.0014) | 0.0023 (0.0013) | 0.0004 (0.0006) |
| Socioeconomic status | 0.0001 (0.0065) | 0.0046 (0.0041) | −0.0027 (0.0025) |
| Geographic location | −0.0009 (0.0069) | 0.0354** (0.0072) | 0.0276** (0.0070) |
Note. AE = African–European mixed ancestry; ANE = African–non-European mixed ancestry; AO = African-only ancestry; EO = European-only ancestry; PTB = preterm birth. The table reports the differences in PTB rate (on a scale between 0 and 1) by ancestry and the contributions of the model variables to these differences. For example, the number of prenatal care visits explains 0.0231 points of the 0.0366-point difference (or 2.31 percentage points of the 3.66 percentage-point difference) in PTB rate between infants of AO and EO ancestries. The model sample size is the sum of each African ancestry group sample and that of the EO group.
*P < .05; **P < .01.
The model variables explained 93.6% and 72.6% of the LBW gap for AE and ANE versus EO ancestry, respectively (Tables 3 and 4). Differences in geographic location explained about 84.0% and 70.1% of these disparities, respectively. Differences in the number of prenatal visits explained 13.2% of the LBW gap for AE ancestry. Differences in SES explained 6.8% and 9.2% of the LBW disparities for AE and ANE ancestries, respectively, with parental occupation accounting for most of these effects. Differences in household demographics, mainly parental age, explained 8.5% of the LBW disparity for ANE ancestry. In the ANE group, the average number of visits was larger than in the EO group, suggesting that the LBW disparity would have been larger if prenatal visits were lower. Similarly, the significantly lower rates of acute illnesses during pregnancy in the AE group compared with the EO group reduced the LBW disparity in the AE group, which otherwise would have been larger.
The model variables also explained most of the PTB gaps—93.9% and 74.8% for AE and ANE ancestries, respectively. Geographic effects were also the most relevant, explaining 79.5% and 76.1% of these disparities for AE and ANE ancestries, respectively. Differences in prenatal visits explained 27.4% of the PTB gap for the AE ancestry. Differences in household demographics (mainly maternal age) explained 4.9% of the PTB gap for ANE ancestry. Similar to the LBW disparities, the ANE and AE disparities in PTB would have been larger if the ANE group had had a similar or lower average of prenatal visits and the AE group had had similar or higher rates of acute illnesses compared with the EO group.
DISCUSSION
In Brazil, LBW and PTB rates were significantly higher among infants of African ancestry alone or mixed with other ancestries than those of EO ancestry. The disparities we found are consistent with those from other studies in Brazil.34,63 For example, Barros et al. reported a 14% to 24% increased likelihood of LBW and PTB among non-White infants compared with White infants in Southern Brazil.34 However, our study was the first to formally decompose these disparities in Brazil and quantify how they related to demographic, socioeconomic, health care, and geographic differences. We found that the model variables explained a significant portion of LBW (about 45%) and PTB (64%) disparities for infants with AO and most of the disparities for infants with mixed African ancestries. These findings suggest that racial disparities in infant health in Brazil are mainly socially and economically driven and are amenable to policy interventions that address these pathways. Our model notably explains more of these gaps than a recent study of LBW and PTB disparities between Black and White infants in the United States using a similar approach, which only explained close to one third of the LBW (27.2%) and PTB (27.5%) gaps.22 This highlights the importance of population-specific studies and that US-based studies of racial disparities may not generalize to the Brazilian population.
Geographic, prenatal care, and socioeconomic differences were the most relevant factors for explaining these disparities. Improving access to prenatal care especially for AO mothers may significantly reduce racial disparities in infant health in Brazil. In our sample, mothers of AO ancestry used 1 fewer prenatal visit on average than those of EO ancestry. One reason why SES differences did not significantly explain racial disparities between AO and EO ancestries is that they were strongly predictive of prenatal care use differences between these groups and may be influencing disparities through prenatal care.
In an additional model, we decomposed the disparities between AO and EO ancestries excluding prenatal visits from the model and found SES to significantly explain 53% and 26% of the disparities in LBW and PTB, respectively. This suggests that the disparities explained by prenatal care differences are in part driven by SES differences. In the recent US-based study mentioned previously, SES explained 21.4% and 19% of the LBW and PTB gaps, respectively, between Black and White infants, and prenatal care explained 13.4% and 12.4% of the LBW and PTB disparities, respectively. By contrast, prenatal care explained a much larger part of the gaps in our study, especially for infants of AO ancestry (37.1% and 63.1% of the LBW and PTB gaps, respectively), and SES explained a smaller part of the gap than that study. Again, these results highlight the need for population-specific studies of racial disparities.
The university graduation rate was low in the study sample, but this rate was significantly lower among individuals of African ancestry, especially AO (< 1%). Furthermore, unemployment and low-skill occupations were significantly more common among mothers of African ancestry (about 20% compared with 13% among EO ancestry). These sample-based differences are consistent with population-level differences.32 Therefore, economic and educational policies that improve the human capital and SES for the whole Brazilian population may reduce the observed LBW and PTB disparities.
The observed geographic effects suggest (1) significant racial differences in geographic location and (2) large geographic differences in LBW and PTB prevalence. Differences in geographic location by race can be clearly seen by the sample’s ancestry distributions across the study provinces as shown in Figure C (available as a supplement to the online version of this article at http://www.ajph.org) and are supported by previous studies documenting large racial residential segregation in Brazil.31 Also, Figure D (available as a supplement to the online version of this article at http://www.ajph.org) shows significant variation in the sample LBW and PTB rates across the study provinces. Racial residential segregation correlates with poverty concentration in certain geographic locations in Brazil.85,86 Geographic differences in LBW and PTB may arise from differences in access to health care and social and economic resources (social support, safety, healthy food outlets) that are important for maternal and infant health.74,75 There are many ways through which racial differences in residential location can lead to racial disparities in infant health including by restricting access to such important resources as previously shown in several studies in the United States.15,87−89 We cannot identify the specific factors that contribute to geographic differences in LBW and PTB in this study. However, the results suggest that policies that aim at eliminating the underlying causes for racial residential segregation may reduce racial disparities in infant health in Brazil.
The model explains less of the disparity for AO than for mixed African ancestries. This suggests potential differences in the underlying pathways for disparities among these groups. Because geographic location is more similar between AO and EO ancestries than between mixed African ancestry and EO as shown in Figure C (available as a supplement to the online version of this article at http://www.ajph.org), geographic effects were important for explaining the disparities for mixed African ancestries but not for AO ancestry. Also, the lower SES for AO compared with mixed African ancestry may increase the relative influence of individual- versus geographic-level factors on AO disparities. The results highlight the importance of further research to evaluate the role of other factors not included in our model that may be contributing to the disparities for AO infants. Furthermore, our model explained a larger portion of the disparities for AE than ANE ancestries. This may suggest greater similarity in unmeasured relevant characteristics for infants’ health between AE and EO ancestries such as cultural factors, which increases the explanatory power of the model variables.
Our study highlights the importance of studying racial disparities in health by using population-specific data. As mentioned previously, there are important social, economic, and health care system differences between Brazil and the United States. Among these is the difference in perception of racial identity between the 2 countries as discussed previously. The perception of race along a color continuum in Brazil is a social phenomenon that has historically existed for more than 500 years during the colonial period and before the abolishment of slavery and is widely recognized by all Brazilians.30,31,41,90 Furthermore, Brazil has one of the most racially admixed populations worldwide,31 and the percentage of the population mixed between White and Black has increased from 21.2% in 1940 to 38.5% in 2000.32 Also, there are distinct historical and political differences between Brazil and the United States related to race. For example, after the abolition of slavery in Brazil, there were no laws that instituted racial segregation as in the United States.30
In addition, there are major economic differences between the 2 countries. Average income per capita in Brazil in 2010 was only 22.7% of that in the United States ($10 710 vs $47 153).34 Furthermore, income disparity by race is larger in Brazil than the United States. For example, average family income of the Black and Brown population in Brazil in 2006 was 44% that of Whites.32 By contrast, average household income of Blacks in the United States in 2006 was 63% that of Whites.91 Also, large racial disparities exist in private health insurance in Brazil,33 which, unlike the United States, does not have a public health insurance system aimed at covering less-affluent mothers and children. In addition, the capacity of the health care system in Brazil is markedly lower than that of the United States.92 All these differences suggest that there may be major limitations to generalizing findings from studies on racial disparities across countries.
Limitations and Strengths
There are some limitations to this study. We were unable to evaluate the effects of other conceptually relevant variables for LBW and PTB such as insurance status, diet, exercise, stress, smoking, substance use, maternal weight gain, quality of prenatal care, and cultural factors.64,93−97 This is especially important for further explaining the disparities between AO and EO ancestries and for understanding the socioeconomic and behavioral pathways leading to disparities. In a separate model, we evaluated the effect of medication use but found overall that it does little in explaining any of the disparities (detailed results available from the authors). A related limitation is that we did not have intergenerational data that enabled exploration of the root causes of some of the maternal and prenatal factors relevant to infant health disparities such as the importance of the mother’s own growing environment for her educational attainment and health behavior later in life. Also, we were unable to explain the pathways through which geographic location explained the LBW disparities for mixed African ancestries because of the lack of data on geographic-level characteristics.
As in any self-reported measure, our measure of ethnic ancestry may involve some errors such as in cases when the mother or father does not know his or her complete family ancestry. However, we expect such errors to be minimal, especially because race in Brazil is strongly linked to skin color, which in turn is related to ethnic ancestry. Also, the number of prenatal visits was capped at 9 (for visits greater than 9) during data entry in certain years. This was not expected to bias the contribution of prenatal visits to explaining the LBW or PTB gap but to inflate its variance, which is of minimal consequence because the contribution is significant. Finally, even though our sample was socioeconomically and geographically diverse, it was not randomly selected and may not be fully representative of the entire birth population.
Yet our study had several strengths including a large, diverse sample, a measure of ethnic ancestry that reflected the perception of race along a continuum in Brazil and accommodated the large ancestry admixture, detailed and consistently collected data across multiple sites in Brazil, and an approach that quantified the contribution of multiple variables both as a group and individually while controlling for the other variables to racial disparities.
Conclusions
Our study offers insights for several future studies. First, studies using intergenerational data are needed to identify earlier causes of infant health disparities and to explain the effects of proximal factors such as maternal education, health behavior, and geographic location. Similarly, studies that evaluate the contributions of additional maternal health care and behavioral characteristics not measured in our study, such as insurance status, smoking, alcohol use, and diet, and specific area-level characteristics such as number of health care providers, quality of prenatal care, and neighborhood wealth and safety indicators, are needed to evaluate their contributions to infant health disparities. Also, examining more detailed measures of race and ethnic ancestry is important to more fully capture the subtleties of racial perceptions in Brazil. Finally, it is important to replicate our study by using a population-based nationally representative sample from Brazil.
Acknowledgments
This study was partly supported by National Institutes of Health (grants 1R03 DE018394 from the National Institute of Dental and Craniofacial Research and 5R03 TW 008110 from the Fogarty International Center).
The authors would like to thank Adweta Joshi for her help in generating the study maps.
Human Participant Protection
The study was approved by the University of Iowa institutional review board.
References
- 1.Wood CH, Lovell PA. Racial inequality and child mortality in Brazil. Soc Forces. 1992;70(3):703–724 [Google Scholar]
- 2.Victora CG, Vaughan JP, Barros FC, Silva AC, Tomasi E. Explaining trends in inequities: evidence from Brazilian child health studies. Lancet. 2000;356(9235):1093–1098 [DOI] [PubMed] [Google Scholar]
- 3.Cardoso AM, Santos RV, Coimbra CE., Jr Infant mortality according to race/color in Brazil: what do the national databases say? [in Portuguese]. Cad Saude Publica. 2005;21(5):1602–1608 [DOI] [PubMed] [Google Scholar]
- 4.Antunes JLF, Peres MA, de Campos Mello TR, Waldman EA. Multilevel assessment of determinants of dental caries experience in Brazil. Community Dent Oral Epidemiol. 2006;34(2):146–152 [DOI] [PubMed] [Google Scholar]
- 5.Matijasevich A, Victora CG, Barros AJet al. Widening ethnic disparities in infant mortality in southern Brazil: comparison of 3 birth cohorts. Am J Public Health. 2008;98(4):692–698 [DOI] [PMC free article] [PubMed] [Google Scholar]
- 6.Victora CG, Matijasevich A, Silveira M, Santos I, Barros AJ, Barros FC. Socio-economic and ethnic group inequities in antenatal care quality in the public and private sector in Brazil. Health Policy Plan. 2010;25(4):253–261 [DOI] [PMC free article] [PubMed] [Google Scholar]
- 7.Matijasevich A, Santos IS, Silveira MFet al. Inequities in maternal postnatal visits among public and private patients: 2004 Pelotas Cohort Study. BMC Public Health. 2009;9:335. [DOI] [PMC free article] [PubMed] [Google Scholar]
- 8.Frankel S, Elwood P, Sweetnam P, Yarnell J, Smith GD. Birthweight, body-mass index in middle age, and incident coronary heart disease. Lancet. 1996;348(9040):1478–1480 [DOI] [PubMed] [Google Scholar]
- 9.Järvelin MR, Sovio U, King Vet al. Early life factors and blood pressure at age 31 years in the 1966 northern Finland birth cohort. Hypertension. 2004;44(6):838–846 [DOI] [PubMed] [Google Scholar]
- 10.Gluckman PD, Hanson MA, Cooper C, Thornburg KL. Effect of in utero and early-life conditions on adult health and disease. N Engl J Med. 2008;359(1):61–73 [DOI] [PMC free article] [PubMed] [Google Scholar]
- 11.Victora CG, Adair L, Fall Cet al. Maternal and child undernutrition: consequences for adult health and human capital. Lancet. 2008;371(9609):340–357 [DOI] [PMC free article] [PubMed] [Google Scholar]
- 12.Currie J. Healthy, wealthy, and wise: socioeconomic status, poor health in childhood, and human capital development. J Econ Lit. 2009;47(1):87–122 [Google Scholar]
- 13.Cunha F, Heckman J, Schennach S. Estimating the technology of cognitive and noncognitive skill formation. Econometrica. 2010;78(3):883–931 [DOI] [PMC free article] [PubMed] [Google Scholar]
- 14.Doyle O, Harmon CP, Heckman JJ, Tremblay RE. Investing in early human development: timing and economic efficiency. Econ Hum Biol. 2009;7(1):1–6 [DOI] [PMC free article] [PubMed] [Google Scholar]
- 15.Acevedo-Garcia D, Osypuk TL, McArdle N, Williams DR. Toward a policy-relevant analysis of geographic and racial/ethnic disparities in child health. Health Aff (Millwood). 2008;27(2):321–333 [DOI] [PubMed] [Google Scholar]
- 16.Chen E, Martin AD, Matthews KA. Understanding health disparities: the role of race and socioeconomic status in children’s health. Am J Public Health. 2006;96(4):702–708 [DOI] [PMC free article] [PubMed] [Google Scholar]
- 17.Lu MC, Halfon N. Racial and ethnic disparities in birth outcomes: a life-course perspective. Matern Child Health J. 2003;7(1):13–30 [DOI] [PubMed] [Google Scholar]
- 18.Miller D. What underlies the Black–White infant mortality gap? The importance of birthweight, behavior, environment, and health care. Working paper. Berkeley, CA: University of California at Berkeley; 2003 [Google Scholar]
- 19.Pitts M, Walker M, Armour B. A decomposition of the Black–White differential in birth outcomes. Atlanta, GA: Federal Reserve Bank of Atlanta; 2011. Working Paper Series 2011-1. [Google Scholar]
- 20.Cramer JC. Racial and ethnic differences in birthweight: the role of income and financial assistance. Demography. 1995;32(2):231–247 [PubMed] [Google Scholar]
- 21.Lin W. Why has the health inequality among infants in the US declined? Accounting for the shrinking gap. Health Econ. 2009;18(7):823–841 [DOI] [PubMed] [Google Scholar]
- 22.Lhila A, Long S. What is driving the Black–White difference in low birthweight in the US? Health Econ. 2012;21(3):301–315 [DOI] [PubMed] [Google Scholar]
- 23.Collins JW, Jr, David RJ. Racial disparity in low birth weight and infant mortality. Clin Perinatol. 2009;36(1):63–73 [DOI] [PubMed] [Google Scholar]
- 24.Rauh VA, Andrews HF, Garfinkel RS. The contribution of maternal age to racial disparities in birthweight: a multilevel perspective. Am J Public Health. 2001;91(11):1815–1824 [DOI] [PMC free article] [PubMed] [Google Scholar]
- 25.Shone LP, Dick AW, Klein JD, Zwanziger J, Szilagyi PG. Reduction in racial and ethnic disparities after enrollment in the State Children’s Health Insurance Program. Pediatrics. 2005;115(6):e697–e705 [DOI] [PubMed] [Google Scholar]
- 26.Liu J, Probst JC, Martin AB, Wang J-Y, Salinas CF. Disparities in dental insurance coverage and dental care among US children: The National Survey of Children’s Health. Pediatrics. 2007;119(Suppl 1):S12–S21 [DOI] [PubMed] [Google Scholar]
- 27.Chin MH, Alexander-Young M, Burnet DL. Health care quality-improvement approaches to reducing child health disparities. Pediatrics. 2009;124(Suppl 3):S224–S236 [DOI] [PMC free article] [PubMed] [Google Scholar]
- 28.Fiscella K, Williams DR. Health disparities based on socioeconomic inequities: implications for urban health care. Acad Med. 2004;79(12):1139–1147 [DOI] [PubMed] [Google Scholar]
- 29.Nyarko KA, Wehby GL. Residential segregation and the health of African-American infants: does the effect vary by prevalence? Matern Child Health J. 2012;16(7):1491–1499 [DOI] [PMC free article] [PubMed] [Google Scholar]
- 30.Telles EE. Residential segregation by skin color in Brazil. Am Sociol Rev. 1992;57(2):186–197 [Google Scholar]
- 31.Telles EE. Race in Another America: The Significance of Skin Color in Brazil. Princeton, NJ: Princeton University Press; 2004 [Google Scholar]
- 32.Race and Color. Rio de Janeiro, Brazil: Instituto Brazileiro de Geografia e Estatistica; 2006. Available at: http://www.ibge.gov.br/english/presidencia/noticias/noticia_impressao.php?id_noticia=737. Accessed November 26, 2012 [Google Scholar]
- 33.Wehby GL, Murray JC, McCarthy AM, Castilla EE. Racial gaps in child health insurance coverage in four South American countries: the role of wealth, human capital, and other household characteristics. Health Serv Res. 2011;46(6pt2):2119–2138 [DOI] [PMC free article] [PubMed] [Google Scholar]
- 34.Barros FC, Victora CG, Horta BL. Ethnicity and infant health in Southern Brazil. A birth cohort study. Int J Epidemiol. 2001;30(5):1001–1008 [DOI] [PubMed] [Google Scholar]
- 35.Castilla EE, Orioli IM. ECLAMC: the Latin-American collaborative study of congenital malformations. Community Genet. 2004;7(2-3):76–94 [DOI] [PubMed] [Google Scholar]
- 36.Wehby GL, Murray JC, Castilla EE, Lopez-Camelo JS, Ohsfeldt RL. Quantile effects of prenatal care utilization on birth weight in Argentina. Health Econ. 2009;18(11):1307–1321 [DOI] [PMC free article] [PubMed] [Google Scholar]
- 37.Wehby GL, Murray JC, Castilla EE, Lopez-Camelo JS, Ohsfeldt RL. Prenatal care demand and its effects on birth outcomes by birth defect status in Argentina. Econ Hum Biol. 2009;7(1):84–95 [DOI] [PMC free article] [PubMed] [Google Scholar]
- 38.Wehby GL, Castilla EE, Lopez-Camelo J. The impact of altitude on infant health in South America. Econ Hum Biol. 2010;8(2):197–211 [DOI] [PMC free article] [PubMed] [Google Scholar]
- 39.López Camelo JS, Campana H, Santos R, Poletta FA. Effect of the interaction between high altitude and socioeconomic factors on birth weight in a large sample from South America. Am J Phys Anthropol. 2006;129(2):305–310 [DOI] [PubMed] [Google Scholar]
- 40.Wehby GL, Murray JC, Castilla EE, Lopez-Camelo JS, Ohsfeldt RL. Prenatal care effectiveness and utilization in Brazil. Health Policy Plan. 2009;24(3):175–188 [DOI] [PMC free article] [PubMed] [Google Scholar]
- 41.Degler CN. Neither Black nor White: Slavery and Race Relations in Brazil and the United States. Madison, WI: University of Wisconsin Press; 1986 [Google Scholar]
- 42.Chor D, Lima CR. Epidemiologic aspects of racial inequalities in health in Brazil [in Portuguese]. Cad Saude Publica. 2005;21(5):1586–1594 [DOI] [PubMed] [Google Scholar]
- 43.Chaturvedi N. Ethnicity as an epidemiological determinant—crudely racist or crucially important? Int J Epidemiol. 2001;30(5):925–927 [DOI] [PubMed] [Google Scholar]
- 44.Wehby G, McCarthy AM, Castilla EE, Murray JC. The impact of household investments on early child neurodevelopment and on racial and socioeconomic developmental gaps in South America. Forum Health Econ Policy. 2012;14(2):1–58 [DOI] [PMC free article] [PubMed] [Google Scholar]
- 45.Wehby GL, Castilla EE, Lopez-Camelo JS, Murray JC. Predictors of multivitamin use during pregnancy in Brazil. Int J Public Health. 2009;54(2):78–87 [DOI] [PMC free article] [PubMed] [Google Scholar]
- 46.Aber JL, Bennett NG, Conley DC, Li J. The effects of poverty on child health and development. Annu Rev Public Health. 1997;18:463–483 [DOI] [PubMed] [Google Scholar]
- 47.Adler NE, Newman K. Socioeconomic disparities in health: pathways and policies. Health Aff (Millwood). 2002;21(2):60–76 [DOI] [PubMed] [Google Scholar]
- 48.Currie J, Neidell M, Schmieder JF. Air pollution and infant health: lessons from New Jersey. J Health Econ. 2009;28(3):688–703 [DOI] [PMC free article] [PubMed] [Google Scholar]
- 49.Desai S, Alva S. Maternal education and child health: is there a strong causal relationship? Demography. 1998;35(1):71–81 [PubMed] [Google Scholar]
- 50.Kogan MD. Social causes of low birth weight. J R Soc Med. 1995;88(11):611–615 [DOI] [PMC free article] [PubMed] [Google Scholar]
- 51.Bryant AS, Worjoloh A, Caughey AB, Washington AE. Racial/ethnic disparities in obstetric outcomes and care: prevalence and determinants. Am J Obstet Gynecol. 2010;202(4):335–343 [DOI] [PMC free article] [PubMed] [Google Scholar]
- 52.Kramer MR, Cooper HL, Drews-Botsch CD, Waller LA, Hogue CR. Metropolitan isolation segregation and Black–White disparities in very preterm birth: a test of mediating pathways and variance explained. Soc Sci Med. 2010;71(12):2108–2116 [DOI] [PMC free article] [PubMed] [Google Scholar]
- 53.Grossman M. On the concept of health capital and the demand for health. J Polit Econ. 1972;80(2):223–255 [Google Scholar]
- 54.Guarnizo-Herreño CC, Wehby GL. Explaining racial/ethnic disparities in children’s dental health: a decomposition analysis. Am J Public Health. 2012;102(5):859–866 [DOI] [PMC free article] [PubMed] [Google Scholar]
- 55.Rosenzweig MR, Schultz TP. Estimating a household production function: heterogeneity, the demand for health inputs, and their effects on birth weight. J Polit Econ. 1983;91(5):723–746 [Google Scholar]
- 56.Aragão VM, da Silva AA, de Aragão LFet al. Risk factors for preterm births in São Luís, Maranhão, Brazil. Cad Saude Publica. 2004;20(1):57–63 [DOI] [PubMed] [Google Scholar]
- 57.Nyarko KA, Lopez-Camelo JS, Castilla E, Wehby G. Does the relationship between prenatal care and birth weight vary by oral clefts? Evidence using South American and US samples. J Pediatr. 2012 Jul 25. [Epub ahead of print] [DOI] [PMC free article] [PubMed] [Google Scholar]
- 58.Barbieri MA, Silva AA, Bettiol H, Gomes UA. Risk factors for the increasing trend in low birth weight among live births born by vaginal delivery, Brazil. Rev Saude Publica. 2000;34(6):596–602 [DOI] [PubMed] [Google Scholar]
- 59.Furquim de Almeida M, Alencar GP, Novaes HMet al. Risk-factors for antepartum fetal deaths in the city of São Paulo, Brazil. Rev Saude Publica. 2007;41(1):35–43 [DOI] [PubMed] [Google Scholar]
- 60.Silva AA, Barbieri MA, Gomes UA, Bettiol H. Trends in low birth weight: a comparison of two birth cohorts separated by a 15-year interval in Ribeirao Preto, Brazil. Bull World Health Organ. 1998;76(1):73–84 [PMC free article] [PubMed] [Google Scholar]
- 61.Rosenzweig MR, Schultz TP. The stability of household production technology—a replication. J Hum Resour. 1988;23(4):535–549 [Google Scholar]
- 62.Burgard S. Race and pregnancy-related care in Brazil and South Africa. Soc Sci Med. 2004;59(6):1127–1146 [DOI] [PubMed] [Google Scholar]
- 63.Silva LM, Silva RA, Silva AA, Bettiol H, Barbieri MA. Racial inequalities and perinatal health in the southeast region of Brazil. Braz J Med Biol Res. 2007;40(9):1187–1194 [DOI] [PubMed] [Google Scholar]
- 64.Kramer MS. Determinants of low birth weight: methodological assessment and meta-analysis. Bull World Health Organ. 1987;65(5):663–737 [PMC free article] [PubMed] [Google Scholar]
- 65.Shah PS, Zao J, Ali S. Maternal marital status and birth outcomes: a systematic review and meta-analyses. Matern Child Health J. 2011;15(7):1097–1109 [DOI] [PubMed] [Google Scholar]
- 66.Rittler M, Castilla EE, Chambers C, Lopez-Camelo JS. Risk for gastroschisis in primigravidity, length of sexual cohabitation, and change in paternity. Birth Defects Res A Clin Mol Teratol. 2007;79(6):483–487 [DOI] [PubMed] [Google Scholar]
- 67.Bettiol H, Rona RJ, Chinn S, Goldani M, Barbieri MA. Factors associated with preterm births in Southeast Brazil: a comparison of two birth cohorts born 15 years apart. Paediatr Perinat Epidemiol. 2000;14(1):30–38 [DOI] [PubMed] [Google Scholar]
- 68.Victoria CG, Huttly SRA, Barros FC, Lombardi C, Vaughan JP. Maternal education in relation to early and late child health outcomes: findings from a Brazilian cohort study. Soc Sci Med. 1992;34(8):899–905 [DOI] [PubMed] [Google Scholar]
- 69.Alves D, Belluzzo W. Infant mortality and child health in Brazil. Econ Hum Biol. 2004;2(3):391–410 [DOI] [PubMed] [Google Scholar]
- 70.Zuckerman BS, Frank DA, Hingson R, Morelock S, Kayne HL. Impact of maternal work outside the home during pregnancy on neonatal outcome. Pediatrics. 1986;77(4):459–464 [PubMed] [Google Scholar]
- 71.Bonzini M, Coggon D, Godfrey K, Inskip H, Crozier S, Palmer KT. Occupational physical activities, working hours and outcome of pregnancy: findings from the Southampton Women’s Survey. Occup Environ Med. 2009;66(10):685–690 [DOI] [PMC free article] [PubMed] [Google Scholar]
- 72.Visness CM, Kennedy KI. Maternal employment and breast-feeding: findings from the 1988 National Maternal and Infant Health Survey. Am J Public Health. 1997;87(6):945–950 [DOI] [PMC free article] [PubMed] [Google Scholar]
- 73.Berger LM, Hill J, Waldfogel J. Maternity leave, early maternal employment and child health and development in the US. Econ J. 2005;115(501):F29–F47 [Google Scholar]
- 74.Lane SD, Keefe RH, Rubinstein Ret al. Structural violence, urban retail food markets, and low birth weight. Health Place. 2008;14(3):415–423 [DOI] [PubMed] [Google Scholar]
- 75.Landrine H, Corral I. Separate and unequal: residential segregation and Black health disparities. Ethn Dis. 2009;19(2):179–184 [PubMed] [Google Scholar]
- 76.Gouveia N, Bremner SA, Novaes HMD. Association between ambient air pollution and birth weight in São Paulo, Brazil. J Epidemiol Community Health. 2004;58(1):11–17 [DOI] [PMC free article] [PubMed] [Google Scholar]
- 77.Szwarcwald CL, Andrade CL, Bastos FI. Income inequality, residential poverty clustering and infant mortality: a study in Rio de Janeiro, Brazil. Soc Sci Med. 2002;55(12):2083–2092 [DOI] [PubMed] [Google Scholar]
- 78.de Carvalho JA, Wood CH. Mortality, income distribution, and rural–urban residence in Brazil. Estud Poblac. 1978;3(7-12):7–19 [PubMed] [Google Scholar]
- 79.Sastry N. What explains rural–urban differentials in child mortality in Brazil? Soc Sci Medicine. 1997;44(7):989–1002 [DOI] [PubMed] [Google Scholar]
- 80.Victora CG, Barros FC. Infant mortality due to perinatal causes in Brazil: trends, regional patterns and possible interventions. Sao Paulo Med J. 2001;119(1):33–42 [DOI] [PMC free article] [PubMed] [Google Scholar]
- 81.Wooldridge JM. Econometric Analysis of Cross Section and Panel Data. Cambridge, MA, and London, England: MIT Press; 2002 [Google Scholar]
- 82.Fairlie RW. An extension of the Blinder–Oaxaca decomposition technique to logit and probit models. J Econ Soc Meas. 2005;30(4):305–316 [Google Scholar]
- 83.Oaxaca R. Male–female wage differentials in urban labor markets. Int Econ Rev. 1973;14(3):693–709 [Google Scholar]
- 84.Blinder AS. Wage discrimination: reduced form and structural estimates. J Hum Resour. 1973;8(4):436–455 [Google Scholar]
- 85.Telles EE. Race, class and space in Brazilian cities. Int J Urban Reg Res. 1995;19(3):395–406 [Google Scholar]
- 86.Skidmore TE. Toward a comparative analysis of race relations since abolition in Brazil and the United States. J Lat Am Stud. 1972;4(1):1–28 [Google Scholar]
- 87.Colen CG, Geronimus AT, Bound J, James SA. Maternal upward socioeconomic mobility and Black–White disparities in infant birthweight. Am J Public Health. 2006;96(11):2032–2039 [DOI] [PMC free article] [PubMed] [Google Scholar]
- 88.Ahmed AT, Mohammed SA, Williams DR. Racial discrimination and health: pathways and evidence. Indian J Med Res. 2007;126(4):318–327 [PubMed] [Google Scholar]
- 89.Walton E. Residential segregation and birth weight among racial and ethnic minorities in the United States. J Health Soc Behav. 2009;50(4):427–442 [DOI] [PubMed] [Google Scholar]
- 90.Telles EE. Racial distance and region in Brazil: intermarriage in Brazilian urban areas. Lat Am Res Rev. 1993;28(2):141–162 [Google Scholar]
- 91.DeNavas-Walt C, Bernadette B, Smith J. Income, Poverty, and Health Insurance Coverage in the United States: 2006. Washington, DC: US Census Bureau; 2007 [Google Scholar]
- 92.Paim J, Travassos C, Almeida C, Bahia L, Macinko J. The Brazilian health system: history, advances, and challenges. Lancet. 2011;377(9779):1778–1797 [DOI] [PubMed] [Google Scholar]
- 93.Valero de Bernabé J, Soriano T, Albaladejo Ret al. Risk factors for low birth weight: a review. Eur J Obstet Gynecol Reprod Biol. 2004;116(1):3–15 [DOI] [PubMed] [Google Scholar]
- 94.Merialdi M, de Onis M. Low birthweight and preterm infants: causes, prevalence and prevention. : Benjamin C, Encyclopedia of Human Nutrition. 2nd ed Oxford, England: Elsevier; 2005:161–167 [Google Scholar]
- 95.Acevedo-Garcia D, Soobader M-J, Berkman LF. The differential effect of foreign-born status on low birth weight by race/ethnicity and education. Pediatrics. 2005;115(1):e20–e30 [DOI] [PubMed] [Google Scholar]
- 96.Chomitz VR, Cheung LWY, Lieberman E. The role of lifestyle in preventing low birth weight. Future Child. 1995;5(1):121–138 [PubMed] [Google Scholar]
- 97.Goldenberg RL, Culhane JF, Iams JD, Romero R. Epidemiology and causes of preterm birth. Lancet. 2008;371(9606):75–84 [DOI] [PMC free article] [PubMed] [Google Scholar]