

Abstract
Objective
To investigate the risk of bone fracture sustained by obese children exposed to falls. We hypothesized that the bone fracture risk of obese children would be greater than that of their nonobese counterparts.
Design and Methods
We developed finite element-based computational models for children that reflected various levels of obesity by varying body mass and the thickness of the subcutaneous adipose tissue layer. The models took account of both the momentum effect of variation of body mass and the cushion effect of variation of soft tissue thickness and examined these two contradictory effects on pelvic bone fracture risk through a set of sideways fall simulations with a range of impact speeds.
Results
The critical impact speed that yielded pelvic bone fracture decreased as the levels of obesity increased, which meant that the momentum effect of a greater body mass took precedence over the cushion effect of the soft tissue layer.
Conclusions
The result suggests that obese children have a greater risk of pelvic bone fracture than do their nonobese counterparts in sideways falls. A further implication is that current child safety devices, systems, and regulations will need to be revisited as the prevalence of child obesity increases.
Introduction
Each year in the United States, 19 million children (14 years or younger) need some form of medical care, 100,000 are permanently crippled, and 15,000 die from accidental injuries (1). In addition, the prevalence of childhood obesity is substantially increasing and presents an important public health issue in most industrialized countries. In the United States, even though there were no significant changes in the prevalence of childhood obesity in the most recent decade (1999-2010), currently, 16.9% of children and adolescents are considered obese (2), that is, with a body mass index (BMI) at or above the 95th percentile on the BMI-for-age-growth chart (3).
Many studies have been conducted on injury prevention for children, but typically these studies are based on average-sized children and their surrogates. Whether current child protective and restraint systems that are optimized for average-sized children are adequate for obese children remains an open question.
Few biomechanical and epidemiologic studies have been conducted to explore the relationship between childhood obesity and traumatic injury severity. Davidson et al (4) investigated the role of biomechanical factors (i.e., impact force, bone strength, fall height, and surface stiffness) on the risk of forearm fractures in obese and nonobese children by use of a rheological-stochastic simulation model. The results showed that obese children had a risk of forearm fracture that was 1.7 times the risk of nonobese children. Another study found a relationship between BMI and injury risk in motor vehicle crashes by using a probability sample of children aged 9-15 years involved in crashes in 2000-2006 (5). That study concluded that obese children are at an increased risk of injury to the lower and upper extremities. Pomerantz et al (6) compared injury characteristics of obese and nonobese children and observed that obese children were significantly more likely to have lower extremity injuries than upper extremity injuries. Meanwhile, Bazelmans et al (7) conducted a cross-sectional study (questionnaire and physical examination) to examine the relationship between obesity and trauma among a sample of 9–17-year-old children, but did not observe an association between child obesity and severe injuries. They noted, however, that the understanding of a potential mechanistic association between obesity and trauma needs more investigation.
To investigate injury severity and mechanisms of the human body, experimental studies are conducted with the use of cadavers, crash dummies, or computer models. Computer crash simulation has emerged as an essential tool for the design, testing, and improvement of safety systems. The computational approach enables researchers to conduct fast and efficient parametric studies under a variety of impact scenarios and to produce a substantial amount of quantitative risk data, which is impossible with cadaveric or dummy tests. No computational model, however, has been developed and tested to reflect obese children. Therefore, the risk, severity, and mechanism of injury sustained by this group of children are still unknown.
The goal of our study was to investigate the risk and injury severity sustained by obese children who are exposed to high-speed impact environments. The hypothesis tested was that the bone fracture risk of obese children would be greater than that of their nonobese counterparts when the two cohorts experienced the same impact. No physical surrogates (i.e., crash dummies) for obese children are available, and experiments on pediatric cadavers are generally not feasible; therefore, we used computational modeling and simulation methods to achieve the goal of the study. We developed models for children that reflected various levels of obesity and investigated pelvic bone fractures against dynamic loading conditions. More specifically, we simulated a set of sideways falls from different heights to measure the effects of variations of trochanteric soft tissue thickness and body mass on the pelvic bone fracture. Even though pelvic fractures in children are uncommon and account for only 2.4-5.5% of pediatric trauma, their hemorrhagic complications result in higher morbidity and mortality than do other forms of orthopedic trauma (8). In this study, we focused on pelvic bone fracture to examine whether a thicker trochanteric soft tissue of obese children effectively mitigates pelvic fracture risk in high-energy traumas such as falls. Perhaps more important than our particular findings with regard to pelvic bone fracture, our study demonstrates the potential of computational modeling methodology in investigations of the orthopedic implications of obesity.
Methods and Procedures
A musculoskeletal model of the 10-year-old pelvis
One of the critical barriers to the study of children is the scarcity of biofidelic computational models of children for use as a baseline model. An in-house finite element (FE) model for a 10-year-old child pelvis was previously developed that includes bone structures and associated joint cartilages and ligaments. The details of the modeling process and model configuration were published previously (9). For completeness, the material constitutive models and properties are listed in Table 1.
Table 1.
Material constitutive models and properties for the musculoskeletal, skin, SAT, and HST of the 10-year-old child pelvis
| Components | Constitutive model |
Properties | References |
|---|---|---|---|
| Cortical bone | Elastic-plastic | Young’s modulus: 12.24 GPa Poisson’s ratio: 0.3 |
9 |
| Average thickness: 1.6 mm Yield strength: 150 MPa Failure strain: 0.027 |
10 | ||
| Trabecular bone |
Elastic-plastic | Young’s modulus: 44.8 MPa Poisson’s ratio: 0.2 |
9 |
| Yield strength: 7.5 MPa Failure strain: 0.25 |
10 | ||
| Interpubic joint cartilage |
Hyperelastic (Monney-Rivlin) |
C10=0.07 MPa, C01=0.315 MPa, C11=0.42 MPa |
9, 11 |
| Sacroiliac joint cartilage |
Hyperelastic (Monney-Rivlin) |
Two parametric C1=2.87 MPa, C2=0.287 MPa |
9, 12 |
| Hip joint cartilage |
Hyperelastic (Monney-Rivlin) |
Two parametric C1=2.87 MPa, C2=0.287 MPa |
9, 12 |
| Interpubic ligament |
4 spring elements | Spring constant: 0.38 kN/mm | 9, 13 |
| Sacroiliac ligament |
16 discrete truss elements |
Young’s modulus: 140 MPa Area: 224 mm2 |
9, 14 |
| Hip ligament | 18 discrete truss elements |
Young’s modulus: 127 MPa Area: 210 mm2 |
9, 15 |
| Sacrospinous ligament |
12 spring elements |
Spring constant: 1.05 kN/mm | 9, 16 |
| Sacrotuberous ligament |
12 spring elements |
Spring constant: 1.05 kN/mm | 9, 16 |
| Skin | Elastic | Young’s modulus: 420 kPa Poisson’s ratio: 0.45 Thickness: 2 mm Density: 1200 kg/m3 |
17
18 19 20 |
| SAT | Viscohyperelastic | C1: 6.33 kPa, C2: 1.58 kPaa G1: 0.5 kPa, G2: 2.2 kPab β1: 0.54, β2: 0.06c Density: 900 kg/m3 |
21
22 |
| HST | Viscohyperelastic | C1: 21.5 kPa, C2: 5.37 kPa G1: 1.72 kPa, G2: 7.53 kPa β1: 0.54, β2: 0.06 Density: 1200 kg/m3 |
Abbreviations: SAT, subcutaneous adipose tissue; HST, homogeneous soft tissue.
C2=0.25 C1 (23).
G1 and G2 are shear relaxation modules.
β1 and β2 are decay constants.
Modeling of different levels of obesity
On the basis of the previously developed child pelvis musculoskeletal model, models were developed for various levels of obesity. The bone surface data were retrieved by parts, such as femur, sacrum, ilium, ischium, and pubis, as shown Figure 1a. Two layers of biological tissue were considered in this study. First, an FE mesh (86,576 tetrahedra) for a homogeneous soft tissue (referred to as HST in this study) that includes skeletal muscles, internal organs, and visceral adipose tissue was generated by filling the enclosed space between the bone surface and the boundary of subcutaneous adipose tissue (SAT). Second, an FE mesh (2,514 tetrahedra) for SAT was generated on the basis of the skin data. This model is referred to as the “normal model” in this study, whose nominal SAT thickness is 3.6 mm (Figure 1b). Three more models were then developed to represent various levels of obesity, by gradually increasing SAT thickness (the nominal trochanteric SAT thickness [TST] is 8.6, 16.3, and 24.7 mm) as shown in Figures 1c, 1d, and 1e, respectively. The total weights of the pelvis-femur complex were 7.04, 7.45, 8.23, and 8.88 kg for the TST 3.6, 8.6, 16.3, and 27.7 models, respectively. A uniform thin layer of shell element (838 triangular) was used for the skin. Hypermesh software (Altair Engineering, Inc., Troy, MI) was used for mesh generation.
Figure 1.
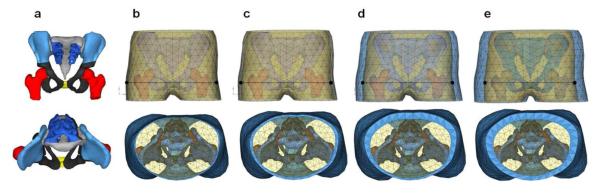
Finite Element (FE) Model of the Pelvis-Femur Complex Including Skin, Subcutaneous Adipose Tissue (SAT), and Homogeneous Soft Tissue (HST). The points in the top row are the measuring points used to calculate pelvic compression and viscous criteria. (a) Pelvis bone surface extracting. (b) Normal model, TST=3.6 mm. (c) TST=8.6 mm. (d) TST=16.3 mm. (e) TST=24.7 mm. TST indicates nominal trochanteric SAT thickness.
Material properties for the soft tissues and model validation
A hyperelastic material model with viscous effect was used for HST and SAT for a better representation of the biological soft tissues. An elastic material was used for the skin. Whereas material constants for SAT and skin from the literature were used, the HST properties that are not available in the literature were optimized to agree with an empirical test data set through a numerical optimization technique described in the previous study (9). The material properties for skin, SAT, and HST are also listed in Table 1. A set of cadaveric experimental data by Ouyang et al (24) was used for model validation, in which child cadaver pelvises were laterally impacted by a plate, and impact force and pelvic viscous criteria (pelvic compression times velocity of deformation) were measured. An FE model was created to replicate the experiment, and computational analyses were performed for model validation. The normal model (Figure 1b) was used for model validation.
Model simulation using the FE code LS-DYNA3D
A nonlinear explicit dynamic FE code of LS-DYNA3D (LSTC, Livermore, CA) (25) was used for model simulation in this study. Bone fracture was simulated by using an element eroding option, in which FEs whose strains exceed a failure strain are eroded (25). When some elements are stressed over the yield stress, the elements easily deform and yield to reach the predefined failure strain. The elements are then eroded and lose the element connectivity so that bone fracture can be observed.
Fall simulation of the body component (pelvis/femur complex)
Computational simulations for sideways fall to a floor were performed by a certain impact speed (v), 3.13 m/s, that simulated a free fall from a height (h) of 0.5 m (v = , where g is acceleration of gravity, 9.8 m/s2). The floor was modeled by a rigid plate for an initial test. Then, more sideways fall tests were performed with sets of soft to cushionable floor properties to examine the effect of different floor properties on the risk of bone fracture. A highly compressive low-density foam material constitutive model (25) was used and the material constants were adjusted to represent relatively soft, medium, and stiff floors. The mechanical responses (impact force, deformation, viscous criteria, stress, and energy) were measured. The impact speed was then varied with a certain range to find a critical impact speed that yielded pelvic bone fracture (i.e., fracture tolerance). The critical impact speed was compared between the different levels of obesity. These model simulations could mainly examine the cushion effect (force attenuating effect) of the trochanteric soft tissue thickness on the bone fracture.
Full-body model to represent the rest of body
To account for the whole-body inertia effect of the body mass (referred to as “momentum effect” in this study, which means that a greater mass of an object results in a greater impact energy when it collides with other objects), the remaining body components (except the pelvis-femur complex) were modeled by use of a method using simple beam and mass elements (26). The whole body was set parallel to the floor. A body mass table for a 10-year-old-child was established (Table 2) on the basis of pediatric body segment parameters and modified adult body segment parameters in the literature. Consequentially, four models were developed, the 50th, 85th, 95th, and over 97th percentiles, on the basis of the age-specific BMI charts for the United States provided by the Centers for Disease Control and Prevention in 2000 (3). The sideways falls were simulated again and the mechanical responses and critical impact speeds that fractured the bone were measured. These model simulations with the full-body model could examine the momentum effect of a greater body mass as the result of obesity.
Table 2.
Body mass distribution
| Model | 50th percentile |
85th percentile |
95th percentile |
Over 97th percentile |
References |
|---|---|---|---|---|---|
| Height, cm | 142.3 | 142.3 | 142.3 | 142.3 | 27 |
| Weight, kg | 33.61 | 39.69 | 45.66 | 50.62 | |
|
| |||||
| BMI | 16.6 | 19.6 | 22.5 | 25.0 | 3 |
|
| |||||
| Head, kg | 3.70 (11.0)a | 3.97 (10.0) | 4.11 (9.0) | 4.30 (8.50) | 28 |
| Upper and mid trunk, kg |
10.65 (31.7) | 13.75 (34.7) | 16.62 (36.4) | 18.91 (37.4) | 29 |
| Upper arms, kg | 1.61 (4.8) | 2.06 (5.2) | 2.47 (5.4) | 2.83 (5.6) | 28 |
| Forearms, kg | 0.94 (2.8) | 1.11 (2.8) | 1.28 (2.8) | 1.42 (2.8) | 28 |
| Hands, kg | 0.61 (1.8) | 0.64 (1.6) | 0.64 (1.4) | 0.63 (1.2) | 28 |
| Thighs, kg | 4.71 (14.0) | 5.56 (14.0) | 6.39 (14.0) | 7.09 (14.0) | 30 |
| Shanks, kg | 3.36 (10.0) | 3.97 (10.0) | 4.57 (10.0) | 5.06 (10.0) | 30 |
| Feet, kg | 1.00 (3.0) | 1.18 (3.0) | 1.36 (3.0) | 1.50 (3.0) | 31 |
|
| |||||
| Sum (Except pelvis- femur complex), kg |
26.57 (79.0) | 32.24 (81.2) | 37.44 (82.0) | 41.74 (82.5) | |
| Pelvis-femur complex, kg |
7.04 (21.0) | 7.45 (18.8) | 8.23 (18.0) | 8.88 (17.5) | |
Values in parentheses are percentages (mass/total mass*100).
Results
Model validation
For model validation, the mechanical responses (i.e., force, displacement, velocity) were calculated and compared with the cadaveric experimental data (24). The impact force versus pelvic deformation and viscous criteria versus time are shown in Figure 2. The responses from the model simulation showed excellent agreement with the experimental data. The percent differences between the means of experimental data and simulation results were 3.8%, 5.3%, and 4.8% for the maximum force, deformation, and viscous criteria, respectively. No pelvic fracture was observed as seen in the experiment.
Figure 2.
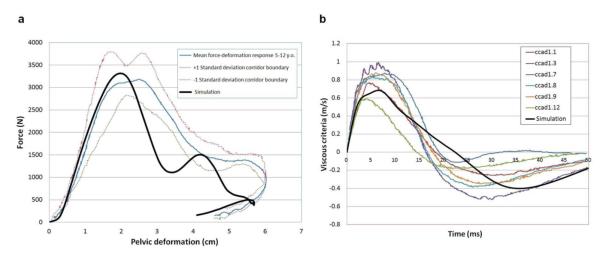
Model Validation. The bold line indicates the simulation. All curves other than the bold line are from the experimental data by Ouyang et al. (24). (a) Impact force versus pelvic deformation. (b) Viscous criteria versus time.
Sideways fall simulations: Pelvis-femur complex
The simulation results (impact force, viscous criteria) using the pelvis-femur complex under an impact speed (3.13 m/s) are presented in Figure 3a and 3b, respectively. The impact force is the contact force between the pelvis-femur complex and the floor. The measuring points for calculation of the viscous criteria are denoted in Figure 1. The strain energy (i.e., potential energy stored in a body) absorbed by the SAT and skin is compared in Figure 3c.
Figure 3.

Results of Sideways Fall Simulation Using the Pelvis-Femur Complex. (a) Impact force. (b) Viscous criteria. (c) Strain energy absorbed by subcutaneous adipose tissue (SAT) and skin. (d) A snapshot for sideways fall simulation and bone fracture. Color contour indicates von-Mises stress. (e) Comparison of critical impact speeds that yield bone fracture (mean values and ± standard deviations of the test results with the use of four different floor properties). TST indicates nominal trochanteric SAT thickness.
The von-Mises stresses (32) were measured at some spots on the cortical bone (i.e., iliac crest, iliac fossa, greater trochanter, femoral neck, femoral head, acetabulum, superior pubic ramus, ischiopubic ramus, inferior pubic ramus, ischial tuberosity, sacrum, and coccyx). The “15 contiguous element criterion” (33) was used to obtain averaged stress between 15 adjoining elements at each measuring spot. The maximum stresses during the entire fall simulation were then obtained. The impact-side inferior pubic ramus was the highest stressed region. All the stresses were less than the yield stress of the cortical bone (150 MPa). Therefore, no bone fracture was observed.
The impact speed was then gradually increased. At a certain impact speed, some elements whose strain exceeded the failure strain were eroded, so that bone fracture was clearly observed. Figure 3d illustrates a snapshot of the impact simulation and bone fracture. The critical impact speed (a minimum impact speed) that yielded bone fracture was found and compared between the four different models, as shown in Figure 3e. Each model was simulated with four different floor properties (i.e., soft, medium, stiff, and rigid) and the mean values and standard deviations are denoted in the figure.
Sideways fall simulations: Full-body
The simulation results (impact force, viscous criteria, and strain energy) of the full-body model under an impact speed (1.9 m/s) are presented in Figure 4. The bone maximum stresses during the entire fall simulation at the measuring spots were obtained. Then, the impact speed was gradually increased to find the critical impact speed that fractured the bone. A snapshot of the full-body simulation is shown in Figure 4d. The critical impact speeds are compared in Figure 4e.
Figure 4.

Results of Sideways Fall Simulation Using the Full-Body Model. (a) Impact force. (b) Viscous criteria. (c) Strain energy absorbed by subcutaneous adipose tissue (SAT) and skin. (d) A snapshot for sideways fall simulation and bone fracture. Color contour indicates von-Mises stress. (e) Comparison of critical impact speeds that yield bone fracture (mean values and ± standard deviations of the test results with the use of four different floor properties).
Discussion
This pilot study presents a novel effort to address the risk of bone fracture sustained by obese children exposed to falls with the use of computational models and simulation methods. The models developed enabled us to take account of both the momentum effect of the body mass and the cushion effect of the trochanteric soft tissue thickness and to examine these two contradictory effects on the bone fracture risk.
The cushion effect of the SAT was observed from the sideways fall simulations by using the pelvis-femur complex. As obesity increased, the impact force curves (Figure 3a) became wider and the peak force was reduced, thus showing the cushion effect (force-attenuating effect) of the SAT. The viscous criteria (Figure 3b) were also reduced and the strain energy absorbed by the SAT (Figure 3c) was increased as obesity increased, which also represent the cushion effect of the SAT. Even though the soft tissues (HST and SAT) can absorb a certain amount of the impact energy, the bone (especially cortical bone) absorbs a significant amount of the impact energy (9). The inferior pubic ramus on the impact side showed the highest stress, followed by the superior pubic ramus on the impact side, inferior pubic ramus on the contralateral side, and ischial tuberosity on the impact side. As obesity increased, the critical impact speed that fractured the bone increased slightly as seen in Figure 3e. This result indicates that the cushion effect of the SAT is shown but is not significant. A softer floor increased the critical impact speed as a result of the cushion effect of the floor.
As expected from the results of the stress distribution, the inferior pubic ramus on the impact side was fractured at the critical impact speed, which is the most common fracture site during pelvic side impact as seen in the literature. For example, a pediatric injury pattern study by McIntyre et al (34) revealed that among 57 cases of pediatric pelvic fractures, 23 cases (40%) were isolated pubic ramus fractures and the other 23 cases (40%) were pubic ramus fractures together with diastasis of the sacroiliac joint. Silber and Flynn (35) stated that 53% of children with an immature pelvis (age range, 6 months to 13 years) who sustained a pelvic fracture underwent an isolated pubic rami fracture. Arbogast et al (36) indicated that isolated pubic rami fracture was a major injury pattern in side impact collisions experienced by 8- to 11-year-old children. The simulation result agreed well with these findings in the literature.
In the full-body simulation, the momentum effect of the full body mass (see Table 2) was accounted for as well as the cushion effect of the SAT. As obesity increased, the impact force curves (Figure 4a) became wider, which was similar to the pelvis-femur only case (see Figure 3a), but the peak force was increased owing to the increased body mass. This means that even though the thicker SAT layer has a cushion effect, the greater momentum effect of the body mass is dominant over the cushion effect. The viscous criteria (Figure 4b) were also increased as obesity increased owing to the momentum effect. The strain energy absorbed by the SAT (Figure 4c) was increased as obesity increased, which means that the cushion effect of the SAT was still shown but had a minor effect on the impact force and viscous criteria. The inferior pubic ramus on the impact side showed the highest stress, similar to the pelvis-femur complex case. In this full-body case, however, the inferior pubic ramus on the contralateral side, the femoral neck on the impact side, and the femoral neck on the contralateral side showed the second, third, and fourth highest stress, respectively. This may have been a result of considering the inertia of the lower extremity.
In the full-body simulation, it is worth noting that as obesity increased, the critical impact speed that fractured the bone decreased significantly, which implies that the pelvic bone of obese children would be fractured at a certain impact speed at which the pelvic bone of normal-weight children would not be fractured. The momentum effect of the greater body mass of overweight and obese children is significant. The inferior pubic ramus fracture on the impact side was also observed in the full-body simulation. As expected, a softer floor increased the critical impact speed as a result of the cushion effect of the floor. Still, as obesity increased, the critical impact speed decreased.
There are some limitations to this study. First, no cadaveric destructive test data for either obese or nonobese children are available to assess the findings of this study. Alternatively, the nondestructive impact test data using child cadavers by Ouyang et al (24), in which all of the subjects were underweight, were used to validate the normal model. Then, destructive impact simulations with the computational child models having various levels of obesity were carried out to estimate the fracture tolerances. Second, all the models had the same size HST layer. Children with different levels of obesity may have different sizes of the HST region, but this study mainly focused on the effect of thickness variation of the SAT layer and body mass on bone fracture risk. Further study is warranted to reflect different sizes and properties of the HST region with the help of magnetic resonance imaging data sets for children. Third, the remaining body components except the pelvis-femur complex were simplified because full-body model development is beyond the scope of the study. The method by use of beam and mass elements, however, guaranteed to account for the whole-body inertia effect. Lastly, the same bone properties were used for all the models. Some studies (37-40) have reported that overweight and obese children have lower bone mineral density and lower bone mass and area for their weight. If the degradable bone properties for obese children can be accounted for by the model, the results would further support our hypothesis.
In conclusion, in the sideways fall simulations, the momentum effect of the greater body mass of obese children took precedence over the cushion effect of the trochanteric SAT layer. Consequentially, under the same impact circumstances, obese children will have a greater risk of pelvic bone fracture than will their nonobese counterparts in sideways falls. A further implication is that current devices, systems, and regulations will need to be revisited and re-engineered to improve safety for obese children.
Supplementary Material
Acknowledgments
Funding/Support: This project was supported by the Nutrition Obesity Research Center (NORC) at the University of Alabama at Birmingham, through a grant from the National Institutes of Health (No. P30DK056336).
Role of the Sponsor: The funding organization had no role in the design and conduct of the study, in the collection, management, analysis, and interpretation of the data, or in the preparation, review, or approval of the manuscript.
Footnotes
Supplementary Material: Movie Animated result of the 95th percentile full-body model simulation at the critical impact speed, with which one can observe the inferior pubic ramus fracture.
Conflict of Interest Disclosures: Dr. Allison has, anticipates, or has had financial interests with the Frontiers Foundation; Vivus, Inc; Kraft Foods; University of Wisconsin; University of Arizona; Paul, Weiss, Wharton & Garrison LLP; and Sage Publications. The rest of the authors have no conflict of interest in relation to the present study.
References
- 1.Benson M, Fixsen J, Macnicol M, Parsch K. Children’s Upper and Lower Limb Fractures. Springer-Verlag; London: 2011. Chapter 3. Polytrauma in children. [Google Scholar]
- 2.Ogden CL, Carroll MD, Kit BK, Flegal KM. Prevalence of obesity and trends in body mass index among US children and adolescents, 1999-2010. JAMA. 2012;307(5):483–490. doi: 10.1001/jama.2012.40. [DOI] [PMC free article] [PubMed] [Google Scholar]
- 3.Kuczmarski RJ, Ogden CL, Guo SS, et al. CDC growth charts for the United States: methods and development. Vital Health Stat. 2000;11(246):1–190. [PubMed] [Google Scholar]
- 4.Davidson PL, Goulding A, Chalmers DJ. Biomechanical analysis of arm fracture in obese boys. J Paediatr Child Health. 2003;39(9):657–664. doi: 10.1046/j.1440-1754.2003.00243.x. [DOI] [PubMed] [Google Scholar]
- 5.Pollack KM, Xie D, Arbogast KB, Durbin DR. Body mass index and injury risk among US children 9–15 years old in motor vehicle crashes. Injury Prevention. 2008;14(6):366–371. doi: 10.1136/ip.2008.019208. [DOI] [PubMed] [Google Scholar]
- 6.Pomerantz WJ, Timm NL, Gittelman MA. Injury patterns in obese versus nonobese children presenting to a pediatric emergency department. Pediatrics. 2010;125(4):681–685. doi: 10.1542/peds.2009-2367. [DOI] [PubMed] [Google Scholar]
- 7.Bazelmans C, Coppieters Y, Godin I, et al. Is obesity associated with injuries among young people? Eur J Epidemiol. 2004;19(11):1037–1042. doi: 10.1007/s10654-004-0158-5. [DOI] [PubMed] [Google Scholar]
- 8.Chia JP, Holland AJ, Little D, Cass DT. Pelvic fractures and associated injuries in children. J Trauma. 2004;56(1):83–88. doi: 10.1097/01.TA.0000084518.09928.CA. [DOI] [PubMed] [Google Scholar]
- 9.Kim JE, Li Z, Ito Y, Huber CD, et al. Finite element model development of a child pelvis with optimization-based material identification. J Biomech. 2009;42(13):2191–2195. doi: 10.1016/j.jbiomech.2009.06.010. [DOI] [PubMed] [Google Scholar]
- 10.Kikuchi Y, Takahashi Y, Mori F. Development of a finite element model for a pedestrian pelvis and lower limb. SAE Technical Paper. 2006-01-0683. doi:10.4271/2006-01-0683. [Google Scholar]
- 11.Li Z, Alonso JE, Kim JE, Davidson JS, Etheridge BS, Eberhardt AW. Three-dimensional finite element models of the human pubic symphysis with viscohyperelastic soft tissues. Ann Biomed Eng. 2006;34(9):1452–1462. doi: 10.1007/s10439-006-9145-1. [DOI] [PubMed] [Google Scholar]
- 12.Anderson AE, Peters CL, Tuttle BD, Weiss JA. Subject-specific finite element model of the pelvis: development, validation and sensitivity studies. J Biomech Eng. 2005;127(3):364–373. doi: 10.1115/1.1894148. [DOI] [PubMed] [Google Scholar]
- 13.Dakin GJ, Arbelaez RA, Molz FJ, Alonso JE, Mann KA, Eberhardt AW. Elastic and viscoelastic properties of the human pubic symphysis joint: effects of lateral impact loading. J Biomech Eng. 2001;123(3):218–226. doi: 10.1115/1.1372321. [DOI] [PubMed] [Google Scholar]
- 14.Li Z, Kim JE, Davidson JS, Etheridge BS, Alonso JE, Eberhardt AW. Biomechanical response of the pubic symphysis in lateral pelvic impacts: a finite element study. J Biomech. 2007;40(12):2758–2766. doi: 10.1016/j.jbiomech.2007.01.023. [DOI] [PubMed] [Google Scholar]
- 15.Hewitt J, Guilak F, Glisson R, Vail TP. Regional material properties of the human hip joint capsule ligaments. J Orthop Res. 2001;19(3):359–364. doi: 10.1016/S0736-0266(00)00035-8. [DOI] [PubMed] [Google Scholar]
- 16.Phillips ATM, Pankaj P, Howie CR, Usmani AS, Simpson AHRW. Finite element modeling of the pelvis: Inclusion of muscular and ligamentous boundary conditions. Med Eng Phys. 2007;29(7):739–748. doi: 10.1016/j.medengphy.2006.08.010. [DOI] [PubMed] [Google Scholar]
- 17.Agache P, Monneur C, Leveque JL, De Rigal J. Mechanical properties and Young’s modulus of human skin in vivo. Arch Derm Res. 1980;269:221–232. doi: 10.1007/BF00406415. [DOI] [PubMed] [Google Scholar]
- 18.Zheng Y, Mak AFT, Lue B. Objective assessment of limb tissue elasticity: Development of a manual indentation procedure. J Rehabil Res Dev. 1999;36(2):71–85. [PubMed] [Google Scholar]
- 19.Seidenari S, Giusti G, Bertoni L, Magnoni C, Pellacani G. Thickness and echogenicity of the skin in children as assessed by 20-MHz ultrasound. Dermatology. 2000;201(3):218–222. doi: 10.1159/000018491. [DOI] [PubMed] [Google Scholar]
- 20.Alekseev SI, Radzievsky AA, Logani MK, Ziskin MC. Millimeter wave dosimetry of human skin. Bioelectrom. 2008;29(1):65–70. doi: 10.1002/bem.20363. [DOI] [PubMed] [Google Scholar]
- 21.Todd BA, Thacker JG. Three-dimensional computer model of the human buttocks in vivo. J Rehabil Res Dev. 1994;31(2):111–119. [PubMed] [Google Scholar]
- 22.Fidanza F, Keys A, Anderson JT. Density of body fat in man and other mammals. J Appl Physiol. 1953;6:252–256. doi: 10.1152/jappl.1953.6.4.252. [DOI] [PubMed] [Google Scholar]
- 23.Vannah WM, Childress DS. Indentor tests and finite element modeling of bulk muscular tissue in vivo. J Rehabil Res Dev. 1996;33(3):239–252. [PubMed] [Google Scholar]
- 24.Ouyang J, Zhu Q, Zhao W, Xu Y, Chen W, Zhong S. Experimental cadaveric study of lateral impact of the pelvis in children. Academic Journal of the First Medical College of PLA. 2003;23(5):397–408. [PubMed] [Google Scholar]
- 25.Hallquist JO. LS-DYNA3D Theoretical Manual. CA Livermore Software Technology Corporation; Livermore: 1998. [Google Scholar]
- 26.Majumder S, Roychowdhury A, Pal S. Simulation of hip fracture in sideways fall using a 3D finite element model of pelvis-femur-soft tissue complex with simplified representation of whole body. Med Eng Phys. 2007;29(10):1167–1178. doi: 10.1016/j.medengphy.2006.11.001. [DOI] [PubMed] [Google Scholar]
- 27.McDowell MA, Fryar CD, Ogden CL, Flegal KM. National Health Statistics Report No. 10. National Center for Health Statistics; Hyattsville, MD: 2008. Anthropometric reference data for children and adults: United States, 2003–2006. [PubMed] [Google Scholar]
- 28.Yokoi T, Shibukawa K, Ae M. Body segment parameters of Japanese children. Jpn J Phys Educ. 1986;31:53–66. [Google Scholar]
- 29.De Leva P. Adjustments to Zatsiorsky-Seluyanov’s segment inertia parameters. J Biomech. 1996;29(9):1223–1230. doi: 10.1016/0021-9290(95)00178-6. [DOI] [PubMed] [Google Scholar]
- 30.Bauer JJ, Pavol MJ, Snow CM, Hayes WC. MRI-derived body segment parameters of children differ from age-based estimates derived using photogrammetry. J Biomech. 2007;40(13):2904–2910. doi: 10.1016/j.jbiomech.2007.03.006. [DOI] [PubMed] [Google Scholar]
- 31.Ganley KJ, Powers CM. Anthropometric parameters in children: a comparison of values obtained from dual energy X-ray absorptiometry and cadaver-based estimates. Gait Posture. 2004;19(2):133–140. doi: 10.1016/S0966-6362(03)00038-9. [DOI] [PubMed] [Google Scholar]
- 32.Crandall SH, Dahl NC, Lardner TJ. An introduction to the mechanics of solids: Second edition with SI units. McGraw-Hill; New York, NY: 1999. [Google Scholar]
- 33.Keyak JH, Rossi SA. Prediction of femoral fracture load using finite element models: an examination of stress- and strain-based failure theories. J Biomech. 2000;33(2):209–214. doi: 10.1016/s0021-9290(99)00152-9. [DOI] [PubMed] [Google Scholar]
- 34.McIntyre RC, Jr, Bensard DD, Moore EE, Chambers J, Moore FA. Pelvic fracture geometry predicts risk of life-threatening hemorrhage in children. J Trauma. 1993;35(3):423–429. doi: 10.1097/00005373-199309000-00015. [DOI] [PubMed] [Google Scholar]
- 35.Silber JS, Flynn JM. Changing patterns of pediatric pelvis fractures with skeletal maturation: implications for classification and management. J Pediatr Orthop. 2002;22(1):22–26. [PubMed] [Google Scholar]
- 36.Arbogast KB, Mari-Gowda S, Kallan MJ, Durbin DR, Winston FK. Pediatric pelvic fractures in side impact collisions. Stapp Car Crash J. 2002;46:285–296. doi: 10.4271/2002-22-0015. [DOI] [PubMed] [Google Scholar]
- 37.Goulding A, Taylor RW, Jones IE, McAuley KA, Manning PJ, Williams SM. Overweight and obese children have low bone mass and area for their weight. Int J Obes. 2000;24:627–632. doi: 10.1038/sj.ijo.0801207. [DOI] [PubMed] [Google Scholar]
- 38.Rocher E, Chappard C, Jaffre C, Benhamou CL, Courteix D. Bone mineral density in prepubertal obese and control children: relation to body weight, lean mass, and fat mass. J Bone Miner Metab. 2008;26(1):73–78. doi: 10.1007/s00774-007-0786-4. [DOI] [PubMed] [Google Scholar]
- 39.Falk B, Braid S, Moore M, O’Leary D, Sullivan P, Klentrou P. Bone properties in overweight pre and early pubertal boys. Pediatr Exerc Sci. 2008;20(1):50–61. doi: 10.1123/pes.20.1.50. [DOI] [PubMed] [Google Scholar]
- 40.Dimitri P, Wales JK, Bishop N. Fat and bone in children: differential effects of obesity on bone size and mass according to fracture history. J Bone Miner Res. 2010;25(3):527–536. doi: 10.1359/jbmr.090823. [DOI] [PubMed] [Google Scholar]
Associated Data
This section collects any data citations, data availability statements, or supplementary materials included in this article.