Abstract
Purpose
To evaluate the potential of whole-body CT to detect localized areas of decreased or increased vascularity in coronary arterial walls.
Methods
We used both microsphere embolization of coronary artery vasa vasorum to generate small areas of hypoperfusion and surrounding hyperperfusion of the arterial wall and diet-induced hypercholesterolemia. As a stimulus for localized angiogenesis, such as occurs in early plaque formation in the coronary arterial wall, microspheres were injected selectively into the LAD coronary artery lumens of anesthetized pigs. Fourteen pigs (acute) then had a segment of their LAD harvested during injection of contrast medium and snap-frozen for subsequent cryo-static micro-CT. An additional thirteen pigs (chronic) were allowed to recover, fed a high cholesterol diet and three months later were again anesthetized and a segment of the LAD artery harvested and scanned. The spatial distribution of the contrast agent within the arterial wall was measured in contiguous micro-CT images at right angles to the lumen axis with the area of wall in each cross-sectional image being approximately (0.1mm)3 in size.
Results
In the acute animals there were no localized areas of increased contrast around the hypoperfused embolized perfusion territories in the arterial wall, but in the chronic animals the hypoperfused areas were surrounded by increased contrast.
Conclusions
These results suggest that CT might be able to detect localized regions of increased vascularity in the arterial wall as an indicator of early atherosclerotic stimulation of vasa vasorum proliferation.
Keywords: Micro-CT, Hyperemia, Arterial wall perfusion, Micro-embolism
INTRODUCTION
There is increasing interest [1–6] in detecting non calcific atherosclerotic changes in the arterial wall, both by changes in local CT values of the wall, reduction due to lipid accumulation, or by local changes in CT values following passage of intravascular contrast agent due to either local angiogenesis or increased permeability of the vasa vasorum. As angiogenesis has been shown to occur prior to plaque formation in the coronary arterial walls of hypercholesterolemic pigs [7] and in the presence of localized ischemia [8], this study used an animal model of localized hyperemia in the coronary artery wall to evaluate the ability to detect angiogenesis as an indication of early plaque development.
As a model of localized increase in arterial wall vasa vasorum, we used microsphere embolization of coronary artery vasa vasorum to generate small areas of hypoperfusion of the arterial wall with the consequential increase of vascularity around that hypoperfused area in a setting of diet-induced hypercholesterolemia. As the perfusion territory of the embolized vasa vasorum is of the order of only a few mm3 they would generally not be resolvable in most clinical CT images because of the partial volume effect (due to relatively large voxels) and local beam hardening due to contrast within the lumen of the coronary artery. We used micro-CT which has adequate spatial resolution, to allow detailed examination of the hypoperfused and any surrounding compensatory hyperperfused regions in the arterial wall. However, micro-CT scans usually involve long scan durations which is incompatible with quantitative imaging of the transient passage of a bolus of contrast agent as well as with the blurring due to cardiogenic motion of the coronary artery. Hence, we use cryo-static micro-CT [9] which literally ‘freezes’ the contrast agent within the arterial wall and thereby eliminates the impact of scan duration relative to the duration of the transient luminal opacification.
Arterial specimens were harvested and snap-frozen immediately after the selective injection of contrast agent into the epicardial coronary arterial lumen. This approach provides the detailed information about spatial distribution of arterial wall perfusion [10]. These images were used to emulate the whole-body CT tomographic image analysis of the coronary arterial wall during the increase in wall opacity immediately after passage of an intravascular bolus of contrast agent.
MATERIAL AND METHODS
Animal Experiment
The animal study was approved by the Mayo Foundation’s Institutional Animal Care and Use Committee.
Twenty-seven domestic, female cross-bred, swine were fed normal laboratory chow up to three months of age, after which thirteen were fed a high cholesterol diet (15% lard, 2% cholesterol – Harlan Laboratories, Madison WI) for an additional three months. At three months of age all pigs were anesthetized, intubated, and ventilated. Electrodes on the limbs were used to monitor the electrocardiogram. A skin incision on the left side of the neck exposed the left carotid artery. A sheath was introduced into the left carotid artery and also served for continuous blood pressure monitoring. Under fluoroscopic control, a guide catheter was introduced into the ostium of the left main and then a 3-Fr micro-catheter was introduced through the catheter and advanced until its tip was positioned in the LAD coronary artery distal to the first diagonal coronary artery branch. Then approximately 5000 gold-coated microspheres (100 m in diameter: BioPal™, Worchester, MA) suspended in 0.6ml normal saline were infused into the LAD coronary artery. After completing the microsphere injection, fourteen pigs were studied acutely (acute Control group) and the remaining thirteen pigs were allowed to recover (Chronic group).
In the fourteen Control pigs, a midline sternotomy provided access to the LAD coronary artery. Ten mL of a radiopaque contrast dye (350mg/mL Iodine, Novaplus Omnipaque™, GE Healthcare, Princeton, NJ) was injected selectively into the LAD. Immediately after completion of the contrast injection a 2cm piece of the mid to distal LAD was rapidly harvested: the LADs were clamped proximally and distally, cut free (with a margin well outside the adventitia on each side to protect and preserve all structures of the vessel wall), and immediately dropped into a slurry of acetone and dry ice for rapid freezing. In some cases blood drained from the coronary vessels, resulting in the LAD segment’s lumen being partially air-filled. Simultaneously with the LAD harvesting, the animals were euthanized with a weight-adjusted intravenous injection of Sleepaway (Fort Dodge Laboratories; Fort Dodge, IA). Once frozen, the specimens were stored at −80°C for subsequent scanning with cryostatic micro-CT.
The remaining thirteen pigs (Chronic Group) were allowed to recover, and fed a diet high in cholesterol. Three months later, these pigs also underwent the coronary artery contrast injection and harvesting procedure described above and then euthanized.
Cryostatic Micro-CT Scanning, Three-dimensional Image Reconstruction and Display
The specimens were prepared and scanned as described previously [10]. In brief, the specimens were maintained at −30°C during the cryostatic micro-CT scan. The maximum transaxial diameter of the specimens scanned was 1.5cm and maximum in axial length was 2.2cm. The molybdenum anode x-ray source was operated at 45kVp and the x-ray beam filtered through a zirconium foil. This narrowed the x-ray spectrum to about 3keV with a mean of approximately 18keV.
The scans involved digital recording of X-ray projection images generated with a cone beam x-ray at 1° intervals around 360°. The tomographic images were computed using a modified Feldkamp cone beam algorithm [11]. The resulting stack of transaxial tomographic images was displayed and analyzed using image analysis software (Analyze™ 9.0, Biomedical Imaging Resource, Mayo Clinic; Rochester, MN). For this study, the cryostatic micro-CT scanner was configured so that the side dimension of the cubic voxels was 18 m (16-bit gray scale). CT gray scale values were expressed in x-ray attenuation units of (1/cm).
Histology
The positions of the individual microspheres in the micro-CT images were used to localize histological sections for visualizing hypoperfused arterial wall. Also, normal perfused arterial vessel wall areas were identified and appropriate histological slides prepared: for this purpose, the snap-frozen specimens (n=4) were transferred in 10% buffered formalin, and then embedded in paraffin. Serial sections (continuous, n=5) were prepared and stained with hematoxylin and eosin. In addition, an Elastica van Giesson, a Goldner and a Prussian blue staining were also performed. The microscopy images were digitized and analyzed by a pathologist (R.M.), who was blinded to the results of the micro-CT image analysis. The atherosclerotic lesions were identified and the degree of the atherosclerotic changes were determined (according to the American Heart Association classification) [12].
Analysis of Tomographic Cryostatic Micro-CT Images
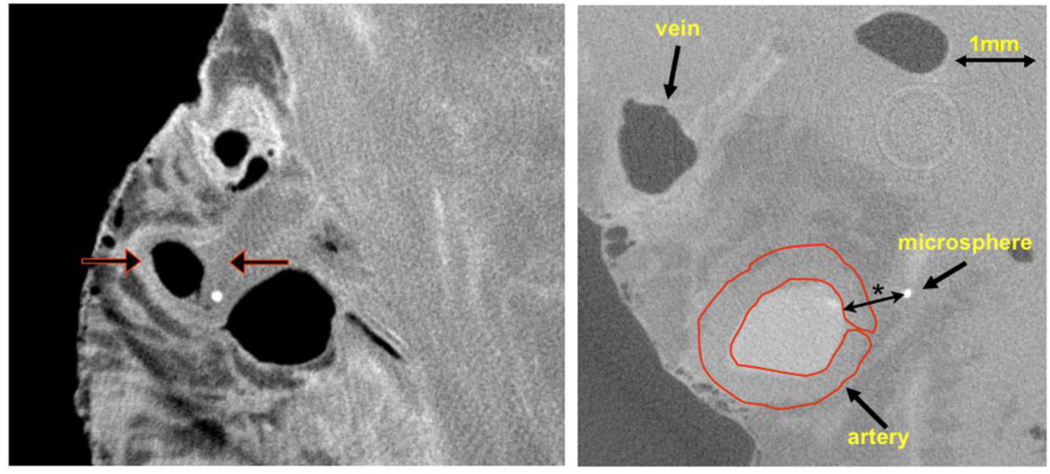
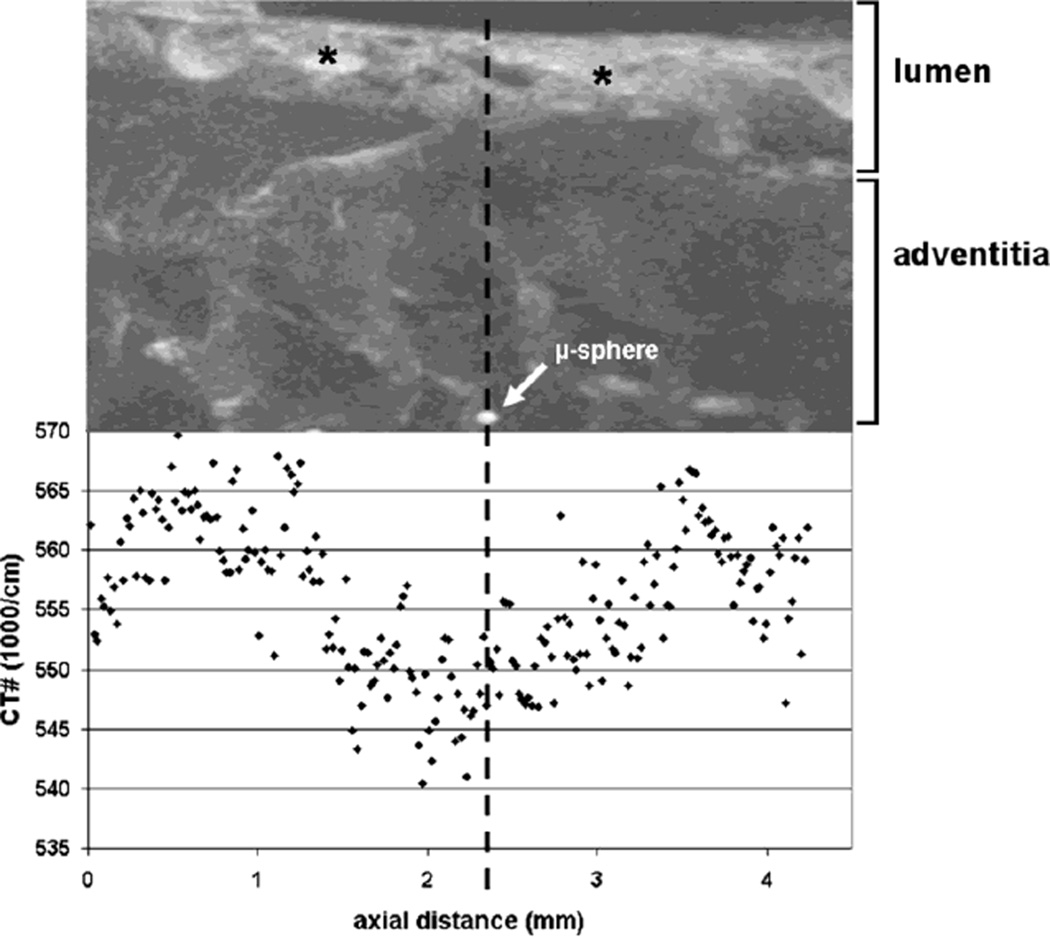
As illustrated in Fig. 1, the 18 m thick cross-sectional slices within the 3D CT image of the arterial segment (on average 950 slices/specimen), the air-filled arterial lumen is clearly distinguishable from the surrounding arterial wall and, in this example, at least one microsphere within the arterial wall region. Each contiguous CT slice through the artery was analyzed individually by creating an annular Region-of-Interest (ROI) that encompassed the entire circumferential extent of the vessel wall. When the abluminal surface of the adventia was not well defined it was assumed to be at least one luminal radius from the coronary artery endothelium, [13] i.e., approximately 1–1.5mm in these samples. Within this ROI the average CT-number was calculated and this value plotted as a function of distance along the luminal axis of the arterial segment. This generated an “opacification profile” along the luminal axis of the arterial specimen which identified areas with decreased perfusion due to opacification defects within the arterial wall (Fig. 2). Any increase in CT value above that of the arterial wall of a specimen harvested without prior injection of contrast agent was assumed to be proportional to the average blood volume within the opacified vasa vasorum [14]. Any localized increase in contrast at the edges of the localized dip in contrast (due to embolization-induced local hypoperfusion) was taken to be due to recruitment or angiogenesis of the vasa vasorum around the hypoperfused area. For convenience, this localized zone of increased contrast will be called the ‘hyperperfused’ zone.
Fig. 1.
Left panel: Cryo-CT cross-section of epi-myocardial “biopsy” with epicardial artery, vein, and one microsphere in the arterial wall. The epicardium is the left interface to air and the fairly homogeneous region on the right is myocardium. The vein and arterial lumens contain air (dark in image) as these were allowed to drain at the time of harvesting. The left arrow indicates the opacified coronary arterial wall. The right arrow points to a region of the arterial wall without contrast in the wall due to the local vasa vasorum being occluded by an embolized microsphere (bright circle). Right panel: same CT image the coronary vessels with the region-of-interest (ROI) use to measure the CT value within the arterial wall
Fig. 2.
Upper panel: The CT-image shows a maximum intensity projection of the specimen along the luminal axis of an epicardial coronary artery. The lumen of the vessel wall still contains some iodine contrast agent (*). Lower panel: The graph shows how the CT-numbers with the wall of the vessel changes along the length of the specimen. In the neighborhood of the microspheres the CT-numbers of the arterial vessel wall decrease due to reduced contrast in the wall as a result of an occluded vasa vasorum and the consequent lack of opacification in this downstream perfusion territory closer to the arterial lumen
Calculation of Perfusion Defects and Hyperperfused Regions within the Arterial Wall
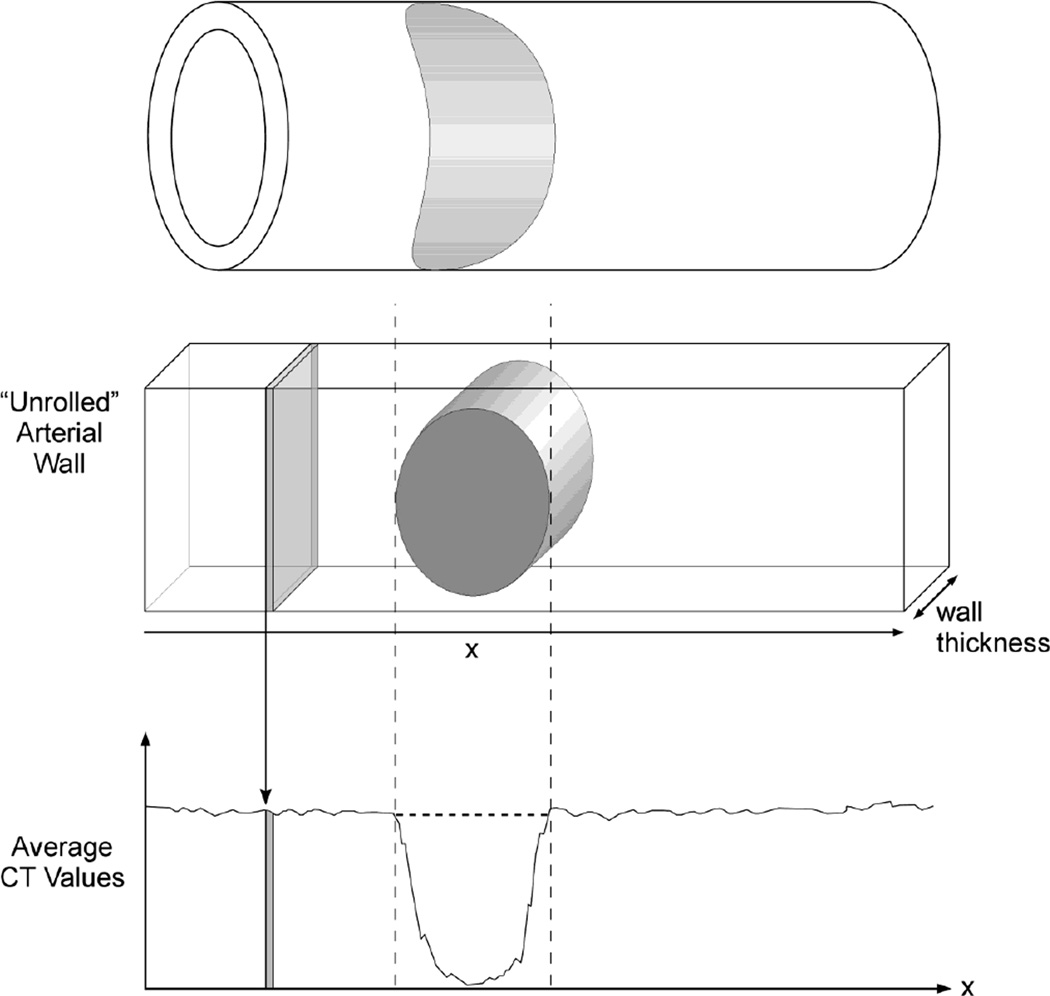
As illustrated schematically in Fig. 3, the “opacification profile” of the arterial segments was used to identify and to quantify the area of the hypoperfused wall (assumed to be elliptical as suggested by the shape of the localized ‘dip’ in the opacity profile) within the entire arterial wall within each cross-sectional CT image. This approach, rather than mapping the spatial distribution of opacification around the circumference of the arterial wall, was used to emulate the likely method of analysis of the arterial wall in a whole-body CT image of a coronary arterial wall. The parameters shown in Fig. 4 were used to calculate the hypoperfused areas and hyperperfused area around the hypoperfused area. Additional details of the computations of areas of the hyper and nonperfused areas are provided in the Appendix.
Fig. 3.
Upper panel: Schematic perspective vein of arterial wall with the gray elliptical region indicating the non perfused territory of an embolized vasa vasorum.
Middle panel: “Unrolled” arterial wall showing the non perfused territory (gray oval) and one of the many thin CT slices used to sample gray scale only the length of the vessel wall which was used to compute the average CT value along the local circumference.
Lower panel: CT values of arterial wall measurements in contiguous CT images among the length of vessel segment. The dip is due to non perfusion (no contrast agent)
Fig. 4.
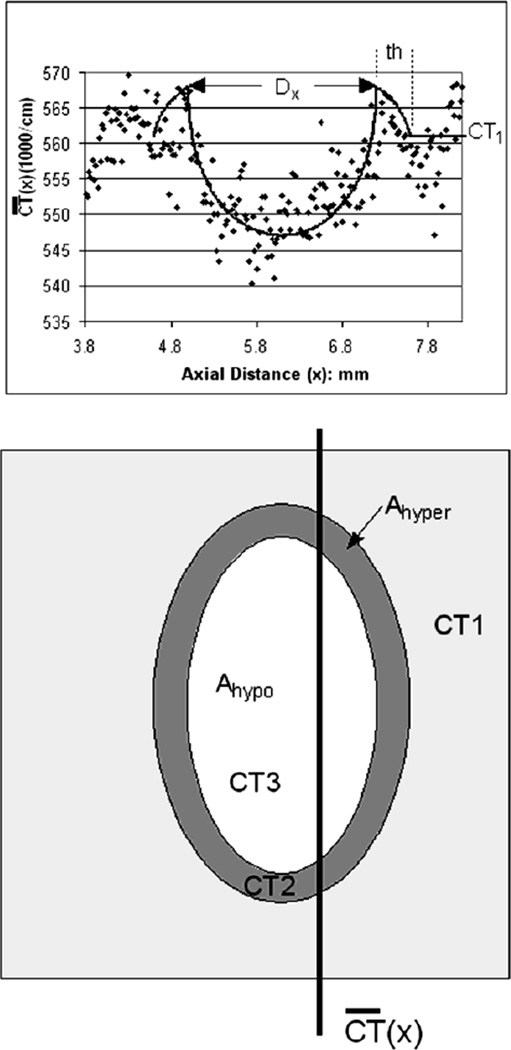
Upper panel - The quantitative image measurements of averaged contrast concentration at sequential locations along the arterial wall were ( at distance×along the arterial segment) generated from the cryo-µCT image data using the ROI illustrated in Figure 1. The contrast profile data (dots) fitted with the model described in the Appendix. The fitted contrast profile was analyzed with the minimum of the opacity ‘dip’ at axial distance 6.0mm where “x” was set to 0.
Lower panel – shows the parameters used in our model. CT1 is the CT # of the normally perfused wall, CT2 is the CT # of the hyperemic rim around the hypoperfused area. CT3 is the CT value within the hypoperfused area. Ahypo is the area of the hypoperfused region. Ahyper is the area of the hyperperfused annulus. 0.533/cm is the CT value of myocardium if no contrast agent was injected. (See Appendix for more details)
The increase of vascular volume in the hyperperfused region is proportional to:
where Ahyper is the area of the hyperperfused region, CT2 is the CT value in the hyperperfused region and CT1 is the value in the normally perfused arterial wall.
The decrease in vascular volume in the hypoperfused region is proportional to:
where Ahypo is the area of the hypoperfused region and CT3 is the CT value within the hypoperfused region, i.e., the CT value of arterial wall when no contrast is injected.
Statistics
The data are presented as mean SD for all arteries. The regression coefficient was calculated using Microsoft Excel 2003. The data were also analyzed using paired and unpaired Student t-tests (JMP 8, JMP R8, SAS, Cory, NC, USA) and a p-value < 0.05 was considered to show a significant difference between variables.
RESULTS
The plasma cholesterol concentrations were 96±13mg/100mL in the Acute Control Group, and 359±163mg/100mL in the Chronic Group (p<0.05).
Histological Analysis of Atherosclerotic Lesions
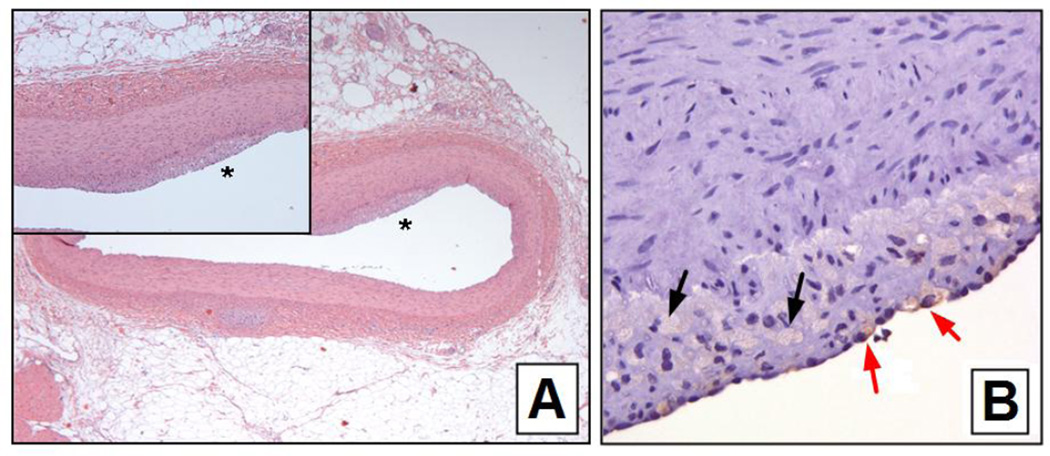
The histological changes in chronically microembolized pigs receiving high-cholesterol diet, included a more advanced hyperplasia of intima and media as well as fatty intima plaques. Fig. 5 shows an example of the appearance of fat/foam cells in the hypercholesterolemic pigs. The total amount of free fat and fat-containing macrophages found in the arterial wall was higher in pigs receiving a high-cholesterol diet. The fat/foam cells counted in the vessel walls of the Acute Group was 8±4/mm2 and in the Chronic Hypercholesterolemic Group was 17±11/mm2 (p<0.02). In the acute animals there was no difference in the perfused and non-perfused regions but for the Chronic Group the regions of the hyperperfused areas had double the number of fat/foam cells.
Fig. 5.
Panel A – H and E stained histological section of the LAD coronary artery of a hypercholesterolemic pig. The noise is a magnified view of the region indicated by the *. Note the subinternal thickening.
Panel B - CD68 staining of the plaque shown in A. The black arrows indicate free fat in vacuoles and the red arrows indicate fat-containing macrophages
Cryo-µCT-Based Analysis of Hypoperfused and Surrounding Hyperperfused Regions
The average of the combined arterial subintima + medial thickness in Chronic Group pigs was 0.37±0.07mm, but in the Acute Group was 0.29±0.03mm (p>1.0). The hyperemic zone width around the hypoperfused regions of the Chronic Group pigs was 0.31±0.09mm. Fig. 4 shows that the local increase in CT value is approximately 0.010/cm above the background of approximately 0.560/cm, i.e., a <2% increase over normal opacification of the arterial wall. The normal opacification increase of the wall, well away from the hypoperfused regions, is also approximately 0.010/cm, i.e., approximately 2% also, hence the total opacification of the hyperperfused regions in about 4% above non opacified wall. This increase in local opacification of the arterial wall is equivalent to 40 Hounsfield units, although is would be expected to be about 8HU at a mean of approximately 60 kV of a 120 kVp clinical CT scan. We conclude from our observations that it is likely that the increase in arterial wall opacity (due to patchy increased vascularity of the vasa vasorum) will be detectable as an index of the angiogenesis that occurs in early plaque formation. The increased local CT value is about 8 HU predicted for a clinical CT scan from those µCT data is likely at the limit of detectability for plaques less than four voxels (i.e., approximately 0.5mm3) in volume. This assumes the myocardial CT value to be approximately 50 HU and the standard deviation of the voxel-to-voxel noise being 15 HU.
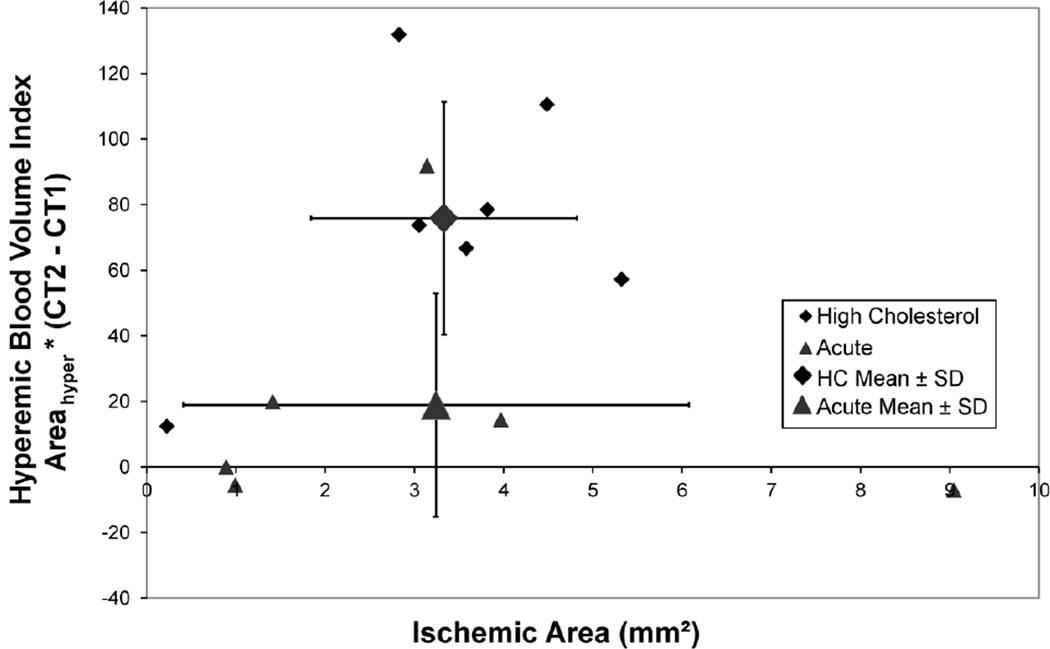
Fig. 6 shows that the hyperperfused blood volume around the embolized hypoperfused area is increased whereas the Acute Group pigs’ arterial walls show no hyperemic increase in CT values. The mean value of the chronic group differs from the acute group at P=0.10.
Fig. 6.
In the Chronic Group pigs increase in total CT values around the hypoperfused region indicate the increase in local microvascular blood volume. In the Control Group pigs there is no hyperperfused annulus around the hypoperfused region as indicated by the lack of local mean in wall CT values
The number of isolated hypoperfused areas that could be analyzed (by method described in the Appendix) was small. This is consistent with the small tissue volume of the arterial wall and perfusion magnitude approximately 0.1mL/g/min [15]. As a 1cm length of the LAD has a wall volume of approximately 0.1cm3 and the volume of myocardium perfused by the LAD in these pigs is about 50 –100 cm3, the ratio of these tissue volumes suggest that the number of microspheres/cm in the arterial wall would be 0.5 – 1/cm. Not surprisingly, therefore, some of the isolated arterial specimens had no perfusion defects.
DISCUSSION
Cryo micro-CT imaging closely represents a ‘frozen’ point in time as would be expected to be observed (at poorer spatial resolution) in a subsecond CT scan image during passage of a bolus of contrast agent. It also offers the important capability of preserving the specimen-status as it was immediately at the time of harvesting because there were no changes in the specimens due to continued movement or diffusion of contrast agent or due to the conservation methodology (for example storage in formalin). The method also preserved the continuity of the vascular structure, which is important for the analysis of hypoperfused arterial vessel wall segments along the axial distance of the coronary artery. The specimens were also suitable for subsequent histological examination as they were not altered by preservation methods that would have been needed for scanning the specimen at room temperature.
The importance of these findings is that it supports the feasibility of detecting of increased localized vascularity of the coronary arterial wall by use of fast, multislice CT during an intravenous injection of contrast agent. As such increase in local vascularity is associated with development of atheromatous plaques prior to marked deposition of fatty deposits and subsequent narrowing of the epicardial arterial lumen, the ability to detect this increased vascularity may provide ability to detect signs of atherosclerosis prior to its hemodynamic impact. Perhaps more important, although that remains to be demonstrated clinically, the non stenosing early plaque might be a source of plaque hemorrhage due to the localized increased vascularity especially as these new vasa vasorum are probably more fragile than the native vasa vasorum. Importantly, current clinical CT scanners are probably not quite able to meet the spatial and contrast resolution needed for the sensitively and specificity needed, although continued development of methods to reduce the need for radiation exposure will likely allow increase of the spatial and density resolution needed for this approach.
Limitations of this study
The confounding factor of clinical CT scanning of the coronary arterial wall is the partial volume effect of the large CT image voxel size relative to the wall thickness and size of early plaques. Micro-CT eliminates this problem but introduced are the problems of use of x-ray kV well below clinical levels (which alters the relative contrast between tissue and the iodine in the contrast agent) and of the long scan duration. Moreover, we scanned isolated arterial segments rather than an in-situ artery. Although our calculations suggest that the CT values of iodine at clinical kV levels will still allow detection of the localized increase in contrast in the arterial wall, this can only be verified with an actual clinical CT scan, a test that would require use of voxels approximately (0.1mm)^3 rather than the current volume of approximately (0.3mm)3. Another concern is the use of a selective contrast injection and use of a snap-frozen specimen at peak opacification of the vasa vasorum is essentially assured by the harvesting technique used. However, in clinical practice the timing of the maximum opacification of the arterial wall and use of intravenous injection of contrast agent may result in suboptimal CT scan timing and absolute opacification. It is likely that dual energy (or spectral) CT would increase the signal-to-noise by virtue of the increased contrast of iodine at x-ray energies lower than the mean of single energy scans at, for instance, 120 kVp [16].
The CT image beam hardening artifact in the immediate surrounding of the opacified arterial lumen would likely be overcome by use of quasi monochromatic x-radiation or by use of spectral CT which can generate CT images from x-ray photons selected from a narrow bandwidth part of the bremsstrahlung x-ray system [17]. Such systems are not currently available for routine clinical use but will likely become available in the next few years.
Acknowledgments
This work was supported in part by National Institutes of Health grants, HL065342 and EB000305.
We thank Dr. V. Herasevich and Ms. Kay D. Parker for helping to perform some of the animal studies, and Ms. Delories C. Darling for editing and formatting this manuscript.
APPENDIX
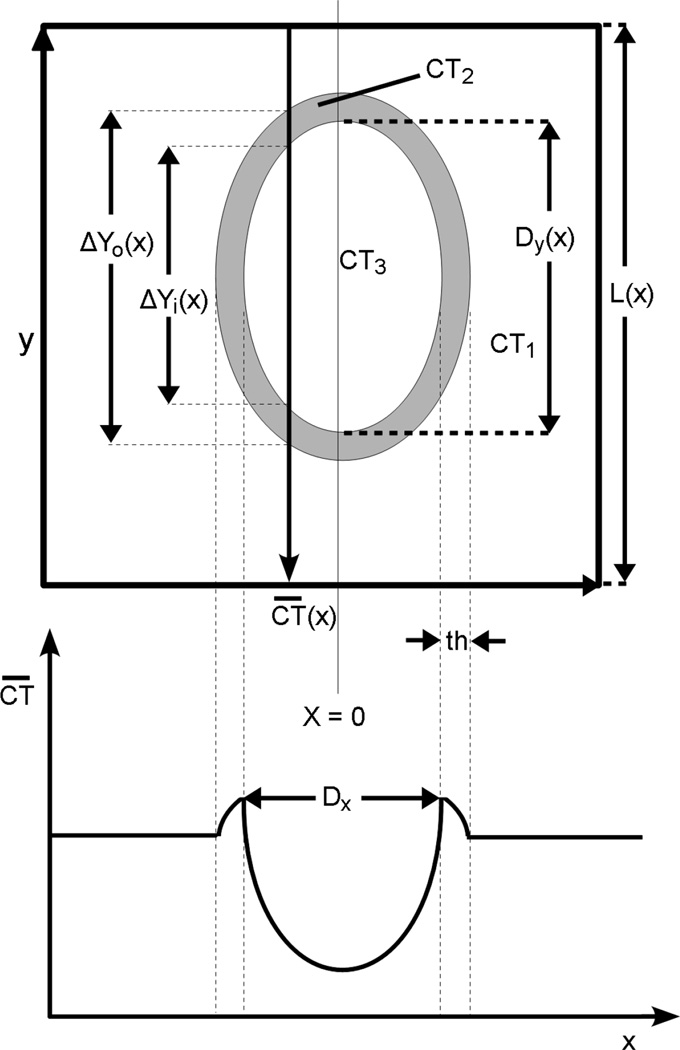
The model used to analyze the increased perfusion around an embolized area of the arterial wall assumed that the hypoperfused area was elliptical in shape and is surrounded by a ring of hyper-vascularized tissue. These areas were determined using the directly measured width (along artery lumen axis) of the hypoperfused area (Dx) and the width of the hyper-vascularized ring (th). Dx, the diameter of the perfusion defect in the axial direction, was measured as the distance between the two hyper-vascularization peaks on the perfusion profile along the axial length of the vessel wall, CT (x) is the average CT gray scale value of the vessel wall in the ROI over the arterial wall in one CT slice. Dx and th was measured as the thickness of the hyper-vascularized ring on the profile. The hypoperfused area’s diameter in the arterial circumferential direction, Dy, could not be directly observed, and was calculated using the following measurements: CT(x) is the average CT gray scale value of the vessel wall in the ROI over the arterial wall in one CT slice. Dx and th as defined above, CT1 is CT value of ‘normal’ myocardium, and CT3 is CT value within the hypoperfused area. The hypoperfused and hyperemic tissues and the normal tissue were each assumed to be of uniform CT values. The CT value of the hypoperfused area was assumed to be 0.533/cm, which is the CT value of myocardium when no contrast agent is in the blood stream. The intensity of normal perfused tissue could be observed anywhere outside the boundaries of the hyper-vascularized region. The two remaining unknowns were CT2 (the CT value in the hyperperfused region) and Dy (the circumference diameter of the perfused defect). These were calculated from the perfusion distribution using two specific points of interest – the maximum of the hyperperfused area, and the minimum value in the hypoperfused region as illustrated in Fig. 7.
Fig. 7.
Upper panel is a schematic of an enface view of an unrolled coronary artery wall. The darker gray elliptical anulus is the hyperemic zone around the hypoperfused zone. The lower panel plots the average circumferential CT gray scale of the total wall CT gray scale value within each contiguous transverse slice along the axis of the arterial lumen
At position × the average CT value along the entire circumference (L) of the arterial wall within a single transluminal section is .
The equation for the average CT value’s minimum in the hypoperfused region is:
The equation for the maximum value in the hyper-perfused region is:
where
and ΔY0 is the (outer) chord of the hypoperfused area in a cross-section at position x.
At x the vertical chord of the outer edge of the hyperemic rim is ΔY0(x) is the chord at the inner edge of the hyperemic ring. Dx is the measured axial diameter of the hypoperfused area and Dy is the calculated diameter in the circumferential diameter. The hyperemic zone width is th.
- Between x locations -(Dx / 2) − th and -(Dx / 2) and between (Dx / 2) and (Dx / 2) + th:
- Between -(Dx / 2) and (Dx / 2) :
- As the area of the elliptical hypoperfused region = ΣΔy(x) then Dy = ΣΔy(x)/(π•Dx)
Noise in the perfusion profile as well as deviations of the hypoperfused area’s shape from elliptical made it difficult to use an analytical solution to calculate the CT2 and Dy variables. Hence, we adjusted an estimate of the values of Dy and CT2 empirically by overlaying a plot of the model onto the perfusion profile and then adjusting the variables until the model best fit to the perfusion profile such that the modeled profile in the regions around and .
Once the best fit values of Dy was established:
The area of the hypoperfused region, Ahypo = (π/4)Dy * Dx and
The area of the hyperperfused region, Ahyper = (π/4)[(Dx+2th)(Dy+2th) − Ahypo)].
REFERENCES
- 1.Schoenhagen P, Murat Tuzcu E, Stillman AE, Moliterno DJ, Halliburton SS, Kuzmiak SA, Kasper JM, Magyar WA, Lieber ML, Nissen SE, White RD. Non-invasive assessment of plaque morphology and remodeling in mildly stenotic coronary segments: comparison of 16-slice computed tomography and intravascular ultrasound. Coron Artery Dis. 2003;14:459–462. doi: 10.1097/00019501-200309000-00007. [DOI] [PubMed] [Google Scholar]
- 2.Achenbach S, Moselewski F, Ropers D, Ferencik M, Hoffmann U, MacNeill, Pohle K, Baum U, Anders K, Jang IK, Daniel WG, Brady TJ. Detection of calcified and noncalcified coronary atherosclerotic plaque by contrast-enhanced, submillimeter multidetector spiral computed tomography: a segment-based comparison with intravascular ultrasound. Circulation. 2004;109:14–17. doi: 10.1161/01.CIR.0000111517.69230.0F. [DOI] [PubMed] [Google Scholar]
- 3.Fayad ZA, Fuster V, Nikolaou K, Becker C. Computed tomography and magnetic resonance imaging for noninvasive coronary angiography and plaque imaging: Current and potential future concepts. Circulation. 2002;106:2026–2034. doi: 10.1161/01.cir.0000034392.34211.fc. [DOI] [PubMed] [Google Scholar]
- 4.Marffei E, Palumbo A, Martini C, Tedeschi C, Arcadi T, La Grutta L, Malagò R, Weustink AC, Mollet NR, De Rosa R, Catalano O, Salamone I, Blandino A, Midiri M, Cademartiri F. Computed tomography coronary angiography in asymptomatic patients. Radiologia Medica. 2011;116(8):1161–1173. doi: 10.1007/s11547-011-0723-4. [DOI] [PubMed] [Google Scholar]
- 5.Leber AW, Knez A, Becker A, Becker C, von Ziegler F, Nikolaou K, Rist C, Reiser M, White C, Steinbeck G, Boekstegers P. Accuracy of multidetector spiral computed tomography in identifying and differentiating the composition of coronary atherosclerotic plaques; A comparative study with intracoronary ultrasound. J Am Coll Cardiol. 2004;43:1241–1247. doi: 10.1016/j.jacc.2003.10.059. [DOI] [PubMed] [Google Scholar]
- 6.Goessl M, Malyar NM, Rosol P, Beighley PE, Ritman EL. Impact of coronary vasa vasorum functional structure on coronary artery vessel wall perfusion distribution. Am J Physiol Heart Circ Physiol. 2003;285:H2019–H2026. doi: 10.1152/ajpheart.00399.2003. [DOI] [PubMed] [Google Scholar]
- 7.Herrmann J, Lerman LO, Rodriguez-Porcel M, Holmes DR, Richardson DM, Ritman EL, Lerman A. Coronary vasa vasorum neovascularization precedes epicardial endothelial dysfunction in experimental hypercholesterolemia. Cardiovasc Res. 2001;51(4):762–766. doi: 10.1016/s0008-6363(01)00347-9. [DOI] [PubMed] [Google Scholar]
- 8.Nakata Y, Shionoya S. An experimental study on the vascular lesion caused by obstruction of vasa vasorum (II). Special considerations on deposition of fat into vascular wall. Jap Circ J. 1970;34:1029–1034. doi: 10.1253/jcj.34.1029. [DOI] [PubMed] [Google Scholar]
- 9.Kantor B, Jorgensen SM, Lund PE, Chmelik MS, Reyes DA, Ritman EL. Cryostatic micro-computed tomography imaging of arterial wall perfusion. Scanning. 2002;24:186–190. doi: 10.1002/sca.4950240405. [DOI] [PubMed] [Google Scholar]
- 10.Gössl M, Beighley PE, Malyar NM, Ritman EL. Role of vasa vasorum in transendothelial solute transport in the coronary vessel wall: A study with cryostatic micro-CT. Am J Physiol: Heart Circ Physiol. 2004;287(5):H2346–H2351. doi: 10.1152/ajpheart.00066.2004. [DOI] [PubMed] [Google Scholar]
- 11.Jorgensen SM, Demirkaya O, Ritman EL. Three-dimensional imaging of vasculature and parenchyma in intact rodent organs with X-ray micro-CT. Am J Physiol Heart Circ Physiol. 1998;275:1103–1114. doi: 10.1152/ajpheart.1998.275.3.H1103. [DOI] [PubMed] [Google Scholar]
- 12.Stary HC, Chandler AB, Glagov S, Guyton JR, Insull W, Jr, Rosenfeld ME, Schaffer SA, Schwartz CJ, Wagner WD, Wissler RW. A definition of initial, fatty streak, and intermediate lesions of atherosclerosis. A report from the Committee on Vascular Lesions on the Council on Atherosclerosis, American Heart Association. Arterioscler Thromb. 1994;114(5):840–856. doi: 10.1161/01.atv.14.5.840. [DOI] [PubMed] [Google Scholar]
- 13.Miao C, Chen S, Macedo R, Lai S, Liu K, Li D, Wasserman BA, Vogel-Claussen J, Lima JA, Bluemke DA. Positive remodeling of the coronary arteries detected by magnetic resonance imaging in an asymptomatic population: MESA (Multi-Ethnic Study of Atherosclerosis) J Am Coll Cardiol. 2009;53(18):1708–1715. doi: 10.1016/j.jacc.2008.12.063. [DOI] [PMC free article] [PubMed] [Google Scholar]
- 14.Liu Y-H, Bahn RC, Ritman EL. Dynamic intramyocardial blood volume: evaluation with a radiological opaque marker method. Am J Physiol. 1992;263:H963–H967. doi: 10.1152/ajpheart.1992.263.3.H963. (Heart Circ Physiol 32) [DOI] [PubMed] [Google Scholar]
- 15.Heistad DD. Blood flow through vasa vasorum in arteries and veins: effect of luminal pO2. Am J Physiol: Heart Circ Physiol. 1986;250:H434–H442. doi: 10.1152/ajpheart.1986.250.3.H434. [DOI] [PubMed] [Google Scholar]
- 16.Kelcz F, Joseph PM, Hilal SK. Noise considerations in dual energy CT scanning. Med Physics. 1979;6(5):418–425. doi: 10.1118/1.594520. [DOI] [PubMed] [Google Scholar]
- 17.Le HQ, Molloi S. Least squares parameter estimate methods for material decomposition with energy discriminating detectors. Med Phys. 2011;38(1):245–255. doi: 10.1118/1.3525840. [DOI] [PMC free article] [PubMed] [Google Scholar]


