

Abstract
This study asks people with Down syndrome, ages 12 and older, about their self-perception so that their information could be shared with new and expectant parents of children with Down syndrome. We analyzed valid and reliable survey instruments from 284 people with Down syndrome on the mailing lists of six non-profit Down syndrome organizations around the country. Among those surveyed, nearly 99% of people with Down syndrome indicated that they were happy with their lives; 97% liked who they are; and 96% liked how they look. Nearly 99% people with Down syndrome expressed love for their families, and 97% liked their brothers and sisters. While 86% of people with Down syndrome felt they could make friends easily, those with difficulties mostly had isolating living situations. A small percentage expressed sadness about their life. In our qualitative analysis, people with Down syndrome encouraged parents to love their babies with Down syndrome, mentioning that their own lives were good. They further encouraged healthcare professionals to value them, emphasizing that they share similar hopes and dreams as people without Down syndrome. Overall, the overwhelming majority of people with Down syndrome surveyed indicate they live happy and fulfilling lives.
Keywords: Down syndrome, prenatal diagnosis, attitudes, self-esteem, trisomy 21
INTRODUCTION
As international discussion is mounting over new prenatal testing for Down syndrome (DS) [Skotko, 2009], one perspective has been noticeably absent from the research literature—the voices of people with DS, themselves. While autobiographies have been written [Burke and McDaniel, 2001; Kingsley and Levitz, 1994], speeches given [Murray, 2010], and personal Web pages created [Seale, 2001], people with DS have not had their views collectively and systematically analyzed. And, yet, their views are central to some of the most pressing questions from expectant couples: What does it mean to have DS? Will my baby with DS be happy? Will my baby have a good life?
People with DS have varying levels of “self-concept”—that is, how they think and feel about themselves. For typically developing persons, this principle has been generally divided into six developmental stages, which has been shown to be the same, albeit delayed, for people with DS: self-recognition (the ability to recognize oneself), self-representation (the ability to distinguish oneself from others), self-description (the ability to articulate features about oneself), self-assertion (the ability to be motivated toward a behavioral goal), self-regulation (the ability to change one’s behaviors based on situation), and self-evaluation (the ability to reflect on oneself) [DesRosters and Busch-Rossnagel, 1997; Glenn and Cunningham, 2004]. This last developmental category, also referred to as self-esteem, has only been studied in small samples of people with DS.
A number of small-scale studies have looked at the question of self-concept and self-esteem in those with DS. These findings have suggested that, with regard to the domains of academic competence, physical abilities, and social acceptance, young persons with DS held very positive views of themselves, which became even more positive with age [Begley, 1999]. Young children with DS, ages 4–6, had a self-concept that was similar to that of developmentally age-matched controls [Cuskelly and de Jong, 1999]; and young adults with DS rated themselves positively on measures of self-esteem [Glenn and Cunningham, 2001]. Through a combination of interviews, photographs, and standardized tests, another cohort of young adults with DS, ages 17–24, all had a high self-esteem, not impacted by their varying degrees of awareness about their genetic condition [Cunningham and Glenn, 2004]. When asked to describe themselves, these young adults had “a strong bias towards positive rather than negative descriptions” [Glenn and Cunningham, 2004]. When they made social comparisons, they tended to make more “downward comparisons” (i.e., “I’m better than …”) than “upward comparisons” (i.e., I’m worse than …”) [Glenn and Cunningham, 2004].
Together, these studies suggest that people with DS tend to have a positive self-esteem, but, until now, no large-scale study had been performed within the United States. As increasingly more couples are learning about a diagnosis of DS prenatally, the need is also growing for more accurate self-perspectives from people living with the condition. Today’s expectant couples are also asking for more nuanced information—simply knowing that people with DS have a positive self-esteem no longer seems to be sufficient. Expectant couples want to know the ability of people with DS to make friends, engage in meaningful relationships, and participate in family dynamics. In this study, we ask people with DS about their lives and—for the first time—their advice for expectant couples.
MATERIALS AND METHODS
Participants
This study was nested in a larger cross-cultural, epidemiologic research project on family attitudes toward persons with DS. Attitudinal perspectives from parents/guardians and brothers/sisters will be published separately. The project was approved as protocol H-26552 by the Institutional Review Board of Boston University Medical Center.
We purposely limited participation in this study to people with DS who were 12 years of age or older, as younger persons would be more dependent on their parents or guardians for survey completion. Previous literature also suggests that people with DS begin to make relative social comparisons and form complex social understandings about their condition around the verbal mental age of 8 [Cunningham and Glenn, 2004], which generally corresponds to our eligibility criterion based on chronological age. Five persons with DS, recruited through nonprofit DS organizations, participated in the piloting of our survey instrument. For validity and reliability testing of the questionnaire, all 300 families associated with the Down Syndrome Society of Rhode Island were invited to participate. No national DS registry exists; as such, the surveys were ultimately distributed to all of the 4,924 family members of 6 non-profit DS organizations, chosen for their size, cultural compositions, and geographic distribution throughout the United States: Down Syndrome Association of Atlanta (757 members), Massachusetts Down Syndrome Congress (1,143 members), Mild High Down Syndrome Association (Denver, CO) (877 members), Triangle Down Syndrome Network (Raleigh, NC) (280 members), Down Syndrome Association of Central Texas (371 members), and Down Syndrome Association of Los Angeles (1,574 members).
Survey Instrument
Phase I: Piloting
At the start of this study, there were no validated or reliable self-completing survey instruments that measured self-concept in people with DS. The measurements used in previous studies all required in-person administration [Glenn and Cunningham, 2004; Begley, 1999; Cuskelly and de Jong, 1999; Glenn and Cunningham, 2001; Begley and Lewis, 1998], which was not feasible for a project of this national scale. To this extent, we created a 4-page questionnaire for people with DS who were 12 years of age or older (published as an Appendix online) with direct input from participant representatives. Previous studies have shown that people with DS are able to comprehend and respond reliably to carefully constructed questions about their self-perceptions [Begley, 1999]. We measured self-perception, self-esteem, and attitudes toward other family members with 4-item Likert scale responses (“Yes”; “Most of the Time”; “Once in a While”; “No”), as Likert scales have been shown to be the best measure when surveying children [van Laerhoven et al., 2004]. As optional measures, participants were asked to report sociodemographic information. Through open-ended questions, we asked about participants’ perspectives on DS since researchers have increasingly called for more qualitative data from patients with genetic conditions [Bernhardt, 2008].
For a focus group that met for two sessions, 5 persons with DS were recruited through known contacts of the researchers. They were observed completing survey drafts, allowing us to edit the surveys for additional clarity.
Phase II: Validity & Reliability Testing
We next distributed our questionnaire to all family members of the Down Syndrome Society of Rhode Island for validity and reliability testing. We estimate about 39% of their families have children with DS who are 12 years of age or older. Those who responded to the first mailing received an identical questionnaire 4 weeks later for test-retest reliability. In total, 14 responses (12%) from people with DS were received after the first mailing, and 7 (50%) of these respondents completed the second mailing.
Construct validity was determined by measuring discriminant validity on the first mailing, which was defined a priori as a Pearson’s correlation between −0.4 and +0.4 between dissimilar constructs on our survey instrument. The constructs were identified as question 14 (positive construct) and question 19 (negative construct). The survey met our criteria for discriminant validity (r = −0.37, N = 14), providing evidence that respondents understood the differences between questions with dissimilar constructs. Reliability was determined by measuring test-retest reliability on the second mailing, which was defined a priori as >80% of participants responding ≤ 1 point difference on our Likert scale. Two questions failed to meet this reliability and were eliminated from our final survey instrument used for national distribution. The responses from our participants in this Phase were not included in our final data analyses. The final survey had a Flesch-Kincaid grade level of 2.6; and the survey was translated into Spanish and checked by another native Spanish-speaking person for accuracy.
Phase III: Study
After our surveys were deemed valid and reliable, they were bundled in a national mailing to 6 non-profit DS organizations using evidence-based best practices: We provided self-addressed stamped envelopes [Edwards et al., 2002]; nonrespondent families were mailed a second copy of the questionnaire approximately 6 weeks after receiving the first copy [Edwards et al., 2002; Nakash et al., 2006]; the questionnaire packet was mailed on university stationery [Edwards et al., 2002]; and the survey was kept purposely short to encourage completion [Edwards et al., 2002]. Each mailed packet contained separate surveys, cover letters, and response envelopes for (a) parents/guardians, (b) brother and sisters, and (c) people with DS. (The results from the other family members will be published separately.) The packet included instructions asking parents and guardians to give their son or daughter with DS their survey along with their own response envelope. This survey began with a simple introduction stating that the person with DS could (a) complete the survey on their own, returning it back to their parents/guardians in the provided envelope or (b) seek assistance from their parents/guardians. In the latter cases, parents/guardians were asked in their cover letter to be instructive but not directive: “It is okay to help your son or daughter complete their surveys. You can even read the survey to them. However, we ask that you simply interpret any difficult words or phrases, but do not direct them in responding in a particular way. For example, with the question, ‘Do you feel you make a difference in other people’s lives?,’ you can explain what the word, ‘difference,’ means, if needed, to your child with Down syndrome; but please do not coax or direct them to respond in a particular way. The results will only be as meaningful and believable as they are truthful.”
At all times, confidentiality of the respondents was maintained. The survey packets were mailed only to the non-profit DS organizations, who then forwarded the mailings to their members. Packets written in Spanish were mailed by the non-profit DS organizations to their known members who were exclusively Spanish-speaking. Contact information was received only when the person with DS voluntarily chose to respond to the survey. Upon receipt of the surveys, contact information was separated from the questionnaire and stored in a locked file cabinet. No personal identifiable information was linked to the responses in our database. Through unique identifier numbers assigned to each mailed packet, we were able to link family questionnaires together for intra-family comparisons. One author randomly checked 15% of the data entry by the research assistant, achieving 99% accuracy with differences resolved.
Data Analyses
Our survey collected both quantitative and qualitative responses so mixed methods were used to analyze the data. Means and standard deviations were calculated for each of the close-ended Likert questions. To examine the relationships between the responses, paired Pearson’s correlations were calculated with significance designated at p values of .05, .01, and .001. A composite functional activity score was calculated for each person with DS by summing the 7-point Likert statements from the linked parent surveys for each functional activity (e.g., walking, preparing meals, going on dates). Any response of “not applicable” was assigned a score of “1,” with the composite functional activity score ranging between 7–77. Higher scores represented higher levels of parental perceived functionality. To adjust these scores, we divided the composite functional activity score by the participant’s age in years. From the same linked parent surveys, we obtained a 7-point health conditions score—”To what extent does your son or daughter with Down syndrome, in your opinion, have significant health problems?”—with “1” being “not a problem” and “7” being “very much of a problem.” We also obtained a 7-point educational score—”To what extent does your son or daughter with Down syndrome, in your opinion, have significant educational/learning difficulties?”—with “1” being “not a problem” and “7” being “very much of a problem.”
To explore which variables might best predict the 10 attitudinal responses of our participants, we performed mixed stepwise, multivariate regression analyses. Variables were entered at the probability level of .05, and the standardized β and R2 are reported. To determine significance of our models, ANOVA was performed, and df, F, and p values for the models that achieved significance at .05 level are reported. The independent variables included the parent-reported age-adjusted composite functional activity score, parent-reported health conditions score, parent-reported educational challenges score, parent-reported birth order, and participant-reported sociodemographic variables (age, race, gender, number of brothers and sisters, state, religion, educational level, and living situation).
The responses to the two open-ended questions about advice for expectant parents and physicians were coded by the first two authors using the Constant Comparative Method of Qualitative Analysis [Glaser and Strauss, 1967]. Thematic saturation was achieved after reviewing 30 responses for the first question and 35 responses for the second question. De novo themes were not subsequently identified. At least one author coded 319 surveys for each question; approximately 10% were blindly coded by the second author with coding agreement achieved at 97%. Differences were discussed, and mutual agreement was obtained. We report those themes that were used by at least 5% of respondents.
RESULTS
Respondents
We received 319 responses from persons with DS. Of the parents who responded to their surveys, about 39% reported that their children with DS were 12 years of age or older. Given that 4,924 families were invited to participate in our research, we would have asked, approximately, 4,924 × 0.39 or 1,925 people with DS ages 12 or older to complete a questionnaire. As such, our estimated response rate was 319/1,925 or 17%.
Of the 319 responses, 23 were from individuals who returned the survey but indicated that they did not wish to respond. An additional 4 surveys were excluded because they were from persons younger than 12 years of age. A further 8 were excluded because their questionnaires did not have an identifier number, which would have allowed us to link their surveys with their parents’ responses. The remaining 284 surveys were included in our analysis; as such, our functional response rate was 284/1,925 or 15%. Not everyone responded to each question so the number of responses varied per item. Twelve participants chose not to provide their date of birth, but were included in the analyses with the assumption that the majority, if not all, were in the targeted age group.
The average age of the person with DS responding to the survey was 23.4 years (N = 266; SD = 8.9, range 12.1–51.9). They had, on average, 2.0 brothers and sisters (N = 273; SD = 1.3) and 2.0 parents (N = 273; SD = 0.4). As can be seen from Table I, respondents were proportionally distributed by geography, and there was diversity among Hispanic origin and religion. The functional skills of our respondents with DS, as rated by their parents and adjusted for age, were normally distributed (M = 2.2; SD = 0.6; Shapiro-Wilk W test, p = 0.43) (Figure 1). This means that our study surveyed persons with DS who had a range of functional skills. Respondents had a diversity of educational backgrounds, with the majority being in high school or post high school. The majority of respondents identified themselves as white who lived at home with one or both of their parents or guardians.
Table I.
Characteristics of Respondents with Down Syndrome (N = 284).
| Background Variables | % |
|---|---|
| Sex (N = 267) | |
| Male | 54 |
| Female | 46 |
| Age (N = 266) | |
| ≥12 and <18 | 32 |
| ≥18 and <25 | 32 |
| ≥25 and <30 | 14 |
| ≥30 and <35 | 10 |
| ≥35 and <40 | 5 |
| ≥40 | 6 |
| Spanish/Hispanic/Latino (N = 267) | |
| Yes | 10 |
| No | 90 |
| Race (N = 275) | |
| White | 88 |
| Black or African American | 2 |
| Asian | 2 |
| Other | 5 |
| Multiple | 2 |
| U.S. State (N = 277) | |
| California | 30 |
| Massachusetts | 25 |
| Colorado | 21 |
| Georgia | 8 |
| North Carolina | 6 |
| Texas | 4 |
| Other | 6 |
| Religious Affiliation (N = 264) | |
| Protestant | 41 |
| Catholic | 40 |
| Jewish | 6 |
| Atheist | 6 |
| Mormon | 2 |
| Other | 6 |
| Educational Level (N = 269) | |
| Currently in 1st through 8th grade | 17 |
| Currently in high school | 28 |
| Finished high school and working | 34 |
| Finished high school, but not working | 13 |
| Currently in college/university | 6 |
| Finished college and working | 1 |
| Finished college, but not working | 1 |
| Living Situation (N = 278) | |
| Living with one/both parents/guardians | 84 |
| Living alone in apartment/home | 6 |
| Living with roommates in apt/home | 7 |
| Living in group home | 3 |
| Other | 3 |
Percentages might not add to 100% due to rounding.
FIGURE 1. Distribution of Parent-rated Functional Activity Scores per Age.
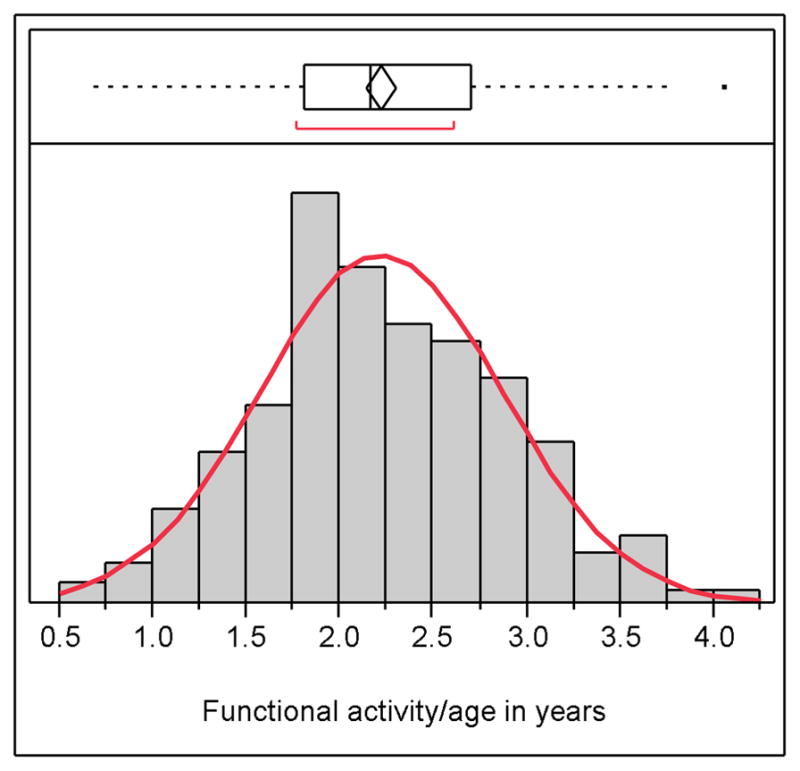
A standardized composite functional activity score was calculated for each person with DS by summing their parents’ responses to 7-point Likert statements about functional activities (e.g., walking, preparing meals, going on dates) and dividing that score (range 7–77) by the participant’s age in years. The standardized functional skills of our respondents with DS were normally distributed.
Feelings and Perceptions About Self
The overwhelming majority of people with DS are happy with their lives, like how they look, and like who they are (Table II). The degree of happiness was inversely related to the number of parents/step-parents involved in their lives—that is, those persons with DS who had more step-parents were less likely to be absolute in their affirmation of happiness. Religion also played a minor role (Happiness = 1.1 + 0.1 Number of parents − 0.2 Catholic, Multiple religions, or Other religion + 0.2 Protestant or Mormon (R2 = 0.05, F[0.05;3;266] = 4.9, p < 0.01)). The degree of liking who they are was partially related to their living situation. Those respondents who were living in a group home were less likely to be as happy as those people with DS living with roommates, alone, or with their parents. Geographic location also was related (Like Self = 1.5–0.5 Living with parents, Living alone, Living with roommates, or Other living situation + 0.5 Living in group home + 0.1 MA or CA − 0.1 CO, NC, TX, or GA (R2 = 0.22, F[0.05;5;251] = 13.6, p < 0.0001)). Appreciation of their own appearance was inversely related to parental perception of significant health problems—that is, those parents who thought their children had many health problems were more likely to have sons and daughters who were not satisfied with their looks (Like how look = 1.1 + 0.1 Health conditions (R2 = 0.02, F[0.05;1;252] = 5.0, p < 0.03)). All of these positive feelings of self-esteem were positively correlated (Table IV).
Table II.
Feelings and Perspectives about Self.
| Statements | N | M* | SD | % Agree† |
|---|---|---|---|---|
| Are you happy with your life? | 276 | 1.2 | 0.5 | 99 |
| Do you like who you are? | 277 | 1.2 | 0.5 | 97 |
| Do you like how you look? | 278 | 1.2 | 0.6 | 96 |
| Are you sad about your life? | 277 | 3.7 | 0.6 | 4 |
People with Down syndrome were asked to rate their level of agreement with the statements on a Likert scale with “1” being “yes”; “2” being “most of the time”; “3” being “once in a while”; and “4” being “no.”
Percentage of people with DS who circled “yes” or “most of the time” for that statement.
Table IV.
Correlation Among Responses on Survey Statements.
| A | B | C | D | E | F | G | H | I | J | |
|---|---|---|---|---|---|---|---|---|---|---|
| A | — | |||||||||
| B | 0.61* | — | ||||||||
| C | 0.32* | 0.19† | — | |||||||
| D | 0.09 | 0.06 | 0.11 | — | ||||||
| E | 0.30* | 0.28* | 0.32* | 0.19† | — | |||||
| F | 0.21* | 0.10 | 0.09 | 0.11 | 0.12‡ | — | ||||
| G | −0.30* | −0.33* | −0.21* | 0.01 | −0.15‡ | −0.06 | — | |||
| H | 0.12 | 0.18† | 0.11 | 0.03 | 0.12 | 0.22* | −0.13‡ | — | ||
| I | 0.12 | 0.22* | 0.08 | 0.09 | 0.36* | 0.23* | −0.04 | 0.51* | — | |
| J | −0.12 | −0.08 | −0.03 | 0.00 | −0.21* | −0.08 | 0.08 | −0.01 | −0.06 | — |
The statements were as follows: A: Are you happy with your life?; B: Do you like who you are?; C: Is it easy to make friends?; D: Do you feel that you help other people?; E: Do you like how you look?; F: Do you love your family?; G: Are you sad about your life?; H: Do you like your brothers(s) or sisters(s)?; I: Do you feel your brother(s) or sisters(s) is a good friend?; J: Do you feel your parents pay more attention to your brother(s) or sister(s) and not enough to you?
p < 0.001.
p < 0.01.
p < 0.05.
A small number of people with DS indicated that they were sad about their lives. Being in high school or just out of high school was more associated with this feeling (Sad = 3.8–0.1 High school, Finished high school and working, Finished high school and not working, or College + 0.1 Grade school, Finished college and working, Finished college and not working (R2 = 0.02, F[0.05;1;276] = 6.4, p < 0.01)). This feeling was negatively correlated, as would be expected on a validated instrument, with the measures of positive esteem (Table IV).
Feelings and Perspectives about Others
The overwhelming majority of people with DS reported that they love their family, including their brothers and sisters (Table III). There were no identified predictors for loving one’s family, since nearly all respondents reported love. The fondness of brothers and sisters was associated, in part, with race and geographic location (Like Brothers and Sisters = 1.6 – 0.4 (White, Black, Asian, American Indian/Alaska Native, or Native Hawaiian/Pacific Islander) + 0.4 Multiple races − 0.2 CO, MA, or TX + 0.1 GA (R2 = 0.21, F[0.05;4;257] = 16.5, p < 0.01)). A sizable majority of respondents consider their brother or sister a good friend; and those who did tended to have more siblings, with some geographic variation (Brother and sister good friend = 1.4 – 0.1 Number of siblings − 0.2 TX + 0.2 CO, MA, NC, or GA (R2 = 0.02, F[0.05;1;276] = 6.4, p < 0.01)). Only a small percentage of people with DS felt that their parents paid a disproportionate amount of attention to their siblings. Those who did tended to live alone or have more parentally perceived learning disabilities (Parent attention to other siblings = 2.8 – 0.2 CO, MA, NC, GA, or CA + 0.2 TX − 0.4 Living alone or Other living arrangement + 0.4 Living with parents, Living with roommates, or Living in group home − 0.1 Educational issues (R2 = 0.13, F[0.05;5;223] = 6.6, p < 0.0001)).
Table III.
Feelings and Perspectives about Others.
| Statements | N | M* | SD | % Agree† |
|---|---|---|---|---|
| Is it easy to make friends? | 276 | 1.5 | 0.9 | 86 |
| Do you feel that you help other people? | 275 | 1.5 | 0.8 | 85 |
| Do you love your family? | 277 | 1.1 | 0.3 | 99 |
| Do you like your brother(s) or sisters(s)? | 258 | 1.2 | 0.5 | 97 |
| Do you feel your brother(s) or sisters(s) is a good friend? | 255 | 1.4 | 0.8 | 89 |
| Do you feel your parents pay more attention to your brother(s) or sister(s) and not enough to you? | 256 | 3.4 | 1.0 | 15 |
People with DS were asked to rate their level of agreement with the statements on a Likert scale with “1” being “yes”; “2” being “most of the time”; “3” being “once in a while”; and “4” being “no.”
Percentage of people with DS who circled “yes” or “most of the time” for that statement.
The majority of people with DS indicated that they can make friends easily. Those who did not were more likely to be living in a group home (Easy to make friends = 2.2–0.4 Living with parents, Living alone, Living with roommates, or Other living situation + 0.4 Living in group home (R2 = 0.03, F[0.05;2;258] = 3.6, p < 0.03)). The majority of respondents, particularly those with more parentally perceived functional skills, also felt that they help other people. People with DS who had finished college and did not have a job were less likely to feel this way, with some geographic considerations (Help other people = 4.0 – 0.3 Functionality/year − 1.3 Grade school, High school, Finished high school and working, Finished high school and not working, College, or Finished college and working + 1.3 Finished college and not working + 0.1 CO, MA, or GA + 0.3 NC − 0.2 TX + 0.1 CA (R2 = 0.12, F[0.05;5;241] = 6.3, p < 0.0001)).
Advice for New Parents
We analyzed all of the answers to the open-ended questions, with 63% of participants responding to the question on advice that they would give to new parents of children with DS (Table V). Many people with DS wanted to emphasize to new parents that there will be mutual love between the baby and them (e.g., “If you love the baby with all your heart, that is what really matters”; “The baby will bring you happiness”; “Love them, and they will love you lots”). They mentioned that their own lives are good (e.g., “If everyone was as happy as me, that would be great”; “It’s not so bad having Down syndrome”; “I am very happy in my life. I have friends who care about and love me”; “It’s okay to have special needs”) and underscored that new parents need not worry (e.g., “Don’t be sad. We can all learn”; “Everything is going to be okay”; “Don’t be afraid. Your baby will have a wonderful life”).
Table V.
If a new mom and dad just had a baby with Down syndrome, what would you like to tell them?
| Category | Total* | % |
|---|---|---|
| love your baby / your baby loves you | 61 | 35 |
| life is good / happy to be alive / positive | 60 | 34 |
| suggested parenting tips (e.g., feed your baby) | 36 | 21 |
| don’t worry / It’s okay | 33 | 19 |
| described physical characteristics of DS | 15 | 9 |
| information about school / learning | 12 | 7 |
| a negative comment about DS / I don’t like… | 10 | 6 |
| described a degree of specialness | 9 | 5 |
| people with DS have different needs | 8 | 5 |
Indicates number of respondents who incorporated this category in their response to this question; percentages will not add to 100%, as responses might contain more than one category.
Some of the participants offered parenting tips (e.g., “Let the child have a dream and go for it”; “You must give the baby more attention than your other children”; They need to give extra help for their child’s speech…be careful about heart problems…”; “Treat them like a normal child”; “…teach the baby sign language…travel with the baby…get the baby’s eyes checked…”). Patience received special emphasis (e.g., “The baby has to work hard. Help the baby reach their goals”; “If things come hard, don’t give up”; “Be patient because I found out that it is harder for me to learn”).
Some survey participants pointed out the similarities between people with DS to those without DS (e.g., “The baby is just like you and me, just a little different”; “That the kid is not different from a regular person just because they have a disability”; “I feel like a regular person”). Some people shared negative feelings about DS (e.g., “Sometimes your baby will be sick a lot. Take them to the hospital”; “I hate special needs. I want to be a regular person like my brother”). Others directly encouraged parents to continue their pregnancies (e.g., “Take the baby home”; “They should keep their kid. Don’t abort”; “You have a nice baby. Please take care of the baby”).
Advice for Physicians
Approximately 66% of survey participants answered the open-ended question, which asked what they would like physicians to know about life with DS (Table VI). Nearly half of the respondents mentioned that their lives are good or that they are happy with their lives (e.g., “I am proud of who I am”; “My life is perfect”; “I really do love my life”; “My life rocks”; “I work hard and I am happy”; “I have Down syndrome, and I’m cool”). Some asked to be valued (e.g., “I am not any different from other people”; “Look at me. I can do all sorts of things you didn’t think I could”; “Don’t label us. People with Down syndrome do a lot of things”; “I would like parents to value a person with Down syndrome”). Others emphasized that they have the same hopes and dreams as people without DS (e.g., “It’s easy. Just follow your dreams”; “We are great people. There are many possibilities for us. We can be anything!”; “I would like to get married some day. I would like to move into an apartment with other people”; “I am just a guy who likes football, baseball, and basketball”).
Table VI.
What would you like to tell doctors about your life with Down syndrome?
| Category | Total* | % |
|---|---|---|
| life is good / I’m happy to be alive / positive | 85 | 46 |
| please take care of our medical needs | 50 | 27 |
| information about school / learning | 27 | 15 |
| value us / we’re okay | 27 | 15 |
| information about participation in sports | 24 | 13 |
| we have same hopes and dreams | 21 | 11 |
| description of family / love | 21 | 11 |
| a negative comment about selves | 21 | 11 |
| information about friends | 18 | 10 |
| discuss positive self-esteem | 15 | 8 |
| information about their job | 12 | 7 |
| discussion of religion/service | 9 | 5 |
Indicates number of respondents who incorporated this category in their response to this question; percentages will not add to 100%, as responses might contain more than one category.
Other respondents commented on their friends (e.g., “I like hanging out with my brother and my friends”; “I like to visit friends and play X-Box with them”; “I have nice friends and [like] going out in the community”; “All my friends have Down syndrome like me. It’s not so bad to live with it”), family (e.g., “My mom says I’m the perfect son for her. She says she is lucky I’m her boy”; “I am loved by my family, grandparents, many aunts and uncles and cousins”), or school/community activities (e.g., “I work. I go to school. I have friends and I have fun”; “I volunteer at the civic theater as an usher”; “I like to walk to the harbor to the bank”; “I swim in the summer, play golf in the fall, and snow ski in the winter”; “One of my challenges I beat was passing [the state’s standardized exam]. After I passed I got my high school diploma”). Some responses did not address the question (e.g., “I would like to say ‘hi’”; “It’s important to know what sex your child will be”; “Maybe if they would listen to me”). Others shared negative viewpoints (e.g., “I would like to get rid of the extra chromosome”; “I am stuck with my parents due to my health [diabetes]”; “I hate being Down syndrome but I do have a good life and friends”; “Down syndrome affects how I think and learn compared to a regular person”; “I wish I could drive a car”; “I don’t like it, but I deal with it in a positive way”).
DISCUSSION
Overall Results
The overwhelming majority of people with DS, ages 12 and older, who were included in our survey responded that they are living happy and fulfilling lives. They love their families—brothers and sisters included. Such positive self-esteem was associated, to varying degrees, with the number of parents at home and the person’s religion, geographic location, living situation, and health condition.
Yet, even more intriguing was what was not associated with their reported happiness. The functional skills of the person, for example, had no bearing on their self-esteem. Our participants had normally-distributed functional skills when adjusted for age; and, still, even those with the lowest or the highest skills reported the same levels of personal satisfaction. Further, our respondents had varying degrees of learning challenges, as reported by their parents; but, regardless, they responded with similar positivity.
When asked to give advice to expectant parents, participants affirmed that they were happy with their lives. They reassured expectant parents that their baby with DS will love them and that their family will be better as a result of that child. These themes of self-worth, value, and acceptance were echoed again when participants were asked to provide advice to physicians. To this extent, the people with DS that we surveyed have declared that they are very satisfied—and even positive—about their lives, despite acknowledging the challenges that might accompany the genetic condition.
Societies have not always portrayed life with DS in a similar tone. Parents of sons and daughters with DS have consistently reported that the initial information received from their healthcare providers was often inaccurate, incomplete, or offensive [Skotko and Bedia, 2005; Skotko, 2005a; Skotko, 2005b; Skotko, Kishnani, et al., 2009; Skotko, Capone, et al., 2009]. People with DS, themselves, witness their intellectual disability being disparaged when the “R-word” is used in popular song lyrics and playground banters (www.r-word.org). And, still today, institutions remain open around the globe for children with DS who are unwanted by their families (http://www.disabilityrightsintl.org/). Like groups facing discrimination before them, their self-descriptions contrast to the ways in which others might describe them. An open question remains whether societies will ultimately embrace their message as accepted principle [Skotko, 2009].
Of course, the high self-esteem and personal satisfaction from our participants with DS was not uniform. A small percentage of people with DS did report that they were sad. They tended to be young adults in high school or just out of high school. Of course, such a time is often awkward and uncomfortable for many teenagers without DS; so such results might simply underscore that people with DS experience many of the same social and emotional struggles as their peers without disabilities [Chicoine and McGuire, 2010; Couwenhoven, 2007; McGuire and Chicoine, 2006]. Additionally or alternatively, the result might highlight the unique challenges faced by people with DS during this important transition age. While peers without DS might be making plans for college or jobs, they might be realizing, perhaps for the first time, that their futures will be different. As friends move away and life no longer has the standardized structure of school, loneliness can set in. While not all young adults with DS in high school felt this way, this study underscores that special attention should be given to the emotional needs of high school students with DS.
People with DS largely felt that they could easily make friends throughout their lives; yet, those who struggled were often young adults and adults living in group-home settings. Such living situations can be—but do not need to be—socially limiting. Often, people living in group homes interact with the same small number of people on a daily basis; and, frequently because of lack of transportation, they have no independent access to other persons, where friendships can be maintained. Also, people in group homes often have no say in the choice of housemates. As such, a difficult relationship with someone in the group home might color their feelings about friendships, in general. Additionally or alternatively, people with DS living in group homes might be characteristically different from those living in other environments. For example, adults with DS in group homes might have more intellectual challenges or come from families where they were less socially integrated. At minimum, this study underscores the need to foster more meaningful friendships for people with DS living in group-home settings. This might be through increased choice of housemates, better matching of housemates, or more social opportunities outside of the group-home setting.
Limitations of Current Study
This study is subject to selection bias. Only families who were on the mailing lists of non-profit DS organizations were sampled, making it possible that their views are not representative of all people with DS in the United States. Although efforts are being put in place by national organizations like the National Down Syndrome Society (www.ndss.org), no national population-based registry currently exists for people with DS. Until such a time occurs, researchers have no other way of sampling large cohorts of families other than through the nonprofit DS organizations. We purposely invited every family of the sampled non-profit DS organizations to participate in our research, so as to not further restrict the selection bias within the organizations. We also took particular care to invite only those members of the sampled non-profit DS organizations, so as to not allow unfettered selection bias that might have occurred, for example, with an open-invitation web-based survey. In the end, over 300 people with DS responded, making the results powerful, even if they are not representative.
This study is also subject to non-response bias. Our response rate of 17%, however, is within average standards—e.g., the Pew Research Center cites between 15–25% response rates on their studies [The Pew Research Center for the People & the Press, 2001]. Emerging research shows that the response rates on national surveys have been declining over time and that lowered response rates do not necessarily reflect lower survey accuracy [Singer, 2006]. The non-profit DS organizations do not collect reliable and robust demographics on their members, so we were unable to know how representative our participants were of their members, at large.
The small SDs on our Likert-scale questions indicate that our respondents shared very similar opinions. While we made every attempt to be inclusive of people with varying functional abilities through this mailed questionnaire, people with DS who had extensive behavioral problems or medical conditions might have been uninterested, unable, or unwilling to participate. The possibility remains that these persons could have more negative viewpoints, making our results a positive overrepresentation of the attitudes of all people with DS. Without a national, population-based registry, however, no accurate estimates exist for how many people with DS might have such extensive problems. Surveying such individuals by mailed questionnaires might also be unfeasible.
Our results might also be limited by parental influences on participants’ responses. We took all possible steps that we could imagine with a mailed survey to mitigate this effect: the people with DS were given their own cover letter stating that they could complete the survey on their own; they received their own return envelope so that they could seal their responses before returning to their parents for mailing; their parents were also asked directly in their cover letter to be instructive, but not directive, if they were asked for help. Beyond direct observation, which was not possible for a study of this scope, we do not have a way of assessing how many families might have deviated from this request.
Our results are also limited by the lack of diversity of our respondents, who did not include many black/African Americans, Asian, American Indian, or Alaska Native Americans. The results from the parent/guardian respondents (published separately) also showed that their median gross household income of $100,000 was significantly higher than the national median gross household income of $49,777 reported in the last Census income publication in 2009 [DeNavas-Walt et al., 2010]. Americans of certain social and ethnocultural backgrounds might also be less likely to respond to mailed surveys. Our results, however, did include 10% representation from Spanish/Hispanic/Latino Americans, compared to 16% of Americans who identified themselves as such in the last U.S. Census [Humes et al., 2010]. We purposely chose to oversample in areas of the country with high numbers of Spanish/Hispanic/Latino Americans, and we also made all of our survey materials available in Spanish.
Future Research
People with DS have rarely been surveyed in the research literature. For healthcare professionals and policymakers to best understand their needs and concerns, researchers should continue to seek their involvement in new survey tools. The results from this study open many more questions: What are the hopes and dreams of people with DS? What are their experiences in the educational system, the healthcare system, and the workplace? What barriers do they face during their daily lives? What personal issues concern them the most? When a DS population-based registry is established, such questions can and should be asked of a representative sample.
This study purposely did not compare people with DS to matched individuals without DS, so we cannot surmise how similar or dissimilar their attitudes might be to the general population. Future studies might ask whether people with DS are more “happy with their life” than people who do not have DS. Do people with DS “like how they look” more than people who do not have DS? Such studies would, in essence, wrestle with the very meaning of “disability”: are the limitations defined or perceived?
Implications
The American College of Obstetricians and Gynecologists, the American College of Medical Genetics, the National Society of Genetic Counselors, the National Down Syndrome Society, and the National Down Syndrome Congress wrote a consensus statement in 2009 calling for all prenatal counseling about DS to be complete, consistent, nonjudgmental, and non-coercive. Included in the counseling should be balanced information that “accurately reflect aspects of the medical, educational and social realms of individuals with Down syndrome and the challenges and opportunities they and their families face” [American College of Obstetricians and Gynecologists, et al., 2009]. This study meets this charge, in part, by beginning to capture reflections from people with DS about their very own lives.
These data can now be incorporated into informational prenatal booklets about DS, such as the one created by Lettercase, Inc. (www.lettercase.org) in collaboration with the national organizations issuing the 2009 consensus statement. Our findings can also be incorporated into educational opportunities for medical students, genetic counseling students, nurses, and the public, at large. Healthcare professionals might use the study as a point of discussion during conversations about forthcoming noninvasive prenatal diagnostic testing for DS, and policymakers might consider these self-reflections as a way to better inform legislation about people with DS.
Perhaps more importantly, these reflections of people with DS can be shared during prenatal counseling sessions. When an expectant couple receives a prenatal diagnosis of DS, health care professionals can now share evidence-based statements from actual people with DS, with the understanding that these statements are based on the population we sampled:
The overwhelming majority of people with DS are happy with their lives.
The overwhelming majority of people with DS like who they are and how they look.
The overwhelming majority of people with DS love their families, including their brothers and sisters.
The majority of people with DS feel they can easily make friends.
The majority of people with DS feel that they help other people.
Only a small percentage of people with DS feel sad about their lives, which appears to be associated, in part, to transition points of adolescence.
Supplementary Material
Acknowledgments
We would like to thank Allen Crocker, M.D., for his mentorship on this research; Alison Clapp, MLIS, of Children’s Hospital Boston Library for her assistance with our literature search; Heather Reppert for database entry; Gil Levine for survey processing; Zoila Martinez of the National Down Syndrome Congress for translating the survey materials into Spanish; and Sion Kim Harris, Ph.D. C.P.H., of the Clinical Research Program, Survey and Measurement Core, of Children’s Hospital Boston, for her assistance with our statistical analyses. We further thank Maureen Gallagher of the Massachusetts Down Syndrome Congress; Cynthia Jones of the Down Syndrome Association of Atlanta; Laurie Herrera of the Mile High Down Syndrome Association; Claudia Lowe of the Down Syndrome Society of Rhode Island; Leigh Menconi and Martin Osterhout of the Triangle Down Syndrome Network; Suzanne Shepherd of the Down Syndrome Association of Central Texas; and Gail Williamson of the Down Syndrome Association of Los Angeles for the distribution of the surveys to their organizational memberships. This project was supported by grants from the Tim White Foundation, the Fred Lovejoy House-staff Research and Education Fund, and the Joel and Barbara Alpert Endowment for the Children of the City. NIH grant number is 1F32HD068101-01A1
References
- American College of Obstretricians and Gynecologists, American College of Medical Genetics, National Society of Genetic Counselors, National Down Syndrome Society, National Down Syndrome Congress. Toward concurrence: Understanding prenatal screening and diagnosis of Down syndrome from the health professional and advocacy community perspectives. 2009. p. 9. [Google Scholar]
- Begley A. The self-perception of pupils with Down syndrome in relation to their academic competence, physical competence and social awareness. International Journal on Disability, Development and Education. 1999;46:515–529. [Google Scholar]
- Begley A, Lewis A. Methodological issues in the assessment of the self-concept of children with Down syndrome. Child Psychology & Psychiatry Review. 1998;3:33–40. [Google Scholar]
- Bernhardt BA. The role of qualitative research in medical genetics: Listening to the voices of our patients. Am J Med Genet A. 2008;146A:3132–3135. doi: 10.1002/ajmg.a.32587. [DOI] [PubMed] [Google Scholar]
- Burke C, McDaniel JB. A special kind of hero: Chris burke’s own story. Lincoln, NE: iUniverse.com, Inc; 2001. p. 256. [Google Scholar]
- Chicoine D, McGuire B. The guide to good health for teens and adults with Down syndrome. Bethesda, MD: Woodbine House; 2010. p. 392. [Google Scholar]
- Couwenhoven T. Teaching children with Down syndrome about their bodies, boundaries, and sexuality. Bethesda, MD: Woodbine House; 2007. p. 332. [Google Scholar]
- Cunningham C, Glenn S. Self-awareness in young adults with Down syndrome: I. awareness of down syndrome and disability. International Journal on Disability, Development and Education. 2004;51:335–361. [Google Scholar]
- Cuskelly M, de Jong I. Self-concept in children with Down syndrome. Down Syndrome Research and Practice. 1999;4:59–64. [Google Scholar]
- DeNavas-Walt C, Proctor BD, Smith JC. Income, poverty, and health insurance coverage in the United States: 2009. U.S. Census Bureau; 2010. [accessed on May 5, 2011]. Available at http://www.census.gov/prod/2010pubs/p60-238.pdf. [Google Scholar]
- DesRosters FS, Busch-Rossnagel NA. Self-concept in toddlers. Infants Young Child. 1997;10:15–26. [Google Scholar]
- Edwards P, Roberts I, Clarke M, DiGuiseppi C, Pratap S, Wentz R, Kwan I. Increasing response rates to postal questionnaires: Systematic review. BMJ. 2002;324:1183. doi: 10.1136/bmj.324.7347.1183. [DOI] [PMC free article] [PubMed] [Google Scholar]
- Glaser BG, Strauss AL. The discovery of grounded theory: Strategies for qualitative research. New York, NY: Aldine Publishing Co; 1967. [Google Scholar]
- Glenn S, Cunningham C. Evaluation of self by young people with Down syndrome. International Journal on Disability, Development and Education. 2001;48:163–177. [Google Scholar]
- Glenn S, Cunningham C. Self-awareness in young adults with Down syndrome: II. self-understanding. International Journal on Disability, Development and Education. 2004;51:363–381. [Google Scholar]
- Humes KR, Jones NA, Ramirez RR. Overview of race and hispanic origin: 2010. U.S. Census Bureau; 2011. [Accessed on May 5, 2011]. Available at http://www.census.gov/prod/cen2010/briefs/c2010br-02.pdf. [Google Scholar]
- Kingsley J, Levitz M. Count us in: Growing up with Down syndrome. New York, NY: Harcourt Books; 1994. p. 198. [Google Scholar]
- McGuire D, Chicoine D. Mental wellness in adults with Down syndrome. Bethesda, MD: Woodbine House; 2006. p. 432. [Google Scholar]
- Murray GV. Able to do great things. [Accessed March 15, 2011];News Telegram. 2010 Mar 28;2010 http://www.telegram.com/article/20100328/NEWS/3280503/1101/newsrewind. [Google Scholar]
- Nakash RA, Hutton JL, Jorstad-Stein EC, Gates S, Lamb SE. Maximising response to postal questionnaires--a systematic review of randomised trials in health research. BMC Med Res Methodol. 2006;6:5. doi: 10.1186/1471-2288-6-5. [DOI] [PMC free article] [PubMed] [Google Scholar]
- Seale JK. The same but different: The use of the personal home page by adults with Down syndrome as a tool for self-presentation. Br J Educ Technol. 2001;32:343–352. [Google Scholar]
- Singer E. Nonresponse bias in household surveys. Public Opin Q. 2006;70:637–645. [Google Scholar]
- Skotko B, Bedia RC. Continuing a pregnancy after a prenatal diagnosis of Down syndrome in Spain: A four-case report. Progr Diag Trat Prenat. 2005;17:189–192. [Google Scholar]
- Skotko B. Mothers of children with Down syndrome reflect on their postnatal support. Pediatrics. 2005a;115:64–77. doi: 10.1542/peds.2004-0928. [DOI] [PubMed] [Google Scholar]
- Skotko BG. Prenatally diagnosed Down syndrome: Mothers who continued their pregnancies evaluate their health care providers. Am J Obstet Gynecol. 2005b;192:670–677. doi: 10.1016/j.ajog.2004.11.001. [DOI] [PubMed] [Google Scholar]
- Skotko BG. With new prenatal testing, will babies with Down syndrome slowly disappear? Arch Dis Child. 2009;94:823–826. doi: 10.1136/adc.2009.166017. [DOI] [PubMed] [Google Scholar]
- Skotko BG, Capone GT, Kishnani PS Down Syndrome Diagnosis Study Group. Postnatal diagnosis of Down syndrome: Synthesis of the evidence on how best to deliver the news. Pediatrics. 2009;124:e751–8. doi: 10.1542/peds.2009-0480. [DOI] [PubMed] [Google Scholar]
- Skotko BG, Kishnani PS, Capone GT Down Syndrome Diagnosis Study Group. Prenatal diagnosis of Down syndrome: How best to deliver the news. Am J Med Genet A. 2009;149A:2361–2367. doi: 10.1002/ajmg.a.33082. [DOI] [PubMed] [Google Scholar]
- The Pew Research Center for the People & the Press. [Accessed October 11, 2010];About our survey methodology in detail. 2010 http://people-press.org/methodology/about/
- van Laerhoven H, van der Zaag-Loonen HJ, Derkx BH. A comparison of Likert scale and visual analogue scales as response options in children’s questionnaires. Acta Paediatr. 2004;93:830–835. doi: 10.1080/08035250410026572. [DOI] [PubMed] [Google Scholar]
Associated Data
This section collects any data citations, data availability statements, or supplementary materials included in this article.