

Abstract
The human connectome project (HCP) relies primarily on three complementary magnetic resonance (MR) methods. These are: 1) resting state functional MR imaging (rfMRI) which uses correlations in the temporal fluctuations in an fMRI time series to deduce ‘functional connectivity’; 2) diffusion imaging (dMRI), which provides the input for tractography algorithms used for the reconstruction of the complex axonal fiber architecture; and 3) task based fMRI (tfMRI), which is employed to identify functional parcellation in the human brain in order to assist analyses of data obtained with the first two methods. We describe technical improvements and optimization of these methods as well as instrumental choices that impact speed of acquisition of fMRI and dMRI images at 3 Tesla, leading to whole brain coverage with 2 mm isotropic resolution in 0.7 second for fMRI, and 1.25 mm isotropic resolution dMRI data for tractography analysis with three-fold reduction in total data acquisition time. Ongoing technical developments and optimization for acquisition of similar data at 7 Tesla magnetic field are also presented, targeting higher resolution, specificity of functional imaging signals, mitigation of the inhomogeneous radio frequency (RF) fields and power deposition. Results demonstrate that overall, these approaches represent a significant advance in MR imaging of the human brain to investigate brain function and structure.
INTRODUCTION
The human connectome project (HCP) aims to generate the most complete and accurate description of the connections among gray matter locations in the human brain at the millimeter scale. Three complementary MR methods are employed to achieve this goal (along with MEG, and a battery of behavioral testing). The first, resting state functional magnetic resonance imaging (rfMRI), uses correlations in the spontaneous temporal fluctuations in an fMRI time series to deduce ‘functional connectivity’; it serves as an indirect but nonetheless invaluable indicator of gray-matter regions that interact strongly and, in many cases, are connected anatomically (e.g. (Beckmann et al., 2005; Biswal et al., 1995; Fox and Raichle, 2007; Smith et al., 2011; Vincent et al., 2007)). The second method, diffusion imaging (dMRI), provides the input for tractography algorithms used for the reconstruction of the complex axonal fiber architecture so as to infer ‘structural connectivity’ between gray matter regions (e.g. reviews (Jbabdi and Johansen-Berg, 2011; Mori and Zhang, 2006)). Finally, the third method, task based fMRI (tfMRI), provides functional maps depicting regional responses to specific cognitive processes and stimuli, identifying functional parcellations in the human brain directly and thus assisting analyses of data obtained with the first two methods.
A growing number of studies have revealed important insights through systematic studies of whole-brain connectivity using the aforementioned MR methods (e.g. (Hagmann et al., 2008; Mars et al., 2011; Nelson et al., 2010; Power et al., 2011; van den Heuvel et al., 2009; Yeo et al., 2011)). Despite their promise, however, each of these MR methods faces serious technical limitations. These include a high incidence of false positives and false negatives (Iturria-Medina et al., 2008; Jbabdi and Johansen-Berg, 2011) that arise from the indirect nature of functional imaging signals (Uludag et al., 2009), dependence on neurovascular coupling (Iadecola, 2004), the presence of confounding long-range correlations of vascular origin (Mitra et al., 1997), and the complexity of water diffusion in the microenvironment of the brain (e.g. (Panagiotaki et al., 2012; Van Essen et al., 2013a)). Given these neurobiological and neurophysiological challenges, undertaking significant new methodological developments to overcome or ameliorate these limitations was considered imperative for the success of the HCP.
In dMRI, a critically important goal is to estimate the orientation of white matter fiber bundles as accurately as possible, especially in regions where multiple fiber bundles intersect one another at various angles or where a fiber bundle bends or fans out and splits into multiple trajectories. Improving signal-to-noise ratio (SNR) by minimizing T2 decay during the diffusion encoding period, and accelerating the data acquisition rate without significantly impacting SNR (i.e. increasing SNR per unit time of data acquisition) are key to obtaining more informative dMRI data for tractography analysis. Higher SNR can be exploited to reduce voxel size and/or increase diffusion-weighted contrast. Improvements in SNR per unit time enable higher spatial resolution without commensurately longer data acquisition times, and/or more extensive sampling of the diffusion encoding space (i.e. q-space, defined by the magnitude and orientations of the diffusion-weighting gradients). A shorter acquisition time for a given protocol also diminishes the risk of data corruption due to head motion, and allows multiple repetitions of a protocol within a given scan time either for data averaging or for increased success in obtaining usable data.
Accelerating volume coverage is also critical for improving fMRI. With a faster rate of data sampling, basal fluctuations in an fMRI time series can be captured with increased statistical significance and/or spatial resolution can be improved without compromising volume coverage or total data acquisition time. In fMRI, however, spatial resolution is limited not only by achievable voxel size, but also by the spatial relationships associated with neurovascular coupling, and coupling between functional mapping signals and underlying vasculature (e.g. (Engel et al., 1997; Shmuel et al., 2007; Ugurbil et al., 2003b; Uludag et al., 2009)). In particular, functional signals present in gradient echo (GRE) BOLD fMRI time-series, the most commonly used approach for functional brain imaging, are largest in draining vessels (Kim et al., 1994; Menon et al., 1993; Ugurbil et al., 2003a; Ugurbil et al., 2003b; Uludag et al., 2009). This is particularly true at magnetic fields less than 7 Tesla (Duong et al., 2003). This is a serious problem for analyzing buried cortex, because larger vessels drain from both banks of a given sulcus and thus reflect neural activity of regions that reside in close proximity in space but can be widely different in function. This confound can be reduced by restricting analysis to gray-matter voxels (e.g.,(Formisano et al., 2004; Kolster et al., 2010; Shmuel et al., 2007)), but it is not eliminated because the BOLD effect extends outside vascular boundaries by about the blood vessel diameter (Ogawa et al., 1993) 1. If the resolution of the images is high enough, restricting the analysis to deeper layers of the cortex improves the accuracy (Polimeni et al., 2010) albeit at the expense of functional contrast-to-noise ratio (fCNR) and the possibility of laminar analysis. Thus, acquiring functional mapping signals with the highest possible fidelity to the underlying neuronal processes is also an important goal for the fMRI component of the HCP.
In this article, we review the improvements undertaken at the level of data acquisition to achieve these goals within the Washington University-University of Minnesota (WU-Minn) Consortium of the HCP (http://humanconnectome.org). With respect to fMRI, the development of the acquisition methods described in this article focus primarily on rfMRI, though the methods were ultimately also validated and adapted for tfMRI. These improvements were complemented by developments and optimizations in data analysis techniques, which are discussed in other contributions to this special issue ((Glasser et al., 2013; Smith et al., 2013; Sotiropoulos et al., 2013a)). Separate reviews on the justification and the accomplishments of the task-fMRI (Barch et al., 2013) resting state-fMRI (Smith et al., 2013), and dMRI (Sotiropoulos et al., 2013a), as well as an overview of the overall HCP project (Van Essen et al., 2013b) are also provided in this issue and complement the information provided in this article.
INSTRUMENTAL CONSIDERATIONS
Choice of Magnetic Field
In principle, there were two possible field strengths to consider for the HCP. Clearly, a high-end clinical instrument operating at 3 Tesla (3T) was a major contender given the fact that such instruments are endowed with several decades of cumulative engineering refinements. The second option was the ultrahigh field2 of 7 Tesla (7T), a magnetic field strength that is rapidly emerging as the high-end instrument for neuroimaging. In view of the ultrahigh field expertise of the University of Minnesota investigators(Ugurbil, 2011, 2012) in the WU-Minn consortium, this field strength was a viable option even though 7T work on rfMRI and dMRI was sparse at the time the HCP proposals were solicited by the NIH.
A key objective for the WU-Minn consortium was to scan a sufficient number of subjects to quantify the relative importance of genetic and environmental influences on individual variability in brain connectivity. A cohort size of 1,200 individuals involving twins and their non-twin siblings was decided upon ((Van Essen et al., 2013b), in this issue). This dictated the type of instrument we considered for these studies. In view of the five-year time-line for the HCP, it was not practical to aim for comprehensive studies on 1200 subjects at 7T, which remains to this day more complex and less routine in operation. In addition, the relatively limited amount of published 7T rfMRI and dMRI data at the time of the submission, and the widespread opinion that ultrahigh magnetic fields are disadvantageous for dMRI (discussed below), also led us to consider 7T as a riskier option for the HCP. Instead, we chose a path that included both 3 and 7T studies. We proposed to scan 1200 subjects at 3T using a specially configured 3T system from Siemens that would be initially installed at CMRR for the development and optimization phase, and subsequently moved to WashU for the 1200 subject data acquisition phase (this scanner is now at WashU and is in a high-throughput mode of collecting data for the HCP). We also proposed to scan 200 subjects from the 1200-subject pool at 7T, using one of the two Siemens 7T instruments located in CMRR, subsequent to an additional development and optimization phase dedicated to 7T methods (see below).
New Gradient Hardware at 3 Tesla
High maximal gradient strength (Gmax) was identified as being critical for improved dMRI. The delay between signal excitation and image acquisition (echo time or TE), during which diffusion encoding is implemented, can be shortened with higher Gmax, reducing the signal loss that occurs during TE due to T2 processes. For example, for the “monopolar” diffusion weighting that employs a single 180° refocusing pul se flanked by gradient pulses (Figure 1), the diffusion weighting represented by the parameter b (also known as b-value (Mattiello et al., 1997; Stejskal and Tanner, 1965)) is given by the expression , for rectangular gradient pulses (shown in Figure 1), and for trapezoidal gradient pulses,
FIGURE 1.
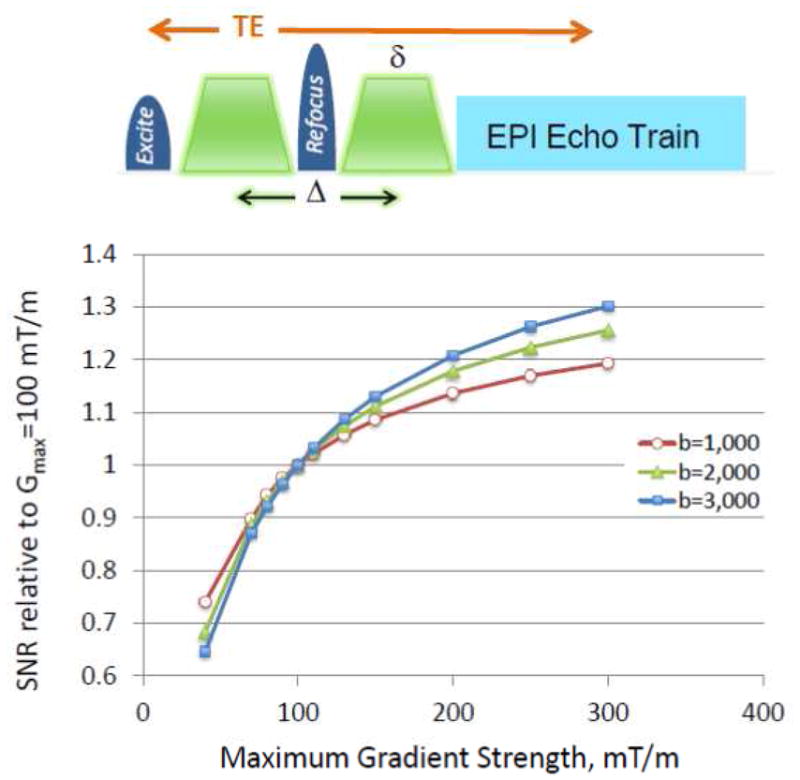
SNR achievable at 3 Tesla in a monopolar diffusion weighted spin-echo sequence at different maximal gradient strengths (Gmax), normalized to Gmax=100 mT/m. The monopolar dMRI sequence is schematically depicted in Figure 1. Ramp times shown in the pulse sequence diagram were ignored for the calculations (i.e. they were assumed to be infinitely fast). The minimum δ (see diagram) was calculated for a given b, G and d (where d is the separation between the two gradient pulses and Δ = δ+d, ignoring the ramp times) by solving 0 = b − (2π · 42.58 ×10− ·G· δ ) · 10− · (2δ /3+ d) where b is s/mm2, δ and d in ms and G in mT/m, with d=6 ms. The minimum TE was calculated as 2δ+TE0, where TE0 is the minimum TE achievable with δ = 0; TE0 was taken to be 15 ms based on our existing sequence with partial Fourier acquisition). SNR is calculated using the biexponential diffusion approximation using the equation: SNR ∝ (0.75e−bDF + 0.25e−bDS)e− (δ + TE0)/T2 where DF_ and DS are fast and slow diffusion constants, respectively, (assumed to be 0.8×10⁻³ and 1×10⁻⁴ mm2/s) with corresponding fractional pool sizes of 0.75 and 0.25 (taken from (Ronen et al., 2005)),. White matter 3T T2 was assumed to be 70 ms (Stanisz et al., 2005).
where γ is the gyromagnetic ratio and Gd is the amplitude for the gradient pulse3. Gd is ultimately limited by the maximum gradient amplitude achievable by the gradient set, i.e. by Gmax. Perfectly rectangular pulses are not feasible in human imaging systems, since there are instrumental and physiologic limitations on the rate at which the gradients can be ramped, also known as “slew rates”; however, the rectangular pulses provide a simple formulation and easier insight into the interplay between diffusion encoding parameters. In practice, all gradient pulses are trapezoidal, with ξ defining the ramp time (transition time between zero gradient and Gd ). The idea is to increase Gd so as to decrease Δ and δ for a given b -value in order to shorten TE. Note, however, that with increased Gd, ξ gets longer, negatively impacting the minimum achievable TE.
High resolution (0.7mm isotropic) structural images (e.g. T1- and T2-weighted) which are part of the data collection protocol in the WU-Minn consortium ((Glasser et al., 2013), in this issue) also benefit from the higher Gmax for reduced echo spacing in both turbo FLASH and turbo spin echo sequences, hence reduced blurring in the phase encoding direction.
We considered two options for attaining higher Gmax in a standard clinical 3T system. The first was to adapt the high performance SC72 gradient set used on the Siemens 7T systems, capable of 70 mT/m Gmax and a 200 mT/m/ms slew rate, into a 3T scanner. This gradient has ~82 cm outer diameter (designed for ~82 cm diameter bore 7T and 9.4T magnets) and 64 cm internal diameter. Further, it had already been shown to have excellent eddy current performance at 7T and promised even better results in a 3T magnet due to the greater distance between gradient coil and magnet structures surrounding it in the larger bore (90 cm diameter) 3T magnet. Although this gradient was operating at Gmax of 70 mT/m in the 7T, the prospect of driving it with stronger (935 Amps) gradient amplifiers from the new Siemens 1.5T system was considered. By combining both the gradient coil and amplifier upgrades, the scanner would be able to achieve 100 mT/m Gmax.
The second option was a newly designed gradient coil set, yet to be built at the time the HCP proposals were being prepared; this prototype coil aimed at generating 300 mT/m maximum amplitude with a 200 mT/m/ms slew rate. While this was a tantalizing prospect, the WU-Minn consortium deliberately chose a more cautious approach: The HCP was not exclusively an instrument and technology development grant; it had an ambitious target, namely, a large (1200) subject database, which was to be a “deliverable” required by the completion of the project. Consequently, the risk of not meeting the HCP requirements with a first-of-its-kind 300 mT/m gradient was not insignificant. Additionally, our decision was influenced by simulations of the potential SNR gains at 300 mT/m, relative to 100 mT/m; these simulations indicated that there were substantial gains going from the standard 40 mT/m to 100 or 300 mT/m Gmax, but that the gains tended to plateau, depending on the b-value employed, for Gmax values much above 100 mT/m (Figure 1).
While the available hardware indeed dictates the ultimate achievable reduction in TE, and consequently SNR, the method used for diffusion encoding and the subsequent b-values employed also has a major impact. For diffusion spectrum imaging (DSI) (Wedeen et al., 2005), it is desirable to span q-space4 going to relatively high b-values. For DSI, even very low SNR images obtained at very high b values such as b=10,000 s/mm2 may contribute to the final result because of the Fourier Transform employed in q-space. The WU-Minn consortium, however, decided instead to use the high-angular resolution diffusion imaging (HARDI) approach (Tuch et al., 2002) but modified to incorporate multiple shells of b values ((Sotiropoulos et al., 2013a) in this issue, and (Caruyer et al., 2011)). After extensive piloting a wide range of b-values, a dMRI protocol that used three shells of b = 1000, 2000, and 3000 s/mm2, and a large number of directions (270 q-points distributed over the 3 b-shells, plus 18 b=0) was chosen in our consortium ((Sotiropoulos et al., 2013a) in this issue). The SNR that would be attainable for these three b values at different Gmax, relative to a Gmax of 100 mT/m, are illustrated in Figure 1 for rectangular, monopolar diffusion weighting; SNR increases ~30% by going to 300 mT/m at the highest b value employed in our protocol. The details of the SNR modeling employed are given in the figure caption. In these simulations, the gradient ramps are assumed to be infinitely fast. In reality, however, the slew rate is limited by peripheral nerve stimulation. Further, with the high gradient values attainable with these gradients, cardiac stimulation limits are also reached, thereby limiting the slew rates even more. While these physiologic limits are gradient-specific and, as such, somewhat different for the two different gradient sets, the useable slew rates are roughly the same. Thus, it takes ~3 times longer to reach 300 mT/m, reducing the potential SNR gains for a given b value.
After carefully considering the anticipated SNR benefits on q-space sampling trajectories (e.g. Figure 1) vs. potential risks of the prototype 300 mT/m gradient design at the time, including uncertainties in eddy currents and the available linear volume, we chose the 100 mT/m option based on the SC72 gradient set from Siemens. The stronger 300 mT/m gradient set is currently operational at the Massachusetts General Hospital (MGH) as part of the MGH-UCLA (University of California Los Angeles) HCP consortium that was specifically funded to develop this instrument but without the commitment to deliver such a large data base as the WU-Minn consortium. In both cases, the gradient sets were designed to fit into a recently introduced Siemens 3T platform, the Skyra. This new scanner has completely new electronics that provides intrinsically better SNR independent of the gradient hardware, higher number of receive-channels compared to older 3T systems, and has additional sequence/reconstruction/software features that are relevant and used in HCP acquisitions (e.g. gradient power amplifier balancing for gradient duty cycle pre-calculation in dMRI, improved robustness of EPI phase correction, and 16 bit DICOM for high dynamic range output).
There is room for additional gradient hardware improvements for neuroimaging. The significantly higher Gmax values of the current MGH-UCLA and WU-Minn 3T gradient sets mostly affect diffusion contrast preparation. When the spatial encoding employed in generating images is based on single-shot echo planar imaging (EPI) (Mansfield, 1984), as it is for fMRI and dMRI in the two HCP projects, the minimum echo spacing in EPI can be limited by Gmax of the readout gradient in the resolution range of approximately 2 to 3 mm. However, when higher resolution imaging is desired, the echo-train lengths become elongated and echo spacing becomes limited by the slew rate of the readout gradient. Then, faster slew rates become crucial for EPI image quality. Faster slew rates would also contribute to the reduction in TE and consequently to mitigation of SNR loss during the diffusion contrast reparation in dMRI. Thus, ideally, high Gmax as well as faster slew rates are needed for optimal neuroimaging. Tight fitting “head-gradient” sets provide such performance. For example, a head gradient set available for the 7T system from Siemens can operate at 80 mT/m with a 400 mT/m/ms slew rate, and yields better EPI images along with more efficient diffusion encoding. However, building optimally performing RF coils and accommodating subject comfort and tolerance is challenging within the small inner diameter (36 cm after sound insulation) of these head-only gradients. It is theoretically possible to design a “brain-specific” gradient set that improves on key objectives discussed here, i.e. high Gmax and high slew rates, with significantly more space than the currently available in tight fitting head-gradient sets; however, to date, this has not been implemented.
PUSHING DATA ACQUISITION SPEED
Early Developments
Improving MRI data acquisition speed, while critical for the HCP, is relevant to human neuroimaging in general and was already recognized in prior work, for example, focused on very high-resolution fMRI applications at ultrahigh magnetic fields (Moeller et al., 2008; Moeller et al., 2010) or on extensively sampling q-space for DSI (Reese et al., 2009). However, the HCP provided the opportunity, as well as the obligation, for systematic improvements and evaluation of these techniques, with respect to pulse sequence and image reconstruction performance, and the translation to 3T systems.
Almost all fMRI and dMRI studies currently employ a multi-slice (2D) approach based on “single-shot” slice selective gradient recalled echo (GRE) EPI, due to its widespread availability and the ultrafast spatial encoding speed. Over the years, EPI acquisition speed has significantly improved with the advent of parallel imaging (Griswold et al., 2002; Pruessmann et al., 1999; Sodickson and Manning, 1997) and partial Fourier sampling (Feinberg et al., 1986), resulting in reductions in the amount of k-space data collected and, hence, the total echo train length that follows the RF pulse(s). These improvements have led to important gains in EPI image quality; however, they have not commensurately impacted the speed of whole brain coverage, which, in conventional multi-slice imaging, is dictated by the product of the number of slices used for volume coverage and the single slice acquisition time. The latter can be significantly longer than the duration of the EPI “read-out” echo train used for encoding spatial information because of the required contrast preparation period that must precede the EPI echo train, as in fMRI or dMRI.
The need to increase the efficiency of volume coverage with EPI for fMRI and dMRI was recognized by many investigators and several distinct strategies were introduced as a remedy (e.g. Three dimensional (3D) echo volume imaging (EVI) (Mansfield et al., 1994), Segmented Multi-shot 3D EPI (Poser et al., 2010; Wielopolski et al., 1995), Echo shifting approaches such as PRESTO (Golay et al., 2000; Liu et al., 1993), the simultaneous image refocused (SIR) scheme (Feinberg et al., 2002; Reese et al., 2009)). Because of various shortcomings, however, these techniques have not been able to replace the standard EPI acquisition in fMRI and dMRI.
The aforementioned impediments to efficient whole brain coverage become a major challenge when aspiring for millimeter or sub-millimeter resolution functional imaging in the human brain. Such resolutions are in principle practical at ultrahigh fields, such as 7T, because of field dependent elevations in intrinsic image SNR (Vaughan et al., 2001), supra-linear increases in the susceptibility based BOLD contrast (e.g. (Ogawa et al., 1993; Uludag et al., 2009)), and improvements in the spatial accuracy of functional mapping signals (Ugurbil et al., 2003a; Ugurbil et al., 2003b). These gains have been used to generate 7T functional maps of cortical columns and/or layers (e.g. (Chaimow et al., 2011; Koopmans et al., 2011; Olman et al., 2012; Polimeni et al., 2010; Yacoub et al., 2008; Yacoub et al., 2007; Zimmermann et al., 2011)) as well as other fine scale organizations, such as digits of the hand (Sanchez-Panchuelo et al., 2010; Stringer et al., 2011). Extending this type of imaging to study ensembles of such elementary computational components over the entire brain is ultimately essential for understanding brain function, and potentially feasible with ultrahigh fields. For example, multi-slice whole brain (128 slices) GRE EPI with a 22 ms TE, 0.8 mm isotropic resolution, and 5/8 partial Fourier, a reduction factor of four along the phase encode dimension, yields excellent images at 7T (Figure 2) but requires ~ 9 s to acquire a single volume with whole body gradients, restricting the volume repetition time (TR) to ~ 9 s. While using the shorter echo spacing that can be achieved with the fast slew rates of a head-insert gradient set decreases the TR, it still remains relatively long at ~6 to 7 s.
FIGURE 2.

Slices (7 Tesla, 0.8 mm isotropic resolution) from a single-shot EPI images (MB=1). 30 slices out of 128 are shown. Data presented from a single scan (without averaging) covering the whole brain using consecutively acquired single slices. Data obtained using Siemens SC72 “whole body” gradients. Acquisition parameters were: matrix size = 262×262, 128 slices, FOV = 210×210 mm2, TE/TR = 22ms/9350ms, in-plane phase encode acceleration (iPAT)=4, 5/8 partial Fourier, 96 ACS lines. Image supplied by An Vu from data obtained in CMRR.
Motivated by the prospect of whole brain, high resolution functional mapping at 7T, Moeller et al 43,44 used GRE EPI at 7T with concurrent accelerations along both the slice and in-plane phase-encode directions, and demonstrated whole-brain fMRI time series acquired with significant reductions in TR. Multiple slices were simultaneously excited using multiband RF pulses; the signals generated by these multiple slices were acquired simultaneously in a single EPI echo train, with k-space undersampling in the phase encode direction. These simultaneously acquired slices were unaliased using parallel imaging principles and the coil sensitivity profiles of the multichannel receive array employed for data collection. Excellent functional maps at 7T with 1.5 mm isotropic resolution acquiring 88 slices in 1.25 s, or 1×1×2 mm3 resolution with 90 slices in 1.5 s were achieved (Figure 3) (Moeller et al., 2008; Moeller et al., 2010).
FIGURE 3.
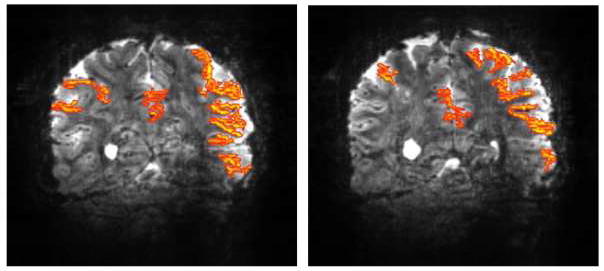
Functional maps at 7 Tesla obtained with slice and phase-encode acceleration. Two representative coronal slices showing functional activation maps obtained with 16 fold two dimensional acceleration (4 fold slice (i.e. MB=4) and 4 fold in-plane phase encode accelerations) for a complex visuo-motor dissociation task; 90 slices were acquired in 1.5 sec with 1×1 mm2 in plane resolution 2 mm slice thickness. A total of 252 images were obtained with the subjects performing the task during three blocks of on-off periods. Maximal aliasing in these data was 16 fold. Adapted from (Moeller et al., 2008; Moeller et al., 2010).
The use of multiband excitation pulses to simultaneously excite and collect multiple slices (referred to as Multiband (MB) or Simultaneous Multi Slice (SMS) technique interchangeably) dates back to 2001, when it was demonstrated using gradient recalled echoes, collecting a single k-space line at a time (i.e. FLASH), imaging a leg with a spine coil (Larkman et al., 2001). This approach was further advanced with the introduction of the CAIPIRINHA (Controlled Aliasing In Parallel Imaging Results In Higher Acceleration) (Breuer et al., 2005; Breuer et al., 2006) concept where unaliasing of slices were improved significantly by manipulating the phase of the RF excitation pulses progressively for each k-space line, so as to effectively shift the simultaneously acquired slices relative to each other in the phase encoding direction (see Figure 6). These earlier initiatives did not catch the attention of the neuroimaging community, including HCP consortia members, possibly because they were not implemented with rapid acquisition strategies like EPI. A Multiband EPI implementation using linear gradient “blips” to achieve controlled aliasing as in CAIPIRINHA was described in an abstract in 2006 (Nunes et al., 2006). However, the approach led to undesirable voxel tilting and the abstract was never followed by a paper or demonstrated utility in a biological or biomedical application. Moeller at al 43,44 was the first to demonstrate rapid, high-resolution, whole brain coverage with Multiband EPI in an application that had wide spread use, namely fMRI, where such rapid volume coverage was critical, thus catalyzing a major interest in the Multiband approach. Subsequently, a modified “blip” strategy in Multiband EPI, termed “blipped CAIPI”, that balances the blips so as to minimize the voxel tilting of the earlier blipping implementation (Nunes et al., 2006) was introduced by Setsompop et al (Setsompop et al., 2010; Setsompop et al., 2012), providing major improvements in g-factor noise and achievable slice accelerations, adding to the attractiveness of the approach in EPI based techniques such as fMRI and dMRI.
FIGURE 6.
Controlled aliasing to displace simultaneously acquired images relative to each other to improve subsequent unaliasing. Multiband EPI (MB2) images acquired on the 3T WU-Minn consortium HCP scanner, without (top row) and with (bottom row) controlled aliasing (blipped CAIPI) using a PESHIFT of FOV/2. Slices from three different regions of the brain are shown. Images supplied by Junqian Xu from data acquired in CMRR.
The Moeller et al 34,35 work relied on EPI without controlled aliasing, and, as previously mentioned, employed two-dimensional acceleration along both the slice and phase encode directions. The latter is virtually indispensible for improved EPI imaging at 7T; however, its use naturally reduces the achievable maximal slice acceleration. Both the slice and in-plane accelerations rely on parallel imaging through the spatial encoding properties of the receive array coil; consequently, they are not independent of one another, and the simultaneous use of both reduces the maximum accelerations achievable with either alone. Nevertheless, 4-fold acceleration along both the slice and phase encode directions, was feasible without controlled aliasing. On-going experiments, suggest that improvements beyond that are difficult to attain even with control aliasing techniques and even with current 32-channel array coils (maximum usable on 7T at the present) when such high phase encoding acceleration is employed. The high two dimensional acceleration demonstrated by Moeller et al 34,35 was presumably feasible because of the expected improvements in parallel imaging at higher magnetic fields (Ohliger et al., 2003; Wiesinger et al., 2004) and the coronal slice orientation chosen to take advantage of the spatial encoding power of the azimuthally distributed elements of the 16 channel coil.
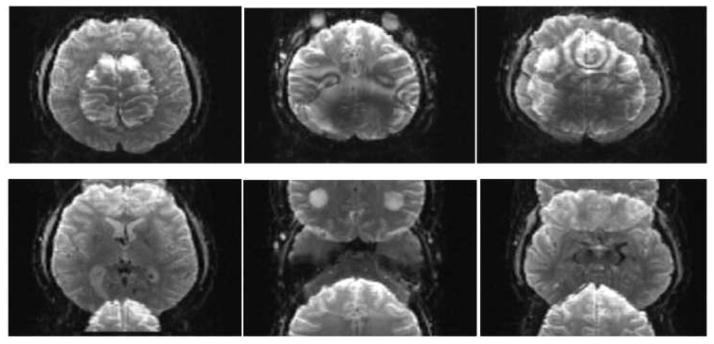
Initial efforts in the WU-Minn consortium also tried to accelerate beyond what was feasible with Multiband EPI by combining it with the SIR approach (Feinberg et al., 2002), a technique we referred to as Multiplexed-EPI (M-EPI) (Feinberg et al., 2010). A similar combination was also described in an abstract the same year (Setsompop et al., 2010). Multiplexed EPI essentially takes the SIR sequence, where s RF pulses are applied sequentially in time leading to temporally resolved echoes from the s different slices, and makes each RF pulse a multiband pulse with m bands (where m and s are positive integers); the result is simultaneous acquisition of m times s (i.e. m×s) slices in a single echo train that contains both simultaneously acquired as well as temporally shifted echoes. Thus, many more slices can be sampled during a single readout train compared to either of the techniques alone. Examples of such Multiplexed-EPI images are shown in Figure 4. Using this method to accelerate whole brain coverage, we demonstrated (Feinberg et al., 2010) that the statistical significance of the Resting State Networks (RSNs) detected by high dimensional ICA analysis from rfMRI time series significantly improved (Figure 5), and the normally long acquisition time of dMRI was reduced 2–4 fold. However, because of the longer echo trains inherent in SIR, the combined technique is not universally advantageous, and the realizable gains depend on several factors, including spatial resolution, MB acceleration capabilities, desired temporal resolution and the need for in-plane accelerations (Chen et al., 2012; Chen et al., 2013a; Chen et al., 2013b).
FIGURE 4.

Combining Multiband and SIR accelerations: Multiplex EPI images obtained at 3 Tesla. 4 adjacent slices are shown out of the total 60 slices obtained with 2 mm isotropic resolution covering the entire brain. Each row of images was obtained with different MB and SIR accelerations, producing simultaneous acquisition of 1, 4, 6 and 12 slices in a single EPI echo train. Adapted from (Feinberg et al., 2010).
FIGURE 5.

Improvements in detection of RSNs (resting state networks) with shorter TRs. A single RSN is displayed at the same statistical threshold obtained at 3T from three 10 min acquisition periods obtained with different TRs using Multiplexed EPI. Data were gathered in a single session from one subject, using 3 mm isotropic resolution. TR=2.5 s (no acceleration), TR= 0.8 s (4 fold slice acceleration), and TR=0.4 s (9 fold slice acceleration). The color overlays are z-statistic images, thresholded at Z = 4 in all cases. Adapted from (Feinberg et al., 2010).
Accelerated Imaging at 3 Tesla in WU-Minn Consortium
Acquisition Choices
The objectives of the WU-Minn HCP consortium entailed not only better pulse sequences but also implementation on the HCP scanners for efficient, stable and robust performance. Therefore, significant efforts were invested in evaluating the performance of the sequences and the associated image reconstruction algorithms. The evaluation took place in two stages. The first stage involved evaluation of image quality, temporal stability, noise increase due to parallel imaging, and residual aliasing among the simultaneously excited slices. The second stage examined the performance of the sequences, and the different acquisition parameters for detection of resting state networks and task activation for fMRI, robustness to subject motion (described in greater detail by (Smith et al., 2013) in this issue), and various metrics for diffusion imaging (also described in this issue in greater detail (Sotiropoulos et al., 2013a)). Both stages were critical and ultimately led to the final protocol selection.
Early evaluations of the slice accelerated imaging methods in our consortium were performed with Multiplexed EPI, demonstrating the advantages of accelerated volume coverage in detecting RSNs and reducing the normally long scanning time in dMRI (Feinberg et al., 2010). However, the use of the SIR technique in Multiplexed EPI was problematic for our aspirations towards significantly higher resolutions than what was reported in this early work. As previously mentioned, SIR leads to longer readout times with undesirable consequences, especially when higher spatial resolution is targeted; this can be counteracted with the use of in-plane accelerations along the phase encode direction but at the expense of achievable slice acceleration factor (and hence overall TR reduction). With the development of control aliasing principles (Breuer et al., 2005) in Multiband EPI (Setsompop et al., 2012), it became possible to attain high slice acceleration factors with Multiband EPI alone without multiplexing with SIR. Consequently, Multiband EPI with control aliasing (“blipped CAIPI”) with a further modification to attain full alignment at the center k-space point (Xu et al., 2012b) and without the use of in-plane phase encode acceleration was ultimately adapted as the sequence employed for the 3T HCP data acquisition in the WU-Minn consortium. We describe the shift induced in the phase encode direction by controlled aliasing as a fraction of the field-of-view (FOV) and refer to it using the label PESHIFT; thus a PESHIFT of FOV/4 has a maximal shift of ¼ of the FOV in the phase encode direction between the simultaneously excited slices. The effect of the PESHIFT achieved is illustrated in Figure 6 with MB=2 images of the head acquired with and without PESHIFT = FOV/2.
An example of the type of Multiband data obtained in the initial evaluation phase on the 3T HCP scanner is illustrated in Figure 7 for different MB factors, and, in this case, acquired using 2 mm isotropic resolution; for comparison, images from the standard EPI sequence (corresponding to MB=1) available on the scanner are also provided. Although the TR was kept constant at the value attainable for the MB1, the minimum achievable volume TR to cover the whole brain is also indicated for each MB factor. The data were acquired with the WU-Minn Skyra Connectome scanner using a 32 channel standard Skyra coil. Careful scrutiny of the images indicates that MB=12 data still show much detailed structure although they clearly display greater artifact level. Figure 8 illustrates eighteen slices from a whole head acquisition comparing standard EPI (MB1) images and MB6 Multiband acquisition at 3T at the same TR; excellent EPI image quality is evident in MB=6 as well as the standard MB=1 case.
FIGURE 7.
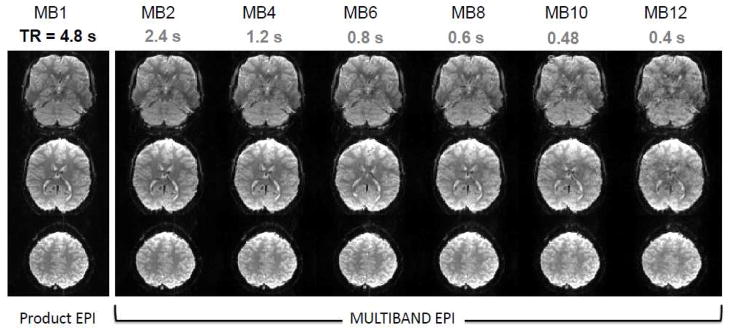
Slice accelerated Multiband images at 3T at different acceleration factors. Three slices from a 2 mm isotropic resolution, 64 slice whole brain data set obtained with slice acceleration up to MB factor of 12. For comparison, images were acquired with the same TR (4.8 s) based on the minimum TR attainable with standard EPI (i.e. MB=1). The example axial slices shown were not from the same MB slice group. Achievable TR at a given MB factor is listed below the MB factors given to show the acceleration potential. Adapted from (Xu et al., 2012a, b).
FIGURE 8.

Comparing 6-fold slice accelerated Multiband images at 3T with unaccelerated standard acquisition. Selected slices from a 1.6 mm isotropic, 80 slice whole brain data set obtained with Multiband EPI with PESHIFT=FOV/3, MB factor 6 and standard EPI (MB=1). TE=30 ms; 6/8 Partial Fourier along phase encode direction. TR =6.7 s for both, set by the minimum TR attainable with MB=1. Minimum TR that would be possible with MB=6 acquisition with these parameters would be 1.1 s. Data was obtained with a 32 channel coil on the 3T WU-Minn HCP scanner. Adapted from (Xu et al., 2012a, b).
A quantitative analysis of these data is possible using g-factors that reflect for noise amplification due to the use of parallel imaging (Figure 9), using the formulation developed for in-plane parallel imaging along the phase encode dimension (Pruessmann et al., 1999). Histograms of the g-factor over the entire brain are shown in Figure 9, demonstrating increased noise with increasing MB factor. Notably, g-factors below unity are also observed, indicating certain noise cancellation in parallel imaging based slice unaliasing. Such a decrease below unity in GRAPPA reconstructions was previously noted (Polimeni et al., 2008; Setsompop et al., 2012). However, g-factors themselves do not inform about residual aliasing among the simultaneously acquired slices. To address this, we introduced a metric named the L-factor (leakage factor) (Moeller et al., 2012) that quantifies residual aliasing.
FIGURE 9.
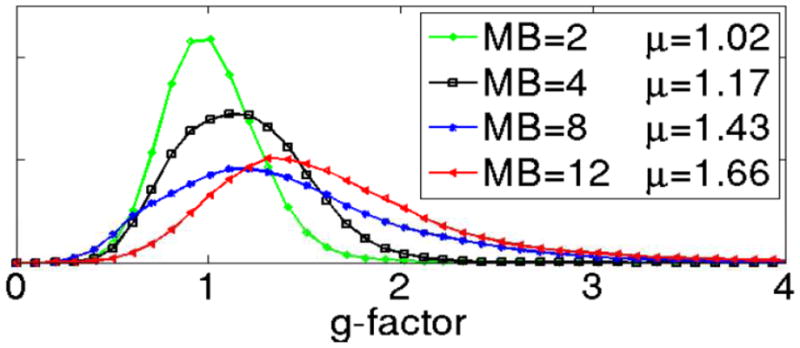
Noise amplifications due to unaliasing of slice accelerated Multiband EPI data. Noise amplification is calculated as a “g-factor” and presented as a histogram. MB=2 (green), MB =4 (black), MB=8 (blue), and MB=12 (red). Data obtained with a 32 channel coil on the 3T WU-Minn HCP scanner. Adapted from (Xu et al., 2012a, b).
L-factor maps of residual aliasing are illustrated in Figure 10 for Multiband EPI imaging with MB= 3, 4, 8 and 12. This approach is based on assessing the “leakage” of a periodic modulation imposed on one slice into other simultaneously acquired slices by the image reconstruction algorithm. This procedure follows the principle employed in our previous fMRI study (Moeller et al., 2010), where leakage of signal oscillation, in that case induced by visual stimulation, was examined in slices where activity should not be present. Here, however, the oscillation is imposed post-acquisition as opposed to using a task or a stimulus during data acquisition. The fractional signal cross-contamination per slice, averaged over all slices, is calculated as the L-factor. Such maps, illustrated in Figure 10, demonstrate that there is no perceptible “leakage” from the center slice to the two adjacent slices for MB=3 and the calculated L-factor was 0.03 with or without PESHIFT. For higher MB factors the PESHIFT becomes more important (Moeller et al., 2012). For MB = 4, for example, a PESHIFT of FOV/4 reduced the L-factor from 0.09 to 0.02. With MB = 8 and 12 (Fig. 10) acquired with PESHIFT = FOV/4, L-factors were 0.03 and 0.05, respectively.
FIGURE 10.
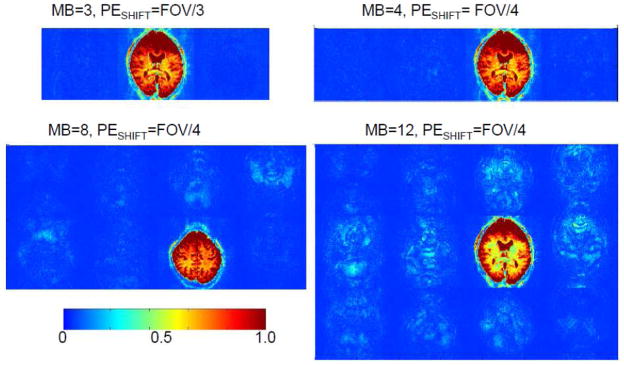
Quantifying residual aliasing among simultaneously acquired slices. Signal leakage (L-factor) maps showing residual aliasing among simultaneously acquired slices at 3T for MB3, MB4, MB8 and MB12 with with PESHIFT.The oscillation imposed on slice (appears in red/yellow color) “leaks” into other simultaneously acquired slices due to resdiual aliasing. Adapted from (Moeller et al., 2012).
Given the image quality, SNR and whole brain TRs achievable with slice accelerations, rfMRI at 1.6 and 2 mm isotropic resolutions were piloted. The evaluation of 1.6 mm isotropic data, with a voxel volume of ~½ that of 2mm isotropic resolution, did produce comparable high quality functional maps; however, this had to be weighed against the robustness of using such higher resolutions over 1200 subjects and, additionally, the tradeoff of a longer TR. The acquisition parameters are summarized in Table 1.
TABLE 1.
HCP acquisition parameters employed at 3T for fMRI and dMRI
| rfMRI and tfMRI | dMRI | |
|---|---|---|
| Multiband Factor (i.e. slice acceleration factor) | 8 | 3 |
| In-plane phase encode Acceleration | None | None |
| Spatial Resolution | 2 mm isotropic | 1.25 mm isotropic |
| TE | 33 ms | 89 ms |
| TR (Whole Volume) | 0.72 s | 5.5 s |
| Δ | Not Applicable | 43.1 ms |
| δ | Not Applicable | 10.6 ms |
| q-space sampling | Not Applicable | 3 shell HARDI b=1000, 200, 3000 s/mm2 270 non-collinear directions |
Such high slice accelerations are not feasible in dMRI because of peak power limitations and ultimately power deposition (SAR) since dMRI uses spin echo sequences with nominally 90° and 180° excitation and refocusing pulses, respecti vely. We qualify the flip angles as “nominal” because even at 3T and even with a body coil transmission, the flip angle is not uniform in the human head (see below, Figure 15). In fMRI, only an excitation pulse is employed and this pulse is adjusted to lower flip angles (i.e. the Ernst angle) to optimize SNR for the reduced TR made possible with slice acceleration, hence lowering power deposition per pulse. Although methods were developed to alleviate the peak power and SAR limitations (discussed in greater detail below) for diffusion imaging, they were not ready in time to be exhaustively tested for the 3T data collection phase of the WU-Minn HCP. In addition to RF limitations, diffusion-weighted images can be particularly sensitive to subject motion, especially when high amounts of acceleration and/or two-dimensional accelerations (i.e. MB plus in-plane accelerations) are employed (discussed below). Consequently, the dMRI acquisitions for the 1200 subject 3T database employs only MB=3. Table 1 summarizes the acquisition parameters that were decided on for 3T dMRI data, after extensive testing of b-values, gradient tables, and spatial resolution (Sotiropoulos et al., 2013a). The dMRI protocol does not use in-plane phase encoding acceleration despite the very high spatial resolution employed. When the performance of such acquisitions was evaluated in terms of fiber-crossing uncertainty, they did not perform as well as just using slice acceleration alone. This is likely because of the SNR loss that comes with in-plane phase encode acceleration as well as the elevated level of artifacts arising from increased sensitivity to physiological processes, such as heart beat and respiration (see below). Although solutions to the latter problem is currently being developed (see below), ultimately, the time constraints for launching the WU-Minn HCP data collection effort precluded additional development and evaluation for the 3T HCP protocol.
FIGURE 15.

7 Tesla transmit B1 maps in the human head. The maps were generated by a 4 port driven TEM coil similar to that described in (Vaughan et al., 2001), except in this case the internal diameter of the coil was slightly larger to accommodate a 16 channel receive-only array within it. The transmitter generates a homogenous B1 when it is not loaded with the human head.
Image reconstruction
Image reconstruction is implemented in ICE (the image reconstruction environment of the Siemens scanners). In our first Multiband work (Moeller et al., 2008; Moeller et al., 2010), a slice-unaliasing algorithm was introduced based on a conventional GRAPPA algorithm. The GRAPPA kernel was calculated from a artificially extended FOV (Blaimer et al., 2006). This approach was not compatible with slice shifted blipped controlled aliasing acquisitions because of phase discontinuities. A coil-by-coil data driven (CCDD) slice-GRAPPA technique was therefore proposed as a solution (Setsompop et al., 2012), which is employed in our HCP data production at 3T and in our distribution of image acquisition and reconstruction software to Siemens sites through the “C2P” agreement (there are currently more than ~60 such sites world wide). This algorithm is implemented on the scanner to output magnitude images online in the same fashion as standard clinical images for spectral or fMRI analysis. If partial Fourier is used in the phase encoding direction, the partial k-space is zero-filled after the slice-GRAPPA operation. The online reconstruction also incorporates corrections for EPI image intensity variation and spatial shifts due to B0 off-resonance modulations (Pfeuffer et al., 2002; Van De Moortele et al., 2002), for example, as induced by respiration, after the slice-GRAPPA operation, but before zero-filling.
One of the challenges of Multiband accelerations with a high number of receive channels, is accommodating the demanding computational requirements posed by the image reconstruction algorithms. The computers in current MR scanners were not designed for the extreme accelerations attainable today (and the resulting increase of raw data size). Accordingly, it is common for the duration of multiband image reconstruction to substantially exceed the acquisition time on current systems.
Although most fMRI and dMRI post-processing is not done online at the scanner console, making fast image reconstruction not strictly necessary, it is critical for quality control and for the operator to be able to view the images as they are acquired. Real-time fMRI applications, which would benefit significantly from slice accelerations, would of course also require acquisitions and reconstruction to be completed in real time. Also, for efficient scanner time utilization, it is not practical, for example, for an hour of scanning, to require several hours to reconstruct the images. In addition to this, if the data cannot be efficiently reconstructed, unreconstructed ‘raw’ data, which is several times larger in size, can easily fill the vendor-provided disks in less than an hour, meaning that subsequent scanning sessions would overwrite acquired but unreconstructed data, unless the raw data could be exported offline (for offline reconstruction) faster than it can be acquired, which is not always possible because of network limitations. Consequently, significant effort has been devoted to improving image reconstruction performance.
It is difficult to upgrade the image reconstruction computer hardware provided by the scanner vendor directly because of how tightly integrated these systems are. Therefore, the main approach employed for accelerating the reconstruction has been to stream, in real time, preprocessed data to a remote server via a network connection. This requires the addition of a single network card to the scanner system. The unaliasing computation is then performed entirely on the remote server, which streams the processed data back to the scanner for final processing and viewing. A comparison of total reconstruction durations using various hardware configurations is shown in Table 1. The acquisition parameters for this dataset were: MB = 8, 72 slices, 200 repetitions, acquisition matrix = 90×104, 32 receiver coils, MB-GRAPPA kernel size = 5×5, total acquisition time = 153 s.
Table 2 documents the marked difference in performance between the image reconstruction hardware across scanner generations (the older Trio uses dual Intel Xeon E5440 2.83 GHz processors whereas the newer Skyra uses dual Intel Xeon W5580 3.2 GHz); however, neither comes close to reconstructing the data in real time. Using the remote assisted reconstruction over a standard 1 Gigabit Ethernet (GbE) connection is also not helpful due to the large size of the dataset that needs to be transferred. Increasing the network speed to 10 Gigabit Ethernet (10GbE) provides an improvement, but the image reconstruction is still limited by the speed of the CPUs on the remote reconstruction server (dual Intel Xeon X5680 3.33 GHz). The most dramatic improvement comes from using graphic processing units (GPUs). In the example presented, using two GPU cards (nVidia Tesla C2070) on the remote server connected to the scanner via a 10GbE link allows for the reconstruction to complete virtually in real time. Compared to the reconstruction on the scanner alone, this represents a reduction in processing time of 43%. This makes a strong argument for the inclusion of GPUs as a standard feature of future scanners, if MB acceleration is to be offered as a product.
Table 2.
Comparison of total reconstruction duration for a MB=8, 200-frame dataset (acquisition time = 153 s) using different hardware configurations.
| System | Remote Assistance | Recon. Duration (s) |
|---|---|---|
| 3T Siemens Trio | None | 368 |
| 3T Siemens Skyra | None | 246 |
| 3T Siemens Skyra | 8 CPUs, GbE link | 336 |
| 3T Siemens Skyra | 8 CPUs, 10GbE link | 223 |
| 3T Siemens Skyra | 2 GPUs, 10GbE link | 139 |
Image reconstruction in highly parallel acquisitions using large number of receive coil elements also raise issues as to how best to combine the signals from the different elements. In the case of multichannel receiver coils, signal properties can change dramatically, depending on the image reconstruction method employed to combine information from the different channels. When coil profiles are unknown, a root-sum-of- squares (RSoS) combination is SNR optimal (Larsson et al., 2003; Roemer et al., 1990). However, RSoS results in a magnitude signal with a noise floor, the minimum measurable in the absence of any true signal, that is elevated. This is particularly relevant for dMRI, where diffusion weighted attenuation of the detectable signals reduces them to levels not much higher than the noise floor. In a joint effort between the two HCP consortia (Sotiropoulos et al., 2013b), an alternative image reconstruction method that is based on sensitivity encoding (SENSE) was developed that preserves the Rician nature of the single-channel, magnitude MR signal and avoids the excessive over fitting and precision of orientation estimation of RSoS reconstructed data). This approach was adapted for image reconstruction for dMRI in the HCP (see also (Sotiropoulos et al., 2013a))
ONGOING and FUTURE DEVELOPMENTS
The 3T protocols in the WU-Minn HCP Consortium are now “frozen” and produce data that are significantly higher quality than what has been possible using conventional vendor-supplied methods and instrumentation to date. Nevertheless, intense efforts are still devoted to further methodological developments within the WU-Minn consortium, largely targeting optimization of the 7T HCP data collection that we aim to commence in the fall of 2013. However, the impact of these developments is also anticipated to go well beyond the current HCP and will hopefully spread to future efforts at any field strength. Accelerated volume coverage, whether with Multiband as currently employed in the HCP, or new approaches to be developed, may soon become the default acquisition scheme in fMRI and dMRI studies. The utility of these MR techniques are relevant to potential new initiatives investigating connectomics, for example, in relation to development, life-span, and/or brain diseases. Such initiatives will be able take full advantage of on-going methodological improvements that would be available at the time of their start. Some of these improvements or targets for improvements are summarized below.
Methodological Improvements
Reference Scans in Multiband Unaliasing
One of the major issues in parallel imaging is the consistency between “reference” or “calibration” scans that are obtained typically at the beginning of the data collection period and the subsequently acquired accelerated data. These calibration scans are the source of spatial information provided by each element of a multichannel coil array, and are used to unalias overlapping data acquired in an accelerated scan. Rigid body motion of the subject’s head subsequent to, or during the acquisition of the calibration scan is a major potential confound for accurate unaliasing. In an fMRI time series, motion is a problem even when parallel imaging is not employed; methods for correcting rigid body motion in an fMRI time series by “realigning” volumetric data is routinely performed in fMRI data analysis. Simply using this type of correction on the 3T Multiband tfMRI data was evaluated using task-induced activations detected at a given statistical threshold, when subjects were asked to be still or voluntarily engage in motion that would degrade functional maps. The “conventional” volumetric realignment, which ignores the potential additional problem of a mismatch between the calibration scan and the subsequent images, was found to be surprisingly successful (see (Smith et al., 2013) in this issue). This likely reflects the fact that coil sensitivity profiles are spatially slowly varying functions. However, at higher magnetic fields such as 7T, the receive B1 (i.e. B1−) phases that provide detailed spatial information, are significantly more complex (Van de Moortele et al., 2005) and contain higher spatial frequencies compared to lower field MR data. Thus, a simple realignment of the volumes in the fMRI time series may not be adequate. Compensation with Prospective Motion Correction (PMC) approaches for interscan (i.e. between acquisitions of volume of interest) (Aksoy et al., 2011; Kober et al., 2012; Kober et al., 2011; White et al., 2010; Zaitsev et al., 2006), or intrascan (i.e. during acquisition of the volume of interest) (Herbst et al., 2012) motion would overcome this problem to a certain degree (and is being pursued in the WU-Minn HCP consortium); PMC, however, would not deal with the changes that may be expected in EPI images, especially at high fields, due to altered B0 inhomogeneities over the brain, and/or the loading of the receive coil elements when the head moves.
Another important concern is the imaging sequence employed for the acquisition of the calibration scan. The use of the same imaging sequence for the calibration scans as for the subsequent data acquisition, thereby keeping the same artifacts, appears intuitively preferable. However, this is not necessarily possible, if acceleration along the phase encoding direction is employed (as one must for high resolution EPI images at 7T) in addition to Multiband along the slice direction. One cannot just use images of each slice obtained individually still using acceleration along phase encoding direction. Calibration scans are also needed for the phase-encode undersampling and this is typically done using segmented multi-shot (as opposed to single-shot) EPI. However, segmented EPI sampling of k-space is prone to degradation induced by subject motion as well as physiological processes related to respiration and cardiac pulsation (Moeller et al., 2008); this degradation typically appears in the form of “ghosting” artifacts, i.e. displacement of signal intensities to regions where they should not be. Respiration can be a source of small rigid body motion of the head but it also affects MR images, especially EPI (Pfeuffer et al., 2002; Van De Moortele et al., 2002), through perturbations of the B0 field over the brain caused by alterations of air-filled lung volume during the respiration cycle, because air has significantly different magnetic susceptibility than tissue. Cardiac pulsation induces non-rigid body motion in the brain, most prominent in ventral parts, particularly in the brainstem.
Thus, a segmented EPI acquisition is not necessarily optimal as a calibration scan for unaliasing images obtained with simultaneous acceleration along the slice and phase encode directions. Instead, we examined the use of standard GRE images, acquiring one k-space line after an RF pulse (i.e. FLASH) as a calibration scan, acquired with a lower resolution than the final resolution of the subsequently accelerated data. Figure 11 illustrates a single slice from a whole brain Multiband GRE EPI 7T data set acquired with 1.1 mm isotropic resolution using MB=3 and phase encode undersampling of 3 (GRAPPA). The top row shows the same slice from two different Multiband EPI acquisitions using a single volumetric data obtained with FLASH as a calibration scan. The lower row illustrates the same slice, also from two separate Multiband EPI acquisitions using the same parameters as in the top row, but obtained using a separate segmented EPI as a calibration scan for each of the separate acquisitions. The lower row images show artifacts (indicated by the arrows), largely appearing as horizontal stripes, which are, more importantly, inconsistent across images. The likely cause of this inconsistency is that the calibration scans are not identical owing to the aforementioned increased sensitivity of segmented EPI to physiologic processes and head motion. When a single (i.e. the same) segmented EPI data was employed as the calibration scan (data not shown), the inconsistency of the artifacts was significantly reduced but the level of the artifact did not favorably compare to the top row where a FLASH acquisition was employed as the calibration scan. Thus, potential improvements are expected with the use of FLASH calibration scan.
FIGURE 11.

Effect of calibration (i.e. reference) scan on image reconstruction of slice accelerated multiband images at 7T. A coronal cross sections of axially acquired 7T whole brain data set acquired with slice and in-plane-phase encode accelerated Multiband EPI using different calibration scans: Top row: GRE (i.e. FLASH) calibration scan, Lower row: EPI calibration scans. Data were acquired in the same session from the same subject. Each volumetric image set had its own calibration scan. Multiband EPI was obtained with MB=3, in plane acceleration =3, TE/TR=20ms/2740ms, 1.1 isotropic resolution, 8/6 partial Fourier along phase encode direction, 123 slices. The GRE (FLASH) calibration scans had “matched” TE/TR 20ms/2740ms, 1.1×2.4×1.1mm resolution, and FOV of 209×209×135mm as in EPI.For the EPI the single band ACS data was acquired with 48 ACS lines.
In dMRI, presence of the diffusion gradients drastically increases the sensitivity to any kind of change in spatial position, induced through rigid-body motion or physiology, during the diffusion-encoding period. This effect takes the form of signal attenuation that cannot be distinguished from the attenuation caused by the diffusion process; it also produces spatially varying phases that are inconsistent with those of the calibration scans, hence leading to degradation of the unaliasing process. Figure 12 illustrates this temporal fluctuation that is present even in the absence of rigid body head motion; these fluctuations are ascribed to the effect of the physiological processes on the unaliasing algorithm, and, in particular, were found to be amplified in dMRI (but not in fMRI) when slice acceleration was combined with in plane phase encode undersampling. dMRI images are not routinely examined in this fashion, i.e. by repeating a single diffusion encoding (single b value and gradient orientation) to generate a time series. Instead, dMRI acquisitions obtain several volumes with different b values and/or orientations, which could disguise the temporal instabilities as variations in diffusion contrast encoding. However, this evaluation was part of the extensive quality control in the WU-Minn HCP sequence and image reconstruction development effort. It is possible that the use of a FLASH calibration scan will minimize these temporal instabilities, but this has not yet been tested. Alternative strategies based on dynamically updating the calibration scans are also being explored to deal with this problem (Moeller et al., 2013), and can be combined with a previously mentioned FLASH calibration scan as well, possibly achieving the best performance. However, these instabilities were one reason why we decided against using multiband in combination with acceleration along phase encode direction in the final 3T HCP diffusion protocol, despite the high in-plane spatial resolution used (1.25 mm) (Sotiropoulos et al., 2013a).
FIGURE 12.

Temporal stability in dMRI data acquired at 3T with slice and in-plane acceleration. A single slice as a function of time is shown from a monopolar dMRI acquisition with a single b value and direction (b=1500 s/mm2); MB=3 and in-plane phase encode acceleration of 3, 2 mm isotropic resolution, repeated consecutively in time. Acquired on the 3T WU-Minn HCP scanner. Adapted from (Moeller et al., 2013).
Power Considerations: Peak Power Limitation
In slice-accelerated multiband imaging, the number of simultaneously excited slices dictates the number of bands required in the RF pulse. Conventionally, increasing the number of bands in an RF pulse also increases the required peak B1 of the pulse and the voltage applied to the RF coil to generate that B1. As previously mentioned, this does not present a significant problem in applications such as GRE Multiband EPI based fMRI, since only an excitation pulse is needed, and the short TR values attained with slice acceleration are accompanied by a reduction in the excitation flip angle to the “Ernst” angle for optimal SNR. When spin echo acquisitions are required, as in dMRI, however, the acceleration factor becomes easily limited by the peak power and, ultimately, total power deposited (see below) needed to achieve the 180° flip angle for the refocusing pulses to yield optimal SNR.
The conventional method employed to generate an RF pulse with N bands is to simply compute the complex sum of N frequency-shifted single-banded waveforms (Muller, 1988), leading to increases in the peak B1 and the instantaneous peak power of the multi-banded pulse by a factor of ~N and ~N2, respectively, over the original single-banded pulse. In practice, the peak power can be reduced to achievable levels by increasing the pulse duration, or by using a technique such as VERSE (Conolly et al., 1988). Increasing the pulse duration, however, also increases minimum achievable TE and TR, and decreases the RF bandwidth, leading to degraded slice profiles, especially in the presence of B0 inhomogeneities. VERSE is particularly sensitive to B0 inhomogeneity. While VERSE has been successfully demonstrated for SE MB with acceleration factors of three (Setsompop et al., 2012), using VERSE with higher accelerations would likely incur unacceptable degradations in slice profile quality.
Recently, we demonstrated a simple approach for generating multi-banded RF pulses with reduced peak power (Auerbach et al., 2013) without incurring any reduction in bandwidth. This approach relies on the addition of a small temporal shift between the bands, which is optimized to avoid direct overlapping of the central regions of the pulses, where the required B1 magnitude is the greatest. Figure 13A illustrates a MB=4 RF pulse constructed in the conventional way, when the pulse width is simply increased to reduce peak power, resulting in increased bandwidth, and the time-shifted MB=4 pulse retaining the same bandwidth as the original pulse. Figure 13B plots peak power as a function of the total pulse duration achieved either by increasing the bandwidth, or keeping the bandwidth the same but inserting a time shift. The figure demonstrates that the peak power is essentially reduced to values of a single base pulse, incurring a penalty of just a small increase (typically a few milliseconds) in the overall pulse duration while the bandwidth remains the same.
FIGURE 13.

Reduction of peak power using Time-Shifted Multiband pulses: (A) Pulse shapes, from left to right: conventional four-banded (MB4) pulse of duration t, composed of four single-banded (SB) sinc RF pulse (R = 5.2) with band #1 (no frequency offset) and band #4 ~3 kHz frequency offset; the same conventional MB4 pulse with stretched duration of 1.75·t, time-shifted MB4 pulse generated for duration 1.75·t (25% temporal shift between bands). For all plots, solid lines represent the magnitude, dashed lines the real component, and dotted lines the imaginary component. (B) Plot of required peak B1 vs. total pulse duration for four-banded pulses with 3 kHz inter-band frequency offsets: stretched conventional pulse (dark blue), time-shifted pulse (green), time-shifted with static (i.e. fixed) inter-band phase offsets (light blue), and time-shifted with optimized phase offsets for each shift (red). B1 and duration are shown relative to the base single-banded sinc pulse. Note that time shifted pulses ultimately achieve the same peak B1 whether or not phase optimization is employed. Adapted from (Auerbach et al., 2013).
In a spin echo implementation, if two refocusing RF pulses are used, for example to mitigate the eddy current effects due to diffusion encoding gradients (Feinberg and Jakab, 1990; Reese et al., 2003), time-shifted multi-banded refocusing RF pulses can simply be used in place of single-banded pulses without further modifications to the sequence. The dephasing induced by the asymmetry of the slice selection gradient moment around the RF of a given band in the first refocusing pulse is balanced exactly by an opposing moment around the second refocusing pulse. In this sequence, no shift is applied to the (nominally 90°) multi-banded excitation pulse. In the WU-Minn HCP, the monopolar spin echo scheme was preferred because it shortens the TE significantly and because excellent algorithmic approaches for correcting eddy current effects have been developed ((Sotiropoulos et al., 2013a), in this issue). With the monopolar scheme, it is necessary to apply time shifts to both the refocusing and the excitation pulses in order to balance the slice selection gradient moments experienced by each band. Figure 14 shows a few slices obtained from the human head using a monopolar, spin-echo, Multiband EPI dMRI sequence at 3T (HCP Skyra), but without any diffusion weighting (i.e. b=0 s/mm2), keeping the same TR. As the MB factor is increased, conventional RF pulses can no longer achieve a 180° pulse, and the refocusing performanc e increasingly deviates from this ideal flip angle; consequently SNR starts decreasing due to imperfect refocusing of the signal. With the time-shifted pulse, however, the images remain unchanged.
FIGURE 14.

Overcoming peak power limitation in Multiband spin-echo acquisition using Time-Shifted Pulses. Comparison of human brain images acquired with multi-band slice accelerations of 3–6 (MB3-MB6) using conventional multi-banded RF pulses (left column) and time-shifted RF pulses (right column) with equivalent effective bandwidth. The display window and level are the same for all images. Adapted from (Auerbach et al., 2013).
Power Considerations: Total Power (i.e. SAR) Limitation
The time-shifting approach ameliorates only the peak power problem; when this limitation is circumvented, the next impediment is typically total power deposition or SAR. By Parseval’s theorem, the total power deposited by the Multiband pulse is dictated only by the number of slices manipulated (excited and/or refocused) because the individual pulses of a multiband RF pulse operate at sufficiently different frequencies. Total power deposition is consequently identical when the slices are manipulated simultaneously or in a time-shifted manner as described above. More importantly, if the TR and the number of slices are the same, SAR for the Multiband EPI sequence remains unchanged compared to a conventional multi-slice EPI acquisition where the slices are obtained sequentially in time rather than simultaneously. When the TR is reduced by the MB factor in Multiband EPI, however, the SAR also increases by exactly the MB factor as well.
One possible solution to the SAR problem is the use of PINS pulses (Koopmans et al., 2012a; Norris et al., 2011). However, PINS pulses generate in principle an infinite number of repeating slices, and as such are not suitable for axial or axial-oblique slice preference since they would generate slices outside the field of interest (i.e. outside brain and virtually in the entire field of view seen by the transmitting) as well. This problem can be circumvented by using a conventional slice-selective multiband pulse for one of the two or more pulses of the spin-echo sequence (Koopmans et al., 2012b); this, of course, introduces the power problems associated with the conventional pulse, albeit to a lesser degree than using conventional pulses for all pulses involved. An alternative is the use of parallel RF transmission (pTx) with multichannel transmit coils. In an elementary way, it can be conceptualized that multiple coils positioned so as to have distinct and non-interacting transmit B1 (B1+) profiles, with each coil exciting a single slice within their unique non-overlapping B1+ field, would lower SAR; in this scenario, instead of each coil getting a MB pulse with increased power deposition, they would get a single band pulse for the slice, thus leading to lower overall power deposition. Although this simplistic description is adequate for didactic purposes, it does not represent a practical scenario since number of coils elements in a transmit array are far fewer than the number of slices to be excited and extensive overlap in B1+ among the different coil elements and spatially non-uniform B1+ profile for individual coil elements exist. In this case, complex pTx pulse design can be employed (see next section). This option also provides the interesting possibility to simultaneously improve the B1 uniformity over the excited slices (discussed in the next section).
Transmit B1 inhomogeneities
It is well recognized that the B1 distribution in the human brain becomes highly non-uniform with increasing magnetic fields, especially at 7T where it can become a serious impediment in acquiring images with uniform contrast and or SNR (Barfuss et al., 1990; Barfuss et al., 1988; Van de Moortele et al., 2005; Vaughan et al., 2001). The problem arises because the resonance frequency of the RF employed for the excitation and detection of hydrogen nuclei increases linearly with magnetic field magnitude and reaches levels, at 3T and above, where the wavelength becomes smaller than the object dimensions. Figure 15 demonstrates 7T transmit B1 maps in several transaxial slices in the human head for a volume coil that generates a uniform B1 field when unloaded. The presence of a strong non-uniformity in B1 magnitude can be appreciated. In particular, the temporal lobes and the cerebellum in the ventral (inferior) slices of the brain (top two slices shown in Figure 15), receive very little B1, while, in the same slice, there are centrally localized regions with approximately six- to ten-fold higher B1. While within slice uniformity is better in the dorsal (superior) slices, the transmit B1 magnitude in these slices is also significantly higher than what is achieved peripherally in lower slices.
Early work at 4T invoked “dielectric resonances” (Barfuss et al., 1990) in order to explain these dramatic non-uniformities in B1. Subsequently, it was demonstrated that standing waves that lead to such “resonances” per se are not supported in the conductive environment of the human tissue (Yang et al., 2002); rather, experiments performed at 7T along with accompanying electromagnetic modeling studies, illustrated that the B1 inhomogeneities result from the destructive interferences (Van de Moortele et al., 2005) that arise from the traveling wave behavior of RF (Yang et al., 2002) at these high frequencies. If a volume transmit coil is employed for signal excitation, as in the case of Figure 15, but the signals are detected with a separate multichannel receiver array, the non-uniformities of transmit B1 and receive B1 can be complementary, resulting in images that can appear quite uniform in a GRE acquisition, thereby disguising the underlying B1 heterogeneity. This is precisely because signal detection sensitivity is proportional to the receive B1 amplitude, whereas the magnitude of the excited signal varies as a sine function of the flip angle, which is directly proportional to transmit B1 amplitude. This is largely the reason why the 7T GRE EPI (Figures 2, 3, 11) and the 3T GRE EPI data (Figure 6, 7, 8) appear relatively uniform. However, the effect of transmit B1 inhomogeneities can be severe in sequences where 180° pulses are involved for con trast generation, as in T1 weighted inversion recovery images, collected for depiction of anatomy, or in spin-echo sequences employed for dMRI or anatomical imaging, because of large differences in signal magnitude between regions that experience the optimum 180° pu lse versus others.
It is often assumed that such non-uniformities are minimal at 3T when a body RF transmitter is used. This is in fact not the case. Although not as severe as 7T, we have recently observed that flip angles can differ as much as 30% between the central and peripheral parts of the brain, when transmitting with the manufacturer-provided “whole body” transmit coil, leading to significant SNR differences, especially in dMRI. These SNR losses are not crippling but they do lead to less than optimal data. They also affect many aspects of the data analysis pipeline. Therefore, it is standard procedure in the WU-Minn HCP data acquisition protocol to acquire a flip angle map for each subject and to set the average flip angle of the refocusing pulse of the dMRI sequence for 3T to 160° and not 180°, so as to avoid over flipping in the center of the brain where the transmit efficiency is highest. As a result, only the center of the brain experiences close to optimum flip angles (~ 180°), while the periphery sees smaller flip angles; this peripheral SNR loss is compensated by the higher sensitivity of the receiver array coil in the periphery. Further, in using this strategy, lower SAR is consequently achieved.
These B1+ inhomogeneities can be corrected or at least mitigated using pTx methods with a variety of techniques, such as B1-shimming (Adriany et al., 2005; Metzger et al., 2008; Snyder et al., 2009; Suttie et al., 2012; Vaughan et al., 2006), transmit SENSE (e.g. (Katscher et al., 2003; Katscher et al., 2004; Zhang et al., 2007)), spoke pulses (e.g. (Cloos et al., 2010; Jankiewicz et al., 2010; Ma et al., 2011; Setsompop et al., 2009; Zelinski et al., 2008)), k-T pulses (Cloos et al., 2012), etc. The B1+ inhomogeneities are position-dependent in 3 dimensions (Figure 15). These parallel transmit methods, however, have not so far been employed for MB pulses. Recently, methods for optimizing simultaneously for all MB bands in a pTx application, together with constraints on parameters such total RF power or SAR was developed as part of the 7T HCP effort in our consortium by Wu et al. (Wu et al., 2013a, b).
In a pTx MB pulse, each channel of the multichannel system is assigned a channel-specific weight for each frequency band responsible for each of the slices in the multiband pulse and weights are obtained by solving the following magnitude least square problem:
Here Afull is a block diagonal matrix with Am being the diagonal element matrices, and wfull is a concatenated vector with wm (m = 1,2, …, M) being a vector of “RF shim” (or weight) values of individual channels for the m-th band; the use of is an optimum constraint for total RF power in this pulse, which we refer to as an “Full pTx MB” pulse.
Figure 16A illustrates L curves for an MB 2 and MB 8 pulse, quantifying tradeoffs between total RF power of the pulse (proportional to global SAR) and excitation errors (i.e. deviation from a uniform transmit B1, expressed as root mean square error (RMSE)) in such a pulse design, targeting uniform B1 in all slices simultaneously with total RF power constraint; the pulse design uses a single “spoke”. The figure shows results for Full pTx MB and a simpler construct we call “MB B1 shim” pulse; the latter is a pulse composed of the standard MB pulse applied through multichannel transmit, but with each channel receiving a different phase and amplitude. In other words, in the Full pTx MB pulse design, each band has a different weight (phase and amplitude) for each of the separate transmit channel; in the B1 shim MB pulse, the different bands have the same weight for each of the channels, but the different channels get channel specific phase and amplitude change on the MB pulse. For example, for a 16 channel MB 8 pulse, there are only 16 complex variables to optimize in the B1 Shim MB pulse and 128 variables in the Full pTx MB Pulse. The reason for considering the two different constructs is that while Full pTx MB pulses will be readily applicable with one of the 7T systems at CMRR, which is equipped with 16 channel (full pTx) transmitters, or few other 7T systems in the field with 8 channel full pTx capability, they would not be applicable in any of the current generation 3T scanners, including the two 3T Connectome scanners, since such multi-transmit capability is not available on these systems. However, the B1 Shim pulse design can be applicable in any system using a multichannel head coil and a modification to the RF transmit chain that takes the single channel output of the scanner, splits it into multiple channels, and uses a channel-specific phase and gain controller before the amplification stage.
FIGURE 16.

Using parallel transmit to simultaneously improve transmit B1 and constrain total RF energy of multiband pulses. (A) L curves quantifying tradeoffs between total RF power and excitation errors (i.e., root mean square error (RMSE)) in the human brain at 7T for Full pTx MB (○) and MB B1 shim (×), along with Circularly polarized (CP) mode (□) located at the crossing between the horizontal and vertical lines, labeled “Same fidelity” and “ Same Power”, respectively. Calculations were performed for a 7T coil described previously (Adriany et al., 2008) with azimuthally distributed 16 transmit and receive microstrip elements (B) MB2 RF excitation in the human brain at 7T for CP mode conventional MB, MB B1 shim and Full pTx MB pulses with the same total RF power. The pulses were designed for the coil described in (A) using subject dependent B1 calibration maps. The pulses were based on a single spoke design, with the base pulse being a filtered SINC pulse of BWTP = 10. Pulse duration = 1 ms, nominal flip angle = 6°, and inter-slice distance = 56 mm.
Figure 16 also illustrates what would be obtained with a conventional circularly polarized (CP) transmit. The horizontal dashed lines illustrate the different fidelity to a uniform target that can be achieved while keeping the pulse power the same; the vertical lines demonstrate power reduction that can be attained for the same fidelity. More quantitative analyses based on Bloch simulations revealed that when using the same total RF power as in the CP mode, the B1+ inhomogeneity, measured by std/mean of B1+ maps, improved from ~25% for CP, to ~17% for B1 shim MB and to ~10% for Full pTx MB design. When achieving the same excitation fidelity, the total RF power of the pulse, which would be proportional to total power deposited (i.e. SAR), decreased by ~58% for B1 shim MB and ~72% for Full pTx MB design, as compared to the CP mode. Part of this decrease was due to a decrease in the mean flip angle. However, even accounting for this resulted in ~56% less total RF power in the Full pTx MB design compared to the CP mode. Experimentally measured power deposition values reported by the SAR monitoring system of the 7T instrument were consistent with the calculated differences. The section of the L-curve between these two limits marked by the straight horizontal and vertical lines that intersect at the CP-mode point (Figure 16A) represent possible compromises that can be made between these two cases; most notable would be the point at approximately the L-curve inflection which would provide significant improvements in fidelity (B1+ homogeneity) as well as RF power compared to the CP mode. Figure 16B shows experimental results for an MB 2 pulse, which demonstrates that the numerical predictions are in excellent agreement with the experiments. Such pulses will likely be employed for the HCP data acquisition at 7T at CMRR.
Resting State-fMRI at 7 Tesla
The WU-Minn HCP initiative has a significant ultrahigh field component (7 Tesla and possibly 10.5T as well5) based on the expectation that higher field will provide significantly better fMRI data. At a minimum, these expectations will rely on the intrinsic SNR in imaging, which improves slightly better than linearly with the magnetic field strength (Vaughan et al., 2001). Such SNR gains can be utilized for higher spatial resolution, a critical factor in RSN detection. In addition, further gains beyond a simple SNR enhancement are expected for fMRI at 7T because of improved spatial fidelity of the functional mapping signals relative to the sites of altered neuronal activity, and increases in the functional contrast.
Until recently, rfMRI studies have been done using 3 Tesla or lower magnetic fields and have typically employed voxel volumes of approximately 27 mm3 (i.e. 3 mm isotropic resolution) or larger to achieve sufficient minimum SNR and fCNR. Moreover, these studies generally use spatial smoothing with large unconstrained volumetric Gaussian kernels (~ 4 to 6 mm FWHM) to reduce noise, and often resort to volume-based group averaging, which further amplifies spatial blurring by requiring additional smoothing of the functional data to compensate for the variability of anatomical structures across subjects. Consequently,,the “partial volume” effects arising from the large effective voxel size employed at 3 Tesla constrain the spatial accuracy of the resulting fMRI maps, as well as the connectivity and network studies that are derived from them. These limitations are alleviated significantly in the 3T rfMRI data that is currently being obtained in the WU-Minn HCP consortium; as a result of the imaging methodology advances, spatial resolution of these data has been reduced to 2 mm isotropic and is achieved with sub-second TR (see also (Smith et al., 2013) in this issue). Additionally, new cortical surface-based and constrained subcortical volume-based preprocessing and analysis methods have been developed to maximize the spatial specificity of rfMRI and tfMRI data generated ((Barch et al., 2013; Glasser et al., 2013; Smith et al., 2013) in this issue). However, these improvements in spatial resolution, temporal sampling frequency and the analysis methods cannot overcome the limitations imposed by the intrinsic physiological nature of the functional imaging signals.
The GRE BOLD fMRI technique employed in fMRI applications suffers from inaccuracies in functional mapping because of contributions from large draining veins. This is true at all magnetic fields because the extravascular BOLD effect associated with large vessels is present at any magnetic field and increases linearly with magnetic field strength (e.g. (Uludag et al., 2009) and references therein). The GRE fMRI signals also emanate from intravascular space due to T2 and T2* alterations (Uludag et al., 2009) and frequency changes (Haacke et al., 1994; Lai et al., 1993) within blood that accompany neuronal activity modulations. This intravascular effect is particularly pronounced at lower fields, such as 1.5 and 3T; however, unlike the extravascular BOLD effect, it virtually disappears at 7T and above in T2* weighted functional images due to the rapidly diminishing T2 of blood (Duong et al., 2003). This is an advantage for ultrahigh magnetic fields; however, the inaccuracies in GRE fMRI persist because of the extravascular effect, even at 7T.
The spatial inaccuracies in functional mapping using GRE fMRI have been quantified experimentally in several ways. The correlation between the GRE fMRI response and neuronal spiking rate measured in the cat cortex at 4.7T was shown to break down when the area considered for the averaging of the two distinct measurements were reduced below ~4×4 mm2. The FWHM of the point spread function (PSF) for GRE fMRI was estimated to be 3.5 mm (Engel et al., 1997) in the human brain at 1.5T and 3.9 mm at 3T (Parkes et al., 2005). At 7T, however, the PSF of GRE fMRI images was determined to be ~2 mm or less at FWHM in the human brain, in regions devoid of the large veins visible in the relatively high resolution images of this study (Shmuel et al., 2007).
Despite the continued presence of functional signals with dubious spatial connections to neuronal activity, there are mechanisms at ultrahigh fields that counteract this obfuscation; namely, the enhanced contribution of functional mapping signals of microvasculature origin (i.e. from capillaries and small venules that emanate from them), which are intrinsically weak but increase supra-linearly with magnetic field and become robustly detectable at 7T (Yacoub et al., 2005). It is the presence and even the relative dominance of this microvascular mapping signal that allows the detection of columnar organizations and cortical layer specific activation at very high magnetic fields, either when the large vessel effects are suppressed, as in spin-echo fMRI (Olman et al., 2012; Yacoub et al., 2008; Yacoub et al., 2007; Zimmermann et al., 2011), or even in their continued presence (Cheng et al., 2001; Koopmans et al., 2010; Menon et al., 1997; Polimeni et al., 2010; Stringer et al., 2011; Yacoub et al., 2007). The latter can be understood in terms of the high spatial resolutions achievable at ultrahigh fields. For example, with optical imaging using “intrinsic” deoxyhemoglobin signals, the large vessel contribution is also seen in functional maps and blocks the tissue signals underlying it; but at the very high spatial resolution afforded by optical imaging, there are plenty of regions surrounding the large vessel where only tissue with its microvascular signals are detected without the large vessel confound. At coarser resolutions, however, the dominant large vessel signal is blurred over the adjacent tissue signals and obscures them. The analogy is not perfect because, unlike in optical imaging, the large vessel contributions to fMRI extend somewhat beyond the boundaries of the large vessels; nevertheless, the findings are informative even with this caveat.
The discussion of ultrahigh fields for the fMRI component of HCP must also consider fCNR as a function of the magnetic field magnitude. It is well recognized that in tfMRI, fCNR is dictated by temporal fluctuations in an fMRI time series (i.e. by temporal SNR or tSNR) and that tSNR can be dominated by “physiological” fluctuations and not by the intrinsic thermal noise present in an image (e.g. see (Biswal et al., 1996; Hu and Kim, 1994; Hyde et al., 2001; Kruger and Glover, 2001; Mitra et al., 1997; Triantafyllou et al., 2005; Triantafyllou et al., 2011)). It has also been proposed that “physiological” noise is proportional to signal amplitude (Hyde et al., 2001; Kruger and Glover, 2001). If so, going to higher fields should not improve fCNR since both the signal amplitude and the “physiological” fluctuations will increase commensurately with field strength6. However, this noise model likely applies to large vessel contributions, the primary source of signal fluctuations (Kim et al., 1994), and not to the microvascular contribution (Yacoub et al., 2005); consequently, it is not equally valid at different field strengths. In addition, at resolutions such as 3 mm isotropic, tSNR is largely dictated by thermal noise at 3T and, to a lesser extent, even at 7T (Triantafyllou et al., 2005). The target of most 7T fMRI studies and the 7T studies in the WU-Minn HCP consortium are at a minimum three fold smaller than 3 mm3. At such resolutions, irrespective of the differentiation between microvascular and large vessel effects, fCNR will increase with magnetic field strength in tfMRI because of the dominance of thermal noise in tSNR.
Interestingly, in the aforementioned considerations for fCNR for tfMRI, spontaneous signal fluctuations of neural origin, the desired substrate for RSNs, are often considered “physiological noise” and lumped in with the noise component of tSNR. But these are the signals we are trying to capture in rfMRI; thus, besides thermal noise, “noise” in tSNR for an rfMRI study only surmises temporal signal fluctuations of non-neural origin, such as those due to respiration and cardiac cycles. When these non-neural signal fluctuations can be specifically identified and accounted for, especially with the rapid sampling of fMRI time courses and the use of temporal preprocessing methods like Independent Component Analysis (ICA) denoising (see (Smith et al., 2013) in this issue), the residuals in the rfMRI time series become thermal noise. As such, the functional sensitivity limitations due to physiological “noise” are not the same for rfMRI as in tfMRI, suggesting further that ultrahigh fields will improve the detection of RSNs.
Despite the aforementioned gains expected, RSNs were not studied at 7T until recently, although the origin of the fluctuations in the fMRI time series was examined at this field strength (Bianciardi et al., 2009; Shmueli et al., 2007). We have recently demonstrated the robust detection of RSNs in whole brain rfMRI at various spatial resolutions down to 1 mm isotropic resolution (De Martino et al., 2011). Three orthogonal slices are shown in Figure 17 for the Default Mode Network (DMN) at a 1 mm isotropic spatial resolution superimposed on an anatomical image of the same subject obtained with 0.6 mm isotropic spatial resolution. Note the very fine structured depiction of the DMN, largely restricted to the cortical gray matter areas instead of the diffuse activity that typically characterizes the 3 mm isotropic resolution acquisitions at 3T or even 7T (De Martino et al., 2011). In addition, such high-resolution studies provide additional information that allowed distinguishing vascular versus parenchymal resting state signals (De Martino et al., 2011), which is critically important in distinguishing neuronal activity versus vascular effects.
FIGURE 17.

Default Mode Network (DMN) extracted from 1 mm isotropic resolution 7T resting-state fMRI time series. DMN, shown on three orthogonal slices, was extracted by ICA from 7T resting state data acquired using standard EPI without slice acceleration but with 4-fold acceleration along the in-plane phase encode direction. The DMN data in color is superimposed on 0.6 mm isotropic T1 weighted anatomical images obtained with MPRAGE at 7T. Adapted from (De Martino et al., 2011).
The 7T rfMRI study illustrated in Figure 17 was not performed with the previously mentioned slice-accelerated Multiband or Multiplexed EPI sequences that have been shown to improve the statistical significance in the detection of RSNs. Rather, only conventional slice–selective, single-shot EPI with parallel imaging along the phase encoding dimension was employed. The current HCP developments are now targeting high resolution 7T fMRI acquisitions which would combine MB and in-plane GRAPPA accelerations.
Figure 18 demonstrates example 1 mm isotropic 7T GRE EPI data obtained over the entire brain with a 32 channel coil using MB=3 and 4-fold in-plane acceleration (GRAPPA) along the phase encoding dimension (PIPE). Note that as previously discussed, the need to employ PIPE at 7T for adequate EPI image quality reduces the maximal attainable MB acceleration at this field strength. Figure 19 illustrates a comparison of a single-subject RSN obtained from a single subject on the WU-Minn Connectome Skyra with the final rfMRI protocol of the HCP data base (2 mm isotropic, MB=8, no in plane acceleration) vs. a 7T image of the same RSN on the same subject obtained at 7T with 1.25 mm isotropic resolution, MB=3 and in plane PIPE=3, with the same total imaging time. The 7T data in this case was acquired with the SC72 “whole body” gradient set, as opposed to a head gradient set in Figure 18. The 7T RSN maps are extensive and highly detailed, following largely the gray matter contours of the brain. These data are particularly encouraging because the RSN pattern follows the contours of the gray matter around the calcarine sulcus, with the two banks of this sulcus clearly resolved (coronal slice). In other cases, signal is seen restricted to one bank of a sulcus. These preliminary data indeed confirm the expectation that 7T will provide better and higher resolution RSNs. A positive impact of such high-resolution data on connectivity and network analysis is expected but remains to be investigated.
FIGURE 18.

7 Tesla Multiband EPI data acquired with concurrent slice and in-plane phase encode acceleration. Three orthogonal slices are shown from a 1 mm isotropic resolution whole brain 7 Tesla Multiband EPI data obtained with a 32 channel receive array, MB=4, in-plane phase encode acceleration of 3, PESHIFT of FOV/3.
FIGURE 19.
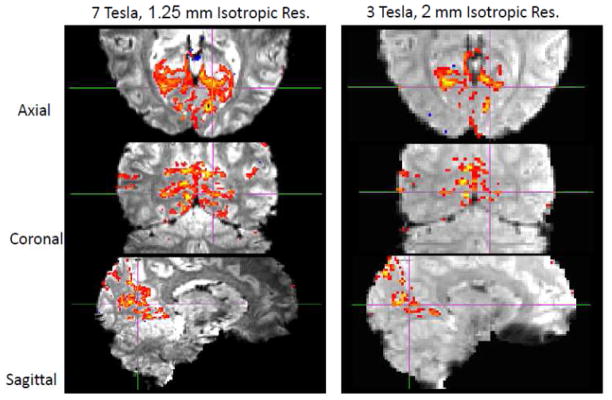
Detection of an RSN at 3T vs. 7T on the same subject. Three orthogonal slices extracted from 7 and 3 Tesla Multiband rfMRI on the same subject depicting the same RSN. The data were processed without any spatial smoothing. The 3T parameters were: 2mm isotropic, TR=1.37s, 1000 time-points, ICA auto-dimensionality of d=200; 7 T parameters:1.25mm, TR=2s, 450 time-points, ICA auto-dimensionality of d=81.
Diffusion Imaging at 7 Tesla
SNR in dMRI at 7T
Since the diffusion phenomenon is magnetic field independent, gains at 7T for dMRI experiments can be expected only from image SNR. This differs for fMRI, where the contrast mechanism itself is field dependent and the 7T gains arise from image SNR as well as the alterations in the nature and the magnitude of the functional signals.
Although the field-dependent gains in intrinsic SNR (Vaughan et al., 2001) are an advantage for dMRI, the shorter T2s at 7T (Uludag et al., 2009) represent a disadvantage since dMRI experiments require a spin-echo acquisition and signal loss due to T2 decay during the diffusion encoding period is larger at 7T. The longer T1 (Rooney et al., 2007) is also a disadvantage for SNR per unit time. However, T2 and T1 vary relatively slowly with the field magnitude (Rooney et al., 2007; Uludag et al., 2009) (and references therein) while intrinsic SNR increases slightly more than linearly with the field strength (Vaughan et al., 2001). For example, the 2.3 fold increase in field strength in going from 3 to 7T results only in a ~25% decrease in T2 and a ~ 46% increase in T1. Additional losses in SNR can accrue if the bandwidth of the acquisition is increased, for example, proportionally to the field magnitude, to reduce distortions caused by increased magnetic field inhomogeneities at 7T. All of these effects can be readily calculated (Figure 20). In EPI acquisitions that are employed in dMRI, one tends to use relatively high bandwidths irrespective of the field magnitude; thus, linearly scaling the bandwidth would not be applicable. However, at 7T, one must use 2 to 4-fold accelerations along the phase encoding direction to overcome the increased B0 inhomogeneities in EPI, which results in 1.4 to 2 fold reduction SNR, respectively, due to the fewer k-space data points collected, similar to the SNR loss that would be encountered by increasing the bandwidth proportionately with field magnitude. On the other hand, the use of acceleration along the phase encode dimension reduces the echo time to the central k-space point, resulting in SNR gains. All of these effects can be calculated for a specific acquisition parameter set. Overall, however, it is likely that the 7T versus 3T SNR ratio in dMRI will be somewhere between the limits demarcated by the two groups of lines corresponding to the same and scaled bandwidths, respectively, in Figure 20. Irrespective of the experimental ambiguities, as well as potential inaccuracies in the literature-reported values of parameters (i.e. T2 and T1) that go into such a simulation, the plots in Figure 20 demonstrate that there would be an SNR advantage at 7T if the TE can be kept short, for example at values substantially less than ~100 ms. For TR=2 s or greater, 7T vs. 3T SNR ratio is minimally affected by the field-dependent increase in T1.
FIGURE 20.

Diffusion weighted imaging at 7T vs. 3T; calculation of expected SNR as a function of echo time. Ratio of 7T SNR relative to 3T SNR for the central k-space point, ko, calculated for a spin echo sequence (90 deg. excitation and a single 180 deg. refocusing pulse) as a function of tek1, the time to the first k-space point. 6/8 Partial Fourier EPI acquisition was modeled. The echo time TE is equal to tek1 plus the time to acquire 2/8 k-space points to reach the ko signal where maximum echo amplitude occurs. Note that for the above graph, TE>0 even when tek1=0 which accounts for the less than approximately linear gain in SNR at tek1=0. T1 of white matter was taken as 0.838 s at 3T (Wansapura et al., 1999) and 1.22 s at 7T (Rooney et al., 2007). Bandwidth was kept the same. The minimum TE was taken as 15 ms. The T2 at 3T was reported to be between 55 and 69 ms ((Stanisz et al., 2005) and references therein); for these calculations, it was assumed to be the average of this range, i.e. 62 ms. The 7T white matter T2 was taken as 45 ms (Yacoub et al., 2003). Intrinsic SNR was scaled 1.15 times the magnetic field as previously shown experimentally and by modeling (Vaughan et al., 2001). Same matrix size at 3T and 7T was assumed.
Thus, in principle, improved dMRI signal could be obtained in a 7T scanner equipped with 150 to 300 mT/m maximum gradient strength for diffusion weighting, which can bring TE values well under 50 ms. However, such an instrument does not currently exist. With monopolar diffusion weighting based on a single refocusing pulse and head gradients, TE of about 50 ms can be attained for b=1500 s/mm2, 1.5 mm isotropic resolution with in-plane phase encode accelerations of 3. With these parameters, there are certainly gains compared to what is possible for standard 3T instruments where TE’s for the same b value are longer. This includes a recent demonstration of differences in certain brain connectivity metrics computed from 3T and 7T data (Zhan et al., 2012). Although the acquisition protocols inevitably varied in several aspects, this study showed greater density for certain subcortical connections with the thalamus or hippocampus at 7T, but no significant difference in fractional anisotropy (FA) in various white matter areas. The main differences between the protocols were TR/TE values, which were minimized on both systems (Siemens Mangetom 7T and Siemens TIM Trio 3T), and were therefore lower at 7T (5700/57ms vs. 7800/82ms) because of superior gradient performance at 7T (70mT/m vs. 40 mT/m). However, such gains will not necessarily exist compared to the 3T Connectome instruments, due to the much higher maximal gradient magnitudes available. Nevertheless, we anticipate that 7T dMRI data with a 70 mT/m gradient set will be at least comparable to the 3T data obtained on the 3T WU-Minn Connectome scanner with 100 mT/m maximal gradients; however, the fMRI data, as well anatomical images, will clearly benefit the most from the 7T system.
Compressed Sensing in Diffusion Imaging
During the 7T optimization, we are considering potential benefits and uses of compressed sensing (CS) in q-space, which is increasingly becoming an interesting and important method for reducing data acquisition time in dMRI.
CS techniques can be applied to the reconstruction of data sampled in q-space for dMRI (Bilgic et al., 2012a; Bilgic et al., 2012b; Duarte-Carvajalino et al., 2012; Menzel et al.; Michailovich, 2011; R. Yogesh, 2011) and used for accessing information about the underlying white matter configuration and, ultimately for tractography studies. The accuracy of fiber orientation estimation techniques (Aganj et al., 2010; Basser et al., 1994; Behrens et al., 2003; Kamath et al., 2012; Wedeen et al., 2005) is dependent on how densely the q-space can be sampled (Caruyer et al., 2012) and, therefore, on available acquisition time. This comes unfortunately at the cost of increased acquisition time.
Because of the spherical nature of diffusion MRI data, several studies (Michailovich, 2011; R. Yogesh, 2011) have shown that the ridgelets basis excels in sparsifying dMRI signals. Wavelets have also been used for DSI (Menzel et al.). More recently, extension to multi-shell (i.e. with multiple b-values) data was proposed (R. Yogesh, 2011) by adapting the spherical ridgelets basis. These novel techniques have successfully demonstrated the possibility to greatly reduce the number of sample points in q-space while still achieving accurate fiber orientation estimation. However, they are all based on voxel-wise parameter estimation with “classical” deterministic CS approaches.
Another possibility is to exploit a priori information about the data in a Bayesian fashion (Ji, 2009) to further improve the CS reconstruction of single- and multi-shell diffusion data with fewer q-space data points (Duarte-Carvajalino et al., 2012), including the development of efficient inference approaches adapted to the task at hand. The resulting Bayesian compressed sensing framework exploits the spatial redundancy of the data by modeling the statistical relationships within groups (clusters) of diffusion signals. This framework also provides uncertainty estimates of the computed fiber orientation distribution function (ODF) and diffusion signals, from their compressive sensing measurements. Contrary to standard techniques that estimate only the maximum a-posteriori (MAP), this technique computes the full posterior. Since single- and multi-shell dMRI data constitutes under-sampled and linear measurements of the ODFs, the full power of CS techniques can be exploited to reduce the amount of data points required in q-space (up to 4× in the multi-shell case) and achieve good fiber orientation mapping (Cheng et al., 2012; Duarte-Carvajalino et al., 2012; Merlet, 2011). Figures 21 and 22 illustrate this approach. 7T dMRI data (Zhan et al., 2012) acquired with 128 diffusion gradients at b=1500s/mm2, and 15 additional b0 volumes was artificially down-sampled to 64 diffusion gradients (which still achieve optimal coverage of the sphere). ODFs and dMRI volumes were recovered in both cases (with “acceleration” 1 and 2 respectively), and used to generate whole brain tractography maps with TrackVis7. Figure 21 demonstrates that, at least qualitatively, very few differences can be identified between the two datasets. Quantitatively, the uncertainty associated with each fiber estimate (up to three per voxel) is also very stable (Figure 22) or even somewhat better with the CS construction based on the half the q-space points. This is not necessarily unexpected and indicates that the CS framework may provide significant improvements for tractography. Further ongoing work will explore the full power of CS (beyond simple interpolation as commonly employed in the MRI literature) to improve the direct estimation of the orientation diffusion function with reduced acquisition times (Lenglet et al., 2013).
FIGURE 21.

Compressed sensing in q-space; tractography with half the acquired q-space data. Example of whole brain deterministic tractography using the Tensorline algorithm (Lazar et al., 2003) as implemented in TrackVis (http://trackvis.org/) from a complete (Left) 7T dMRI dataset (voxel size 1.5 mm isotropic, 128 diffusion gradients, b-value =1500s/mm2 and 15 b0 values), and the same dataset reconstructed from half of the volumes (64 diffusion gradients) and a compressed sensing acceleration factor R = 2 (Right). Very few differences can be observed.
FIGURE 22.
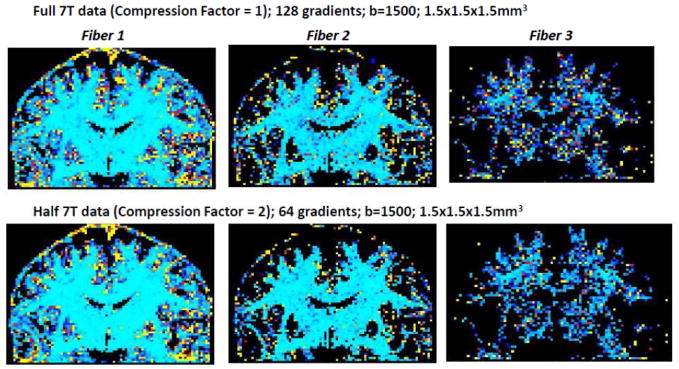
Compressed sensing in q-space; effect on fiber orientation estimation. Uncertainty associated with the estimation of each probabilistic fiber orientation (3 fibers were used). The top row corresponds to the full dMRI datasets (R=1). The bottom row corresponds to the dataset reconstructed from half of the original dataset (R=2). Light blue areas correspond to an error close to 0° while the red areas correspond to an error close to 90°. Uncertainty is very similar even when using only half of the original dMRI dataset (bottom row), when compared to the full dataset (top row).
Applications of CS to dMRI are relatively new and still require significant further development and validation. Therefore, 7T dMRI acquisition will adopt a strategy of extensively sampling q-space as in the 3T dMRI protocol so that conventional approaches can be employed in data analysis. However, CS tools may still be employed to explore if dMRI analysis can be improved or information can be extracted from acquisitions where part of q-space data are corrupted, for example due to subject motion, leaving only a subset of the targeted q-space coverage available for analysis. Thus, CS will be further evaluated in the context of the 7T HCP protocol optimization.
CONCLUSIONS
The Human Connectome Project started with a challenge to the neuroimaging community. Meeting this challenge required and still requires significant technological developments. The Human Connectome Project programmatically catalyzed an amalgamation and optimization of techniques from the armamentarium of MRI methods established largely over the last two decades, as well as the development of new technologies and instrumentation, taking brain imaging, particularly functional and diffusion weighted magnetic resonance imaging, to new levels of resolution and speed. The rigor of the resulting image encoding, image reconstruction, and data analysis methods achieved in a such a short period of time were only possible by the combined talents of numerous investigators located in several different institutions in two HCP consortia. These technological developments galvanized by the HCP are already defining new instruments and approaches to neuroimaging and, likely, will define how human brain research is ultimately performed.
HIGHLIGHTS.
We describe technical advances accomplished in the Human Connectome Project (HCP).
Highly accelerated imaging significantly improves fMRI and diffusion weighted MRI.
Instrumentation improvements in the HCP lead to superior diffusion-weighted MRI.
We describe of HCP efforts at both 3 and 7 Tesla, comparing their relative merits.
We describe recent developments with RF pulses for improved slice accelerated MRI.
Acknowledgments
The work reported in this article was supported by the Human Connectome Project (1U54MH091657) from the 16 Institutes and Centers of the National Institutes of Health that support the NIH Blueprint for Neuroscience Research and by Biotechnology Research Center (BTRC) grant P41 EB015894 from NIBIB, and NINDS Institutional Center Core Grant P30 NS076408.
Footnotes
The only exception is when the blood vessels run roughly parallel to the main magnetic field (approximately in the superior-inferior direction); in such regions, blood vessels do not have a significant extravascular BOLD effect Ogawa, S., Menon, R.S., Tank, D.W., Kim, S.G., Merkle, H., Ellermann, J.M., Ugurbil, K., 1993. Functional brain mapping by blood oxygenation level-dependent contrast magnetic resonance imaging. A comparison of signal characteristics with a biophysical model. Biophys J 64, 803-812.
The terminology is based on classification of radiofrequency (RF) bands. The frequency range 300 MHz to 3 GHz is defined as Ultra High Frequency (UHF) (http://en.wikipedia.org/wiki/Ultra_high_frequency). The hydrogen nucleus resonance frequency at 7 Tesla is ~300 MHz i.e. in UHF band. Therefore, 7 to 70 Tesla is defined as Ultrahigh Field (UHF).
In a system where diffusion is unrestricted and isotropic, diffusion is described by a single scalar diffusion constant D, and the MR signal decays exponentially with increasing b according to exp(−D·b) where b is also a scalar. In the brain, D is no longer a scalar, orientation for the diffusion gradient becomes important, and the decay is non-mono-exponential.
The parameter q is a vector quantity defined by the orientation of the gradient pulse and related in magnitude to b: q⃑ = γδG⃑d /2π; for a rectangular gradient pulse, b = 4π2q2(Δ −δ/3).
A 10.5T system, funded by NIH grants other than HCP and non-NIH sources, is being developed in CMRR. This system is currently delayed due to world–wide helium shortages. Should it become operational within the funding period of the current HCP initiative, it will be explored for HCP studies as well.
Sometimes, these considerations are put forth to argue against ultrahigh fields, despite the ever increasing impressive set of high-resolution functional maps that are obtained at 7T but not at lower fields.
Publisher's Disclaimer: This is a PDF file of an unedited manuscript that has been accepted for publication. As a service to our customers we are providing this early version of the manuscript. The manuscript will undergo copyediting, typesetting, and review of the resulting proof before it is published in its final citable form. Please note that during the production process errors may be discovered which could affect the content, and all legal disclaimers that apply to the journal pertain.
References
- Adriany G, Van de Moortele PF, Ritter J, Moeller S, Auerbach EJ, Akgun C, Snyder CJ, Vaughan T, Ugurbil K. A geometrically adjustable 16-channel transmit/receive transmission line array for improved RF efficiency and parallel imaging performance at 7 Tesla. Magn Reson Med. 2008;59:590–597. doi: 10.1002/mrm.21488. [DOI] [PubMed] [Google Scholar]
- Adriany G, Van de Moortele PF, Wiesinger F, Moeller S, Strupp JP, Andersen P, Snyder C, Zhang X, Chen W, Pruessmann KP, Boesiger P, Vaughan T, Ugurbil K. Transmit and receive transmission line arrays for 7 Tesla parallel imaging. Magn Reson Med. 2005;53:434–445. doi: 10.1002/mrm.20321. [DOI] [PubMed] [Google Scholar]
- Aganj I, Lenglet C, Sapiro G, Yacoub E, Ugurbil K, Harel N. Reconstruction of the orientation distribution function in single- and multiple-shell q-ball imaging within constant solid angle. Magn Reson Med. 2010;64:554–566. doi: 10.1002/mrm.22365. [DOI] [PMC free article] [PubMed] [Google Scholar]
- Aksoy M, Forman C, Straka M, Skare S, Holdsworth S, Hornegger J, Bammer R. Real-time optical motion correction for diffusion tensor imaging. Magn Reson Med. 2011;66:366–378. doi: 10.1002/mrm.22787. [DOI] [PMC free article] [PubMed] [Google Scholar]
- Auerbach EJ, Xu J, Yacoub E, Moeller S, Uğurbil K. Reducing power in multi-banded RF pulses by time shifting. Magn Reson Med. 2013 doi: 10.1002/mrm.24719. In Press. [DOI] [PMC free article] [PubMed] [Google Scholar]
- Barch DM, Burgess GC, Harms MP, Petersen SE, Schlaggar BL, Corbetta MC, Glasser MF, Curtiss S, Dixit S, Feldt C, Nolan D, Bryant E, Hartley T, Footer O, Bjork JM, Poldrack RP, Smith S, Johansen-Berg H, Snyder AZ, Van Essen DC for the WU-Minn HCP Consortium. Function in the Human Connectome: Task-fMRI and Individual Differences in Behavior. Neuroimage. 2013 doi: 10.1016/j.neuroimage.2013.05.033. In press, NeuroImage Special Issue “Mapping the Connectome”. [DOI] [PMC free article] [PubMed] [Google Scholar]
- Barfuss H, Fischer H, Hentschel D, Ladebeck R, Oppelt A, Wittig R, Duerr W, Oppelt R. In vivo magnetic resonance imaging and spectroscopy of humans with a 4 T whole-body magnet. NMR Biomed. 1990;3:31–45. doi: 10.1002/nbm.1940030106. [DOI] [PubMed] [Google Scholar]
- Barfuss H, Fischer H, Hentschel D, Ladebeck R, Vetter J. Whole-body MR imaging and spectroscopy with a 4-T system. Radiology. 1988;169:811–816. doi: 10.1148/radiology.169.3.3187004. [DOI] [PubMed] [Google Scholar]
- Basser PJ, Mattiello J, LeBihan D. Estimation of the effective self-diffusion tensor from the NMR spin echo. J Magn Reson B. 1994;103:247–254. doi: 10.1006/jmrb.1994.1037. [DOI] [PubMed] [Google Scholar]
- Beckmann CF, DeLuca M, Devlin JT, Smith SM. Investigations into resting-state connectivity using independent component analysis. Philos Trans R Soc Lond B Biol Sci. 2005;360:1001–1013. doi: 10.1098/rstb.2005.1634. [DOI] [PMC free article] [PubMed] [Google Scholar]
- Behrens TE, Woolrich MW, Jenkinson M, Johansen-Berg H, Nunes RG, Clare S, Matthews PM, Brady JM, Smith SM. Characterization and propagation of uncertainty in diffusion-weighted MR imaging. Magn Reson Med. 2003;50:1077–1088. doi: 10.1002/mrm.10609. [DOI] [PubMed] [Google Scholar]
- Bianciardi M, Fukunaga M, van Gelderen P, Horovitz SG, de Zwart JA, Shmueli K, Duyn JH. Sources of functional magnetic resonance imaging signal fluctuations in the human brain at rest: a 7 T study. Magn Reson Imaging. 2009;27:1019–1029. doi: 10.1016/j.mri.2009.02.004. [DOI] [PMC free article] [PubMed] [Google Scholar]
- Bilgic B, Setsompop K, Cohen-Adad J, Wedeen V, Wald LL, Adalsteinsson E. Accelerated diffusion spectrum imaging with compressed sensing using adaptive dictionaries. Med Image Comput Comput Assist Interv. 2012a;15:1–9. doi: 10.1007/978-3-642-33454-2_1. [DOI] [PMC free article] [PubMed] [Google Scholar]
- Bilgic B, Setsompop K, Cohen-Adad J, Yendiki A, Wald LL, Adalsteinsson E. Accelerated diffusion spectrum imaging with compressed sensing using adaptive dictionaries. Magn Reson Med. 2012b;68:1747–1754. doi: 10.1002/mrm.24505. [DOI] [PMC free article] [PubMed] [Google Scholar]
- Biswal B, DeYoe AE, Hyde JS. Reduction of physiological fluctuations in fMRI using digital filters. Magn Reson Med. 1996;35:107–113. doi: 10.1002/mrm.1910350114. [DOI] [PubMed] [Google Scholar]
- Biswal B, Yetkin FZ, Haughton VM, Hyde JS. Functional Connectivity in the Motor Cortex of Resting Human Brain Using Echo-Planar Mri. Magnetic Resonance in Medicine. 1995;34:537–541. doi: 10.1002/mrm.1910340409. [DOI] [PubMed] [Google Scholar]
- Blaimer M, Breuer FA, Seiberlich N, Mueller MF, Heidemann RM, Jellus V, Wiggins G, Wald LL, Griswold MA, Jakob PM. Accelerated volumetric MRI with a SENSE/GRAPPA combination. J Magn Reson Imaging. 2006;24:444–450. doi: 10.1002/jmri.20632. [DOI] [PubMed] [Google Scholar]
- Breuer FA, Blaimer M, Heidemann RM, Mueller MF, Griswold MA, Jakob PM. Controlled aliasing in parallel imaging results in higher acceleration (CAIPIRINHA) for multi-slice imaging. Magn Reson Med. 2005;53:684–691. doi: 10.1002/mrm.20401. [DOI] [PubMed] [Google Scholar]
- Breuer FA, Blaimer M, Mueller MF, Seiberlich N, Heidemann RM, Griswold MA, Jakob PM. Controlled aliasing in volumetric parallel imaging (2D CAIPIRINHA) Magn Reson Med. 2006;55:549–556. doi: 10.1002/mrm.20787. [DOI] [PubMed] [Google Scholar]
- Caruyer E, Cheng J, Lenglet C, Sapiro G, Jiang T, Deriche R. Optimal Design of Multiple Q-shells experiments for Diffusion MRI. MICCAI Workshop on Computational Diffusion MRI.2011. [Google Scholar]
- Caruyer E, Cheng J, Lenglet C, Sapiro G, Jiang T, Deriche R. Optimal Design of Multiple Q-shells experiments for Diffusion MRI. Proceedings of MICCAI 2012 workshop on Computational Diffusion MRI; Toronto. 2012. [Google Scholar]
- Chaimow D, Yacoub E, Ugurbil K, Shmuel A. Modeling and analysis of mechanisms underlying fMRI-based decoding of information conveyed in cortical columns. Neuroimage. 2011;56:627–642. doi: 10.1016/j.neuroimage.2010.09.037. [DOI] [PMC free article] [PubMed] [Google Scholar]
- Chen L, Chang A, Xu J, Moeller S, Auerbach EJ, Vu AT, Ugurbil K, Yacoub E, Feinberg DA. Comparison of Simutaneous Multiband Whole Brain Imaging with Multiplexed-EPI. Proc Int Soc Mag Reson Med. 2012;20:5976. [Google Scholar]
- Chen L, Vu AT, Xu J, Moeller S, Ugurbil k, Yacoub E, Feinberg DA. Highly Accelerated EPI Evaluated for fMRI. Neuroimage. 2013a doi: 10.1016/j.neuroimage.2014.10.027. [DOI] [PMC free article] [PubMed] [Google Scholar]
- Chen L, Vu AT, Xu J, Moeller S, Ugurbil K, Yacoub E, Feinberg DA. Highly Accerlerated EPI Evaluated for fMRI. Proc Int Soc Mag Reson Med. 2013b;21:3321. [Google Scholar]
- Cheng J, Jiang T, Deriche R. Nonnegative definite EAP and ODF estimation via a unified multi-shell HARDI reconstruction. Proceedings of MICCAI 2012 workshop on Computational Diffusion MRI; Nice, France. Oct 5 2012; 2012. pp. 313– 321. [DOI] [PubMed] [Google Scholar]
- Cheng K, Waggoner RA, Tanaka K. Human ocular dominance columns as revealed by high-field functional magnetic resonance imaging. Neuron. 2001;32:359–374. doi: 10.1016/s0896-6273(01)00477-9. [DOI] [PubMed] [Google Scholar]
- Cloos MA, Boulant N, Luong M, Ferrand G, Giacomini E, Le Bihan D, Amadon A. kT -points: short three-dimensional tailored RF pulses for flip-angle homogenization over an extended volume. Magn Reson Med. 2012;67:72–80. doi: 10.1002/mrm.22978. [DOI] [PubMed] [Google Scholar]
- Cloos MA, Luong M, Ferrand G, Amadon A, Le Bihan D, Boulant N. Local SAR reduction in parallel excitation based on channel-dependent Tikhonov parameters. J Magn Reson Imaging. 2010;32:1209–1216. doi: 10.1002/jmri.22346. [DOI] [PubMed] [Google Scholar]
- Conolly S, Nishimura D, Macovski A, Glover G. Variable-Rate Selective Excitation. Journal of Magnetic Resonance. 1988;78:440–458. [Google Scholar]
- De Martino F, Esposito F, van de Moortele PF, Harel N, Formisano E, Goebel R, Ugurbil K, Yacoub E. Whole brain high-resolution functional imaging at ultra high magnetic fields: an application to the analysis of resting state networks. Neuroimage. 2011;57:1031–1044. doi: 10.1016/j.neuroimage.2011.05.008. [DOI] [PMC free article] [PubMed] [Google Scholar]
- Duarte-Carvajalino JM, Lenglet C, Ugurbil K, Moeller S, Carin L, Sapiro G. A Framework for Multi-task Bayesian Compressive Sensing of Diffusion-Weighted MRI. Proceedings of MICCAI 2012 workshop on Computational Diffusion MRI; Nice, France. Oct 5 2012.2012. [Google Scholar]
- Duong TQ, Yacoub E, Adriany G, Hu X, Ugurbil K, Kim SG. Microvascular BOLD contribution at 4 and 7 T in the human brain: gradient-echo and spin-echo fMRI with suppression of blood effects. Magn Reson Med. 2003;49:1019–1027. doi: 10.1002/mrm.10472. [DOI] [PubMed] [Google Scholar]
- Engel SA, Glover GH, Wandell BA. Retinotopic organization in human visual cortex and the spatial precision of functional MRI. Cereb Cortex. 1997;7:181–192. doi: 10.1093/cercor/7.2.181. [DOI] [PubMed] [Google Scholar]
- Feinberg DA, Hale JD, Watts JC, Kaufman L, Mark A. Halving MR imaging time by conjugation: demonstration at 3.5 kG. Radiology. 1986;161:527–531. doi: 10.1148/radiology.161.2.3763926. [DOI] [PubMed] [Google Scholar]
- Feinberg DA, Jakab PD. Tissue perfusion in humans studied by Fourier velocity distribution, line scan, and echo-planar imaging. Magn Reson Med. 1990;16:280–293. doi: 10.1002/mrm.1910160209. [DOI] [PubMed] [Google Scholar]
- Feinberg DA, Moeller S, Smith SM, Auerbach E, Ramanna S, Gunther M, Glasser MF, Miller KL, Ugurbil K, Yacoub E. Multiplexed echo planar imaging for sub-second whole brain FMRI and fast diffusion imaging. PLoS ONE. 2010;5:e15710. doi: 10.1371/journal.pone.0015710. [DOI] [PMC free article] [PubMed] [Google Scholar]
- Feinberg DA, Reese TG, Wedeen VJ. Simultaneous echo refocusing in EPI. Magn Reson Med. 2002;48:1–5. doi: 10.1002/mrm.10227. [DOI] [PubMed] [Google Scholar]
- Formisano E, Esposito F, Di Salle F, Goebel R. Cortex-based independent component analysis of fMRI time series. Magn Reson Imaging. 2004;22:1493–1504. doi: 10.1016/j.mri.2004.10.020. [DOI] [PubMed] [Google Scholar]
- Fox MD, Raichle ME. Spontaneous fluctuations in brain activity observed with functional magnetic resonance imaging. Nat Rev Neurosci. 2007;8:700–711. doi: 10.1038/nrn2201. [DOI] [PubMed] [Google Scholar]
- Glasser MF, Sotiropoulos SN, Wilson JA, Coalson TS, Fischl BF, Andersson JL, Xu J, Jbabdi S, Webster M, Polimeni JR, Van Essen DC, Jenkinson M for the WU-Minn HCP Consortium. The Minimal Preprocessing Pipelines for the Human Connectome Project. Neuroimage. 2013 doi: 10.1016/j.neuroimage.2013.04.127. In press, NeuroImage Special Issue “Mapping the Connectome”. [DOI] [PMC free article] [PubMed] [Google Scholar]
- Golay X, Pruessmann KP, Weiger M, Crelier GR, Folkers PJ, Kollias SS, Boesiger P. PRESTO-SENSE: an ultrafast whole-brain fMRI technique. Magn Reson Med. 2000;43:779–786. doi: 10.1002/1522-2594(200006)43:6<779::aid-mrm1>3.0.co;2-4. [DOI] [PubMed] [Google Scholar]
- Griswold MA, Jakob PM, Heidemann RM, Nittka M, Jellus V, Wang J, Kiefer B, Haase A. Generalized autocalibrating partially parallel acquisitions (GRAPPA) Magn Reson Med. 2002;47:1202–1210. doi: 10.1002/mrm.10171. [DOI] [PubMed] [Google Scholar]
- Haacke EM, Hopkins A, Lai S, Buckley P, Friedman L, Meltzer H, Hedera P, Friedland R, Klein S, Thompson L, et al. 2D and 3D high resolution gradient echo functional imaging of the brain: venous contributions to signal in motor cortex studies [published erratum appears in NMR Biomed 1994 Dec;7(8):374] NMR Biomed. 1994;7:54–62. doi: 10.1002/nbm.1940070109. [DOI] [PubMed] [Google Scholar]
- Hagmann P, Cammoun L, Gigandet X, Meuli R, Honey CJ, Wedeen VJ, Sporns O. Mapping the structural core of human cerebral cortex. PLoS Biol. 2008;6:e159. doi: 10.1371/journal.pbio.0060159. [DOI] [PMC free article] [PubMed] [Google Scholar]
- Herbst M, Maclaren J, Weigel M, Korvink J, Hennig J, Zaitsev M. Prospective motion correction with continuous gradient updates in diffusion weighted imaging. Magn Reson Med. 2012;67:326–338. doi: 10.1002/mrm.23230. [DOI] [PubMed] [Google Scholar]
- Hu X, Kim SG. Reduction of signal fluctuation in functional MRI using navigator echoes. Magn Reson Med. 1994;31:495–503. doi: 10.1002/mrm.1910310505. [DOI] [PubMed] [Google Scholar]
- Hyde JS, Biswal BB, Jesmanowicz A. High-resolution fMRI using multislice partial k-space GR-EPI with cubic voxels. Magn Reson Med. 2001;46:114–125. doi: 10.1002/mrm.1166. [DOI] [PubMed] [Google Scholar]
- Iadecola C. Neurovascular regulation in the normal brain and in Alzheimer’s disease. Nat Rev Neurosci. 2004;5:347–360. doi: 10.1038/nrn1387. [DOI] [PubMed] [Google Scholar]
- Iturria-Medina Y, Sotero RC, Canales-Rodriguez EJ, Aleman-Gomez Y, Melie-Garcia L. Studying the human brain anatomical network via diffusion-weighted MRI and Graph Theory. Neuroimage. 2008;40:1064–1076. doi: 10.1016/j.neuroimage.2007.10.060. [DOI] [PubMed] [Google Scholar]
- Jankiewicz M, Zeng H, Moore JE, Anderson AW, Avison MJ, Welch EB, Gore JC. Practical considerations for the design of sparse-spokes pulses. J Magn Reson. 2010;203:294–304. doi: 10.1016/j.jmr.2010.01.012. [DOI] [PMC free article] [PubMed] [Google Scholar]
- Jbabdi S, Johansen-Berg H. Tractography: where do we go from here? Brain Connect. 2011;1:169–183. doi: 10.1089/brain.2011.0033. [DOI] [PMC free article] [PubMed] [Google Scholar]
- Ji S, Dunson D, Carin L. Multitask Compressive Sensing. IEEE TRANSACTIONS ON SIGNAL PROCESSING. 2009;57:92–106. doi: 10.1109/TSP.2010.2070796. [DOI] [PMC free article] [PubMed] [Google Scholar]
- Kamath A, Aganj I, Xu J, Yacoub E, Ugurbil K, Sapiro G, Lenglet C. Generalized Constant Solid Angle ODF and Optimal Acquisition Protocol for Fiber Orientation Mapping Proceedings of MICCAI 2012 workshop on Computational Diffusion MRI; Nice, France. Oct 5 2012.2012. [Google Scholar]
- Katscher U, Bornert P, Leussler C, van den Brink JS. Transmit SENSE. Magn Reson Med. 2003;49:144–150. doi: 10.1002/mrm.10353. [DOI] [PubMed] [Google Scholar]
- Katscher U, Bornert P, van den Brink JS. Theoretical and numerical aspects of transmit SENSE. IEEE Trans Med Imaging. 2004;23:520–525. doi: 10.1109/TMI.2004.824151. [DOI] [PubMed] [Google Scholar]
- Kim SG, Hendrich K, Hu X, Merkle H, Ugurbil K. Potential pitfalls of functional MRI using conventional gradient-recalled echo techniques. NMR Biomed. 1994;7:69–74. doi: 10.1002/nbm.1940070111. [DOI] [PubMed] [Google Scholar]
- Kober T, Gruetter R, Krueger G. Prospective and retrospective motion correction in diffusion magnetic resonance imaging of the human brain. Neuroimage. 2012;59:389–398. doi: 10.1016/j.neuroimage.2011.07.004. [DOI] [PubMed] [Google Scholar]
- Kober T, Marques JP, Gruetter R, Krueger G. Head motion detection using FID navigators. Magn Reson Med. 2011;66:135–143. doi: 10.1002/mrm.22797. [DOI] [PubMed] [Google Scholar]
- Kolster H, Peeters R, Orban GA. The retinotopic organization of the human middle temporal area MT/V5 and its cortical neighbors. The Journal of neuroscience : the official journal of the Society for Neuroscience. 2010;30:9801–9820. doi: 10.1523/JNEUROSCI.2069-10.2010. [DOI] [PMC free article] [PubMed] [Google Scholar]
- Koopmans PJ, Barth M, Norris DG. Layer-specific BOLD activation in human V1. Hum Brain Mapp. 2010;31:1297–1304. doi: 10.1002/hbm.20936. [DOI] [PMC free article] [PubMed] [Google Scholar]
- Koopmans PJ, Barth M, Orzada S, Norris DG. Multi-echo fMRI of the cortical laminae in humans at 7 T. Neuroimage. 2011;56:1276–1285. doi: 10.1016/j.neuroimage.2011.02.042. [DOI] [PubMed] [Google Scholar]
- Koopmans PJ, Boyacioglu R, Barth M, Norris DG. Simultaneous multislice inversion contrast imaging using power independent of the number of slices (PINS) and delays alternating with nutation for tailored excitation (DANTE) radio frequency pulses. Magn Reson Med. 2012a doi: 10.1002/mrm.24402. [DOI] [PubMed] [Google Scholar]
- Koopmans PJ, Boyacioglu R, Barth M, Norris DG. Whole brain, high resolution spin-echo resting state fMRI using PINS multiplexing at 7 T. Neuroimage. 2012b;62:1939–1946. doi: 10.1016/j.neuroimage.2012.05.080. [DOI] [PubMed] [Google Scholar]
- Kruger G, Glover GH. Physiological noise in oxygenation-sensitive magnetic resonance imaging. Magn Reson Med. 2001;46:631–637. doi: 10.1002/mrm.1240. [DOI] [PubMed] [Google Scholar]
- Lai S, Hopkins AL, Haacke EM, Li D, Wasserman BA, Buckley P, Friedman L, Meltzer H, Hedera P, Friedland R. Identification of vascular structures as a major source of signal contrast in high resolution 2D and 3D functional activation imaging of the motor cortex at 1.5T: preliminary results. Magn Reson Med. 1993;30:387–392. doi: 10.1002/mrm.1910300318. [DOI] [PubMed] [Google Scholar]
- Larkman DJ, Hajnal JV, Herlihy AH, Coutts GA, Young IR, Ehnholm G. Use of multicoil arrays for separation of signal from multiple slices simultaneously excited. J Magn Reson Imaging. 2001;13:313–317. doi: 10.1002/1522-2586(200102)13:2<313::aid-jmri1045>3.0.co;2-w. [DOI] [PubMed] [Google Scholar]
- Larsson EG, Erdogmus D, Yan R, Principe JC, Fitzsimmons JR. SNR-optimality of sum-of-squares reconstruction for phased-array magnetic resonance imaging. J Magn Reson. 2003;163:121–123. doi: 10.1016/s1090-7807(03)00132-0. [DOI] [PubMed] [Google Scholar]
- Lazar M, Weinstein DM, Tsuruda JS, Hasan KM, Arfanakis K, Meyerand ME, Badie B, Rowley HA, Haughton V, Field A, Alexander AL. White matter tractography using diffusion tensor deflection. Hum Brain Mapp. 2003;18:306–321. doi: 10.1002/hbm.10102. [DOI] [PMC free article] [PubMed] [Google Scholar]
- Lenglet C, Sapiro G, Yacoub E, Duarte-Carvajalino JM, Xu J, Ugurbil K, Carin L, Moeller S. Estimation of the CSA-ODF using Bayesian Compressed Sensing of Multi- shell HARDI. 2013. In review. [DOI] [PMC free article] [PubMed] [Google Scholar]
- Liu G, Sobering G, Duyn J, Moonen CT. A functional MRI technique combining principles of echo-shifting with a train of observations (PRESTO) Magn Reson Med. 1993;30:764–768. doi: 10.1002/mrm.1910300617. [DOI] [PubMed] [Google Scholar]
- Ma C, Xu D, King KF, Liang ZP. Joint design of spoke trajectories and RF pulses for parallel excitation. Magn Reson Med. 2011;65:973–985. doi: 10.1002/mrm.22676. [DOI] [PubMed] [Google Scholar]
- Mansfield P. Real-time echo-planar imaging by NMR. British medical bulletin. 1984;40:187–190. doi: 10.1093/oxfordjournals.bmb.a071970. [DOI] [PubMed] [Google Scholar]
- Mansfield P, Harvey PR, Stehling MK. Echo-volumar imaging. MAGMA. 1994;2:291–294. [Google Scholar]
- Mars RB, Jbabdi S, Sallet J, O’Reilly JX, Croxson PL, Olivier E, Noonan MP, Bergmann C, Mitchell AS, Baxter MG, Behrens TE, Johansen-Berg H, Tomassini V, Miller KL, Rushworth MF. Diffusion-weighted imaging tractography-based parcellation of the human parietal cortex and comparison with human and macaque resting-state functional connectivity. J Neurosci. 2011;31:4087–4100. doi: 10.1523/JNEUROSCI.5102-10.2011. [DOI] [PMC free article] [PubMed] [Google Scholar]
- Mattiello J, Basser PJ, Le Bihan D. The b matrix in diffusion tensor echo-planar imaging. Magn Reson Med. 1997;37:292–300. doi: 10.1002/mrm.1910370226. [DOI] [PubMed] [Google Scholar]
- Menon RS, Ogawa S, Strupp JP, Ugurbil K. Ocular dominance in human V1 demonstrated by functional magnetic resonance imaging. J Neurophysiol. 1997;77:2780–2787. doi: 10.1152/jn.1997.77.5.2780. [DOI] [PubMed] [Google Scholar]
- Menon RS, Ogawa S, Tank DW, Ugurbil K. 4 Tesla gradient recalled echo characteristics of photic stimulation- induced signal changes in the human primary visual cortex. Magn Reson Med. 1993;30:380–386. doi: 10.1002/mrm.1910300317. [DOI] [PubMed] [Google Scholar]
- Menzel MI, Tan ET, Khare K, Sperl JI, King KF, Tao X, Hardy CJ, Marinelli L. Accelerated diffusion spectrum imaging in the human brain using compressed sensing. Magn Reson Med. 66:1226–1233. doi: 10.1002/mrm.23064. [DOI] [PubMed] [Google Scholar]
- Merlet S. Spherical polar Fourier EAP and ODF Reconstruction via compressed sensing in diffusion MRI. IEEE Int. Symp. Biomedical Imaging; Chicago. 2011. pp. 365–371. [Google Scholar]
- Metzger GJ, Snyder C, Akgun C, Vaughan T, Ugurbil K, Van de Moortele PF. Local B1+ shimming for prostate imaging with transceiver arrays at 7T based on subject-dependent transmit phase measurements. Magn Reson Med. 2008;59:396–409. doi: 10.1002/mrm.21476. [DOI] [PMC free article] [PubMed] [Google Scholar]
- Michailovich O, Rathi Y, Dolui S. Spatially regularized compressed sensing of diffusion MRI data. IEEE Transactions on Medical Imaging. 2011;30:1100–1115. doi: 10.1109/TMI.2011.2142189. [DOI] [PMC free article] [PubMed] [Google Scholar]
- Mitra PP, Ogawa S, Hu X, Ugurbil K. The nature of spatiotemporal changes in cerebral hemodynamics as manifested in functional magnetic resonance imaging. Magn Reson Med. 1997;37:511–518. doi: 10.1002/mrm.1910370407. [DOI] [PubMed] [Google Scholar]
- Moeller S, Auerbach E, van de Moortele PF, Adriany G, Ugurbil K. fMRI with 16 fold reduction using multibanded multislice sampling. Proc Int Soc Mag Reson Med. 2008;16:2366. [Google Scholar]
- Moeller S, Auerbach EJ, Xu J, Lenglet C, Ugurbil K, Yacoub E. Dynamic multiband calibration for improved signal fidelity. Proc Int Soc Mag Reson Med. 2013;21:2661. [Google Scholar]
- Moeller S, Xu J, Auerbach EJ, Yacoub E, Ugurbil K. Signal Leakage(L-factor) as a measure for parallel imaging performance among simultaneously multi-Slice (SMS) excited and acquired signals. Proc Int Soc Mag Reson Med. 2012;20:519. [Google Scholar]
- Moeller S, Yacoub E, Olman CA, Auerbach E, Strupp J, Harel N, Ugurbil K. Multiband multislice GE-EPI at 7 tesla, with 16-fold acceleration using partial parallel imaging with application to high spatial and temporal whole-brain fMRI. Magn Reson Med. 2010;63:1144–1153. doi: 10.1002/mrm.22361. [DOI] [PMC free article] [PubMed] [Google Scholar]
- Mori S, Zhang J. Principles of diffusion tensor imaging and its applications to basic neuroscience research. Neuron. 2006;51:527–539. doi: 10.1016/j.neuron.2006.08.012. [DOI] [PubMed] [Google Scholar]
- Muller S. Multifrequency selective rf pulses for multislice MR imaging. Magn Reson Med. 1988;6:364–371. doi: 10.1002/mrm.1910060315. [DOI] [PubMed] [Google Scholar]
- Nelson SM, Cohen AL, Power JD, Wig GS, Miezin FM, Wheeler ME, Velanova K, Donaldson DI, Phillips JS, Schlaggar BL, Petersen SE. A parcellation scheme for human left lateral parietal cortex. Neuron. 2010;67:156–170. doi: 10.1016/j.neuron.2010.05.025. [DOI] [PMC free article] [PubMed] [Google Scholar]
- Norris DG, Koopmans PJ, Boyacioglu R, Barth M. Power Independent of Number of Slices (PINS) radiofrequency pulses for low-power simultaneous multislice excitation. Magn Reson Med. 2011;66:1234–1240. doi: 10.1002/mrm.23152. [DOI] [PubMed] [Google Scholar]
- Nunes RG, Hajnal JV, Golay X, Larkman DJ. Simultaneous slice excitation and reconstruction for single shot EPI. Proc Int Soc Mag Reson Med. 2006;14:293. [Google Scholar]
- Ogawa S, Menon RS, Tank DW, Kim SG, Merkle H, Ellermann JM, Ugurbil K. Functional brain mapping by blood oxygenation level-dependent contrast magnetic resonance imaging. A comparison of signal characteristics with a biophysical model. Biophys J. 1993;64:803–812. doi: 10.1016/S0006-3495(93)81441-3. [DOI] [PMC free article] [PubMed] [Google Scholar]
- Ohliger MA, Grant AK, Sodickson DK. Ultimate intrinsic signal-to-noise ratio for parallel MRI: electromagnetic field considerations. Magn Reson Med. 2003;50:1018–1030. doi: 10.1002/mrm.10597. [DOI] [PubMed] [Google Scholar]
- Olman CA, Harel N, Feinberg DA, He S, Zhang P, Ugurbil K, Yacoub E. Layer-specific fMRI reflects different neuronal computations at different depths in human V1. PLoS ONE. 2012;7:e32536. doi: 10.1371/journal.pone.0032536. [DOI] [PMC free article] [PubMed] [Google Scholar]
- Panagiotaki E, Schneider T, Siow B, Hall MG, Lythgoe MF, Alexander DC. Compartment models of the diffusion MR signal in brain white matter: a taxonomy and comparison. Neuroimage. 2012;59:2241–2254. doi: 10.1016/j.neuroimage.2011.09.081. [DOI] [PubMed] [Google Scholar]
- Parkes LM, Schwarzbach JV, Bouts AA, Deckers RH, Pullens P, Kerskens CM, Norris DG. Quantifying the spatial resolution of the gradient echo and spin echo BOLD response at 3 Tesla. Magn Reson Med. 2005;54:1465–1472. doi: 10.1002/mrm.20712. [DOI] [PubMed] [Google Scholar]
- Pfeuffer J, Van De Moortele PF, Ugurbil K, Hu X, Glover GH. Correction of physiologically induced global off-resonance effects in dynamic echo-planar and spiral functional imaging. Magn Reson Med. 2002;47:344–353. doi: 10.1002/mrm.10065. [DOI] [PubMed] [Google Scholar]
- Polimeni JR, Fischl B, Greve DN, Wald LL. Laminar analysis of 7T BOLD using an imposed spatial activation pattern in human V1. Neuroimage. 2010;52:1334–1346. doi: 10.1016/j.neuroimage.2010.05.005. [DOI] [PMC free article] [PubMed] [Google Scholar]
- Polimeni JR, Wiggins GC, Wald LL. Characterization of artifacts and noise enhancement introduced by GRAPPA reconstructions. Proc Int Soc Mag Reson Med. 2008;16:1286. [Google Scholar]
- Poser BA, Koopmans PJ, Witzel T, Wald LL, Barth M. Three dimensional echo-planar imaging at 7 Tesla. Neuroimage. 2010;51:261–266. doi: 10.1016/j.neuroimage.2010.01.108. [DOI] [PMC free article] [PubMed] [Google Scholar]
- Power JD, Cohen AL, Nelson SM, Wig GS, Barnes KA, Church JA, Vogel AC, Laumann TO, Miezin FM, Schlaggar BL, Petersen SE. Functional network organization of the human brain. Neuron. 2011;72:665–678. doi: 10.1016/j.neuron.2011.09.006. [DOI] [PMC free article] [PubMed] [Google Scholar]
- Pruessmann KP, Weiger M, Scheidegger MB, Boesiger P. SENSE: sensitivity encoding for fast MRI. Magn Reson Med. 1999;42:952–962. [PubMed] [Google Scholar]
- Yogesh R, Michailovich O, Setsompop K, Bouix S, Shenton ME, Westin C-F. Sparse Multi-Shell Diffusion Imaging. Med Image Comput Comput Assist Interv. 2011;14:58–65. doi: 10.1007/978-3-642-23629-7_8. [DOI] [PMC free article] [PubMed] [Google Scholar]
- Reese TG, Benner T, Wang R, Feinberg DA, Wedeen VJ. Halving imaging time of whole brain diffusion spectrum imaging and diffusion tractography using simultaneous image refocusing in EPI. J Magn Reson Imaging. 2009;29:517–522. doi: 10.1002/jmri.21497. [DOI] [PMC free article] [PubMed] [Google Scholar]
- Reese TG, Heid O, Weisskoff RM, Wedeen VJ. Reduction of eddy-current-induced distortion in diffusion MRI using a twice-refocused spin echo. Magn Reson Med. 2003;49:177–182. doi: 10.1002/mrm.10308. [DOI] [PubMed] [Google Scholar]
- Roemer PB, Edelstein WA, Hayes CE, Souza SP, Mueller OM. The NMR Phased Array. Magn Reson Med. 1990;16:192–225. doi: 10.1002/mrm.1910160203. [DOI] [PubMed] [Google Scholar]
- Ronen I, Ugurbil K, Kim DS. How does DWI correlate with white matter structures? Magn Reson Med. 2005;54:317–323. doi: 10.1002/mrm.20542. [DOI] [PubMed] [Google Scholar]
- Rooney WD, Johnson G, Li X, Cohen ER, Kim SG, Ugurbil K, Springer CS., Jr Magnetic field and tissue dependencies of human brain longitudinal 1H2O relaxation in vivo. Magn Reson Med. 2007;57:308–318. doi: 10.1002/mrm.21122. [DOI] [PubMed] [Google Scholar]
- Sanchez-Panchuelo RM, Francis S, Bowtell R, Schluppeck D. Mapping human somatosensory cortex in individual subjects with 7T functional MRI. J Neurophysiol. 2010;103:2544–2556. doi: 10.1152/jn.01017.2009. [DOI] [PMC free article] [PubMed] [Google Scholar]
- Setsompop K, Alagappan V, Gagoski BA, Potthast A, Hebrank F, Fontius U, Schmitt F, Wald LL, Adalsteinsson E. Broadband slab selection with B1+ mitigation at 7T via parallel spectral-spatial excitation. Magn Reson Med. 2009;61:493–500. doi: 10.1002/mrm.21834. [DOI] [PMC free article] [PubMed] [Google Scholar]
- Setsompop K, Gagoski BA, Polimeni J, Witzel T, Wedeen VJ, Wald LL. Blipped CAIPIRINHA for simultaneous multi-slice EPI with reduced g-factor penalty. Proc Int Soc Mag Reson Med. 2010;18:551. doi: 10.1002/mrm.23097. [DOI] [PMC free article] [PubMed] [Google Scholar]
- Setsompop K, Gagoski BA, Polimeni JR, Witzel T, Wedeen VJ, Wald LL. Blipped-controlled aliasing in parallel imaging for simultaneous multislice echo planar imaging with reduced g-factor penalty. Magn Reson Med. 2012;67:1210–1224. doi: 10.1002/mrm.23097. [DOI] [PMC free article] [PubMed] [Google Scholar]
- Shmuel A, Yacoub E, Chaimow D, Logothetis NK, Ugurbil K. Spatio-temporal point-spread function of fMRI signal in human gray matter at 7 Tesla. Neuroimage. 2007;35:539–552. doi: 10.1016/j.neuroimage.2006.12.030. [DOI] [PMC free article] [PubMed] [Google Scholar]
- Shmueli K, van Gelderen P, de Zwart JA, Horovitz SG, Fukunaga M, Jansma JM, Duyn JH. Low-frequency fluctuations in the cardiac rate as a source of variance in the resting-state fMRI BOLD signal. Neuroimage. 2007;38:306–320. doi: 10.1016/j.neuroimage.2007.07.037. [DOI] [PMC free article] [PubMed] [Google Scholar]
- Smith SM, Anderson J, Auerbach EJ, Beckmann CF, Bijsterbosch J, Bijsterbosch J, Douaud G, Duff E, Feinberg DA, Griffanti L, Harms M, Kelly M, Laumann T, Miller KL, Moeller S, Petersen S, Power J, Salimi-Khorshidi G, Snyder AZ, Vu A, Woolrich MW, Xu J, Yacoub E, Ugurbil K, Van Essen DV, Glasser MF Consortium, f.t.W.-MH. Resting State fMRI in the Human Connectome Project. Neuroimage. 2013 doi: 10.1016/j.neuroimage.2013.05.039. In press, NeuroImage Special Issue “Mapping the Connectome”. [DOI] [PMC free article] [PubMed] [Google Scholar]
- Smith SM, Miller KL, Salimi-Khorshidi G, Webster M, Beckmann CF, Nichols TE, Ramsey JD, Woolrich MW. Network modelling methods for FMRI. Neuroimage. 2011;54:875–891. doi: 10.1016/j.neuroimage.2010.08.063. [DOI] [PubMed] [Google Scholar]
- Snyder CJ, DelaBarre L, Metzger GJ, van de Moortele PF, Akgun C, Ugurbil K, Vaughan JT. Initial results of cardiac imaging at 7 Tesla. Magn Reson Med. 2009;61:517–524. doi: 10.1002/mrm.21895. [DOI] [PMC free article] [PubMed] [Google Scholar]
- Sodickson DK, Manning WJ. Simultaneous acquisition of spatial harmonics (SMASH): fast imaging with radiofrequency coil arrays. Magn Reson Med. 1997;38:591–603. doi: 10.1002/mrm.1910380414. [DOI] [PubMed] [Google Scholar]
- Sotiropoulos SN, Jbabdi S, Xu J, Andersson JL, Moeller S, Auerbach EJ, Glasser MF, Hernandez M, Sapiro G, Jenkinson M, Feinberg DF, Yacoub E, Lenglet C, Van Essen DC, Ugurbil K, Behrens TEJ for the WU-Minn HCP Consortium. Advances in diffusion MRI acquisition and processing in the Human Connectome Project. Neuroimage. 2013a doi: 10.1016/j.neuroimage.2013.05.057. In press, NeuroImage Special Issue “Mapping the Connectome”. [DOI] [PMC free article] [PubMed] [Google Scholar]
- Sotiropoulos SN, Moeller S, Jbabdi S, Xu J, Andersson JL, Auerbach EJ, Yacoub E, Feinberg D, Setsompop K, Wald LL, Behrens TE, Ugurbil K, Lenglet C. Effects of image reconstruction on fibre orientation mapping from multichannel diffusion MRI: Reducing the noise floor using SENSE. Magn Reson Med. 2013b doi: 10.1002/mrm.24623. [DOI] [PMC free article] [PubMed] [Google Scholar]
- Stanisz GJ, Odrobina EE, Pun J, Escaravage M, Graham SJ, Bronskill MJ, Henkelman RM. T1, T2 relaxation and magnetization transfer in tissue at 3T. Magn Reson Med. 2005;54:507–512. doi: 10.1002/mrm.20605. [DOI] [PubMed] [Google Scholar]
- Stejskal EO, Tanner JE. Spin diffusion measuremnts: spin-echoes in the presence of a time dependent field gradient. J Chem Phys. 1965;42:288–292. [Google Scholar]
- Stringer EA, Chen LM, Friedman RM, Gatenby C, Gore JC. Differentiation of somatosensory cortices by high-resolution fMRI at 7 T. Neuroimage. 2011;54:1012–1020. doi: 10.1016/j.neuroimage.2010.09.058. [DOI] [PMC free article] [PubMed] [Google Scholar]
- Suttie JJ, Delabarre L, Pitcher A, van de Moortele PF, Dass S, Snyder CJ, Francis JM, Metzger GJ, Weale P, Ugurbil K, Neubauer S, Robson M, Vaughan T. 7 Tesla (T) human cardiovascular magnetic resonance imaging using FLASH and SSFP to assess cardiac function: validation against 1.5 T and 3 T. NMR Biomed. 2012;25:27–34. doi: 10.1002/nbm.1708. [DOI] [PMC free article] [PubMed] [Google Scholar]
- Triantafyllou C, Hoge RD, Krueger G, Wiggins CJ, Potthast A, Wiggins GC, Wald LL. Comparison of physiological noise at 1.5 T, 3 T and 7 T and optimization of fMRI acquisition parameters. Neuroimage. 2005;26:243–250. doi: 10.1016/j.neuroimage.2005.01.007. [DOI] [PubMed] [Google Scholar]
- Triantafyllou C, Polimeni JR, Wald LL. Physiological noise and signal-to-noise ratio in fMRI with multi-channel array coils. Neuroimage. 2011;55:597–606. doi: 10.1016/j.neuroimage.2010.11.084. [DOI] [PMC free article] [PubMed] [Google Scholar]
- Tuch DS, Reese TG, Wiegell MR, Makris N, Belliveau JW, Wedeen VJ. High angular resolution diffusion imaging reveals intravoxel white matter fiber heterogeneity. Magn Reson Med. 2002;48:577–582. doi: 10.1002/mrm.10268. [DOI] [PubMed] [Google Scholar]
- Ugurbil K. Encyclopedia of Magnetic Resonance. John Wiley & Sons; 2011. A journey toward functional brain imaging and ultrahigh field magnetic resonance in humans. [Google Scholar]
- Ugurbil K. The road to functional imaging and ultrahigh fields. Neuroimage. 2012;62:726–735. doi: 10.1016/j.neuroimage.2012.01.134. [DOI] [PMC free article] [PubMed] [Google Scholar]
- Ugurbil K, Adriany G, Andersen P, Chen W, Garwood M, Gruetter R, Henry PG, Kim SG, Lieu H, Tkac I, Vaughan T, Van De Moortele PF, Yacoub E, Zhu XH. Ultrahigh field magnetic resonance imaging and spectroscopy. Magn Reson Imaging. 2003a;21:1263–1281. doi: 10.1016/j.mri.2003.08.027. [DOI] [PubMed] [Google Scholar]
- Ugurbil K, Toth L, Kim DS. How accurate is magnetic resonance imaging of brain function? Trends Neurosci. 2003b;26:108–114. doi: 10.1016/S0166-2236(02)00039-5. [DOI] [PubMed] [Google Scholar]
- Uludag K, Muller-Bierl B, Ugurbil K. An integrative model for neuronal activity-induced signal changes for gradient and spin echo functional imaging. Neuroimage. 2009;48:150–165. doi: 10.1016/j.neuroimage.2009.05.051. [DOI] [PubMed] [Google Scholar]
- Van de Moortele PF, Akgun C, Adriany G, Moeller S, Ritter J, Collins CM, Smith MB, Vaughan JT, Ugurbil K. B(1) destructive interferences and spatial phase patterns at 7 T with a head transceiver array coil. Magn Reson Med. 2005;54:1503–1518. doi: 10.1002/mrm.20708. [DOI] [PubMed] [Google Scholar]
- Van De Moortele PF, Pfeuffer J, Glover GH, Ugurbil K, Hu X. Respiration-induced B0 fluctuations and their spatial distribution in the human brain at 7 Tesla. Magn Reson Med. 2002;47:888–895. doi: 10.1002/mrm.10145. [DOI] [PubMed] [Google Scholar]
- van den Heuvel MP, Stam CJ, Kahn RS, Hulshoff Pol HE. Efficiency of functional brain networks and intellectual performance. J Neurosci. 2009;29:7619–7624. doi: 10.1523/JNEUROSCI.1443-09.2009. [DOI] [PMC free article] [PubMed] [Google Scholar]
- Van Essen DC, Jbabdi S, Sotiropoulos SN, Chen C, Dikranian K, Coalson T, John Harwell J, Behrens TEJ, Glasser MF. Diffusion MRI. 2 2013a. Mapping Connections in Humans and Nonhuman Primates: Aspirations and Challenges for Diffusion Imaging. [Google Scholar]
- Van Essen DC, Smith SM, Barch D, Behrens TEJ, Yacoub E, Ugurbi K. The WU-Minn Human Connectome Project: An Overview. Neuroimage. 2013b doi: 10.1016/j.neuroimage.2013.05.041. This Issue. [DOI] [PMC free article] [PubMed] [Google Scholar]
- Vaughan JT, Garwood M, Collins CM, Liu W, DelaBarre L, Adriany G, Andersen P, Merkle H, Goebel R, Smith MB, Ugurbil K. 7T vs. 4T: RF power, homogeneity, and signal-to-noise comparison in head images. Magn Reson Med. 2001;46:24–30. doi: 10.1002/mrm.1156. [DOI] [PubMed] [Google Scholar]
- Vaughan T, DelaBarre L, Snyder C, Tian J, Akgun C, Shrivastava D, Liu W, Olson C, Adriany G, Strupp J, Andersen P, Gopinath A, van de Moortele PF, Garwood M, Ugurbil K. 9.4T human MRI: preliminary results. Magn Reson Med. 2006;56:1274–1282. doi: 10.1002/mrm.21073. [DOI] [PMC free article] [PubMed] [Google Scholar]
- Vincent JL, Patel GH, Fox MD, Snyder AZ, Baker JT, Van Essen DC, Zempel JM, Snyder LH, Corbetta M, Raichle ME. Intrinsic functional architecture in the anaesthetized monkey brain. Nature. 2007;447:83–86. doi: 10.1038/nature05758. [DOI] [PubMed] [Google Scholar]
- Wansapura JP, Holland SK, Dunn RS, Ball WS., Jr NMR relaxation times in the human brain at 3.0 tesla. J Magn Reson Imaging. 1999;9:531–538. doi: 10.1002/(sici)1522-2586(199904)9:4<531::aid-jmri4>3.0.co;2-l. [DOI] [PubMed] [Google Scholar]
- Wedeen VJ, Hagmann P, Tseng WY, Reese TG, Weisskoff RM. Mapping complex tissue architecture with diffusion spectrum magnetic resonance imaging. Magn Reson Med. 2005;54:1377–1386. doi: 10.1002/mrm.20642. [DOI] [PubMed] [Google Scholar]
- White N, Roddey C, Shankaranarayanan A, Han E, Rettmann D, Santos J, Kuperman J, Dale A. PROMO: Real-time prospective motion correction in MRI using image-based tracking. Magn Reson Med. 2010;63:91–105. doi: 10.1002/mrm.22176. [DOI] [PMC free article] [PubMed] [Google Scholar]
- Wielopolski PA, Manning WJ, Edelman RR. Single breath-hold volumetric imaging of the heart using magnetization-prepared 3-dimensional segmented echo planar imaging. J Magn Reson Imaging. 1995;5:403–409. doi: 10.1002/jmri.1880050406. [DOI] [PubMed] [Google Scholar]
- Wiesinger F, Van de Moortele PF, Adriany G, De Zanche N, Ugurbil K, Pruessmann KP. Parallel imaging performance as a function of field strength--an experimental investigation using electrodynamic scaling. Magn Reson Med. 2004;52:953–964. doi: 10.1002/mrm.20281. [DOI] [PubMed] [Google Scholar]
- Wu X, Schmitter S, Auerbach AJ, Moeller S, Ugurbil K, Van de Moortele P-F. Simultaneous multi-slice parallel RF excitation with independent slice-specific transmit B1 homogenization. 2013a. In Revision. [DOI] [PMC free article] [PubMed] [Google Scholar]
- Wu X, Schmitter S, Auerbach AJ, Moeller S, Ugurbil K, Van de Moortele PF. Simultaneous multi-slice parallel RF excitation with independent slice-specific transmit B1 homogenization. Proc Int Soc Mag Reson Med. 2013b;21:74. doi: 10.1002/mrm.24828. [DOI] [PMC free article] [PubMed] [Google Scholar]
- Xu J, Moeller S, Strupp J, Auerbach E, Chen L, Feinberg D, Ugurbil K, Yacoub E. Highly accelerated whole brain functional imaging using k-space center aligned blipped controlled-aliasing multiband echo planar imaging. 2012a. In revison. [Google Scholar]
- Xu J, Moeller S, Strupp J, Auerbach E, Chen L, Feinberg D, Ugurbil K, Yacoub E. Highly accelerated whole Brain Imaging Using Aligned-Blipped-Controlled Aliasing Multiband EPI. Proc Int Soc Mag Reson Med. 2012b;20:2306. [Google Scholar]
- Yacoub E, Duong TQ, Van De Moortele PF, Lindquist M, Adriany G, Kim SG, Ugurbil K, Hu X. Spin-echo fMRI in humans using high spatial resolutions and high magnetic fields. Magn Reson Med. 2003;49:655–664. doi: 10.1002/mrm.10433. [DOI] [PubMed] [Google Scholar]
- Yacoub E, Harel N, Ugurbil K. High-field fMRI unveils orientation columns in humans. Proc Natl Acad Sci U S A. 2008;105:10607–10612. doi: 10.1073/pnas.0804110105. [DOI] [PMC free article] [PubMed] [Google Scholar]
- Yacoub E, Shmuel A, Logothetis N, Ugurbil K. Robust detection of ocular dominance columns in humans using Hahn Spin Echo BOLD functional MRI at 7 Tesla. Neuroimage. 2007;37:1161–1177. doi: 10.1016/j.neuroimage.2007.05.020. [DOI] [PMC free article] [PubMed] [Google Scholar]
- Yacoub E, Van De Moortele PF, Shmuel A, Ugurbil K. Signal and noise characteristics of Hahn SE and GE BOLD fMRI at 7 T in humans. Neuroimage. 2005;24:738–750. doi: 10.1016/j.neuroimage.2004.09.002. [DOI] [PubMed] [Google Scholar]
- Yang QX, Wang J, Zhang X, Collins CM, Smith MB, Liu H, Zhu XH, Vaughan JT, Ugurbil K, Chen W. Analysis of wave behavior in lossy dielectric samples at high field. Magn Reson Med. 2002;47:982–989. doi: 10.1002/mrm.10137. [DOI] [PubMed] [Google Scholar]
- Yeo BT, Krienen FM, Sepulcre J, Sabuncu MR, Lashkari D, Hollinshead M, Roffman JL, Smoller JW, Zollei L, Polimeni JR, Fischl B, Liu H, Buckner RL. The organization of the human cerebral cortex estimated by intrinsic functional connectivity. J Neurophysiol. 2011;106:1125–1165. doi: 10.1152/jn.00338.2011. [DOI] [PMC free article] [PubMed] [Google Scholar]
- Zaitsev M, Dold C, Sakas G, Hennig J, Speck O. Magnetic resonance imaging of freely moving objects: prospective real-time motion correction using an external optical motion tracking system. Neuroimage. 2006;31:1038–1050. doi: 10.1016/j.neuroimage.2006.01.039. [DOI] [PubMed] [Google Scholar]
- Zelinski AC, Wald LL, Setsompop K, Alagappan V, Gagoski BA, Goyal VK, Adalsteinsson E. Fast slice-selective radio-frequency excitation pulses for mitigating B+1 inhomogeneity in the human brain at 7 Tesla. Magn Reson Med. 2008;59:1355–1364. doi: 10.1002/mrm.21585. [DOI] [PMC free article] [PubMed] [Google Scholar]
- Zhan L, Mueller BA, Jahanshad N, Jin Y, Lenglet C, Yacoub E, Sapiro G, Ugurbil K, Harel N, Toga A, Lim KO, Thompson P. MR Field Strength Effects on Diffusion Measures and Brain Connectivity Networks. Brain Connect. 2012 doi: 10.1089/brain.2012.0114. [DOI] [PMC free article] [PubMed] [Google Scholar]
- Zhang Z, Yip CY, Grissom W, Noll DC, Boada FE, Stenger VA. Reduction of transmitter B1 inhomogeneity with transmit SENSE slice-select pulses. Magn Reson Med. 2007;57:842–847. doi: 10.1002/mrm.21221. [DOI] [PMC free article] [PubMed] [Google Scholar]
- Zimmermann J, Goebel R, De Martino F, van de Moortele PF, Feinberg D, Adriany G, Chaimow D, Shmuel A, Ugurbil K, Yacoub E. Mapping the organization of axis of motion selective features in human area MT using high-field fMRI. PLoS ONE. 2011;6:e28716. doi: 10.1371/journal.pone.0028716. [DOI] [PMC free article] [PubMed] [Google Scholar]