

Abstract
Background
Raising cigarette prices through taxation is an important policy approach to reducing smoking. Yet, cigarette price increases may not be equally effective in all subpopulations of smokers.
Purpose
To examine differing effects of state cigarette price changes with individual changes in smoking among smokers of different intensity levels.
Methods
Data were derived from the National Epidemiologic Survey on Alcohol and Related Conditions (NESARC), a nationally representative sample of U.S. adults originally interviewed in 2001 to 2002 (Wave 1) and re-interviewed in 2004 to 2005 (Wave 2): 34,653 were re-interviewed in Wave 2, and 7,068 smokers defined at Wave 1 were included in our study. Mixed effects linear regression models were used to assess whether the effects of changes in state cigarette prices on changes in daily smoking behavior differed by level of daily smoking.
Results
In the multivariable model, there was a significant interaction between change in price per pack of cigarettes from Wave 1 to Wave 2 and the number of cigarettes smoked per day (p=.044). The more cigarettes smoked per day at baseline, the more responsive the smokers were to increases in price per pack of cigarettes (i.e., number of cigarettes smoked per day was reduced in response to price increases).
Conclusions
Our findings that heavier smokers successfully and substantially reduced their cigarette smoking behaviors in response to state cigarette price increases provide fresh insight to the evidence on the effectiveness of higher cigarette prices in reducing smoking.
Keywords: Smoking/epidemiology, Smoking/prevention & control, Tobacco Industry/economics, State Government
INTRODUCTION
Over a hundred studies from high-income countries have consistently demonstrated that higher cigarette prices curtail smoking behaviors. [1] Specifically, increases in cigarette prices reduce smoking via a combination of reduced rates of smoking relapse, decreased cigarette consumption, increased smoking cessation, and lowered initiation of smoking. The public health benefits of raising cigarette taxes are apparent. Accordingly, tobacco control advocates concur that raising cigarette prices through taxation is an important policy approach to reducing smoking. [2]
Although we have made considerable progress in understanding the effects of cigarette tax increases, there is still much to be learned about the characteristics of smokers who are responsive to tax changes and those who are not. Though relatively few, existing studies suggest that cigarette taxes have varying effects across different levels of smoking intensity. Two studies of youth smokers found that higher cigarette prices had the most pronounced effect on heavier smoking levels. [3, 4] In contrast, in the one known study examining the differential effects of cigarette taxes on adult smoking behavior, higher cigarette prices had a greater impact on lighter smoking levels. [5] Given these conflicting findings, more research is needed to determine whether subgroups of smokers are equally responsive to changes in cigarette prices. In response, the present study extends our knowledge about policy effects on smoking by examining differing effects of state cigarette price changes with individual changes in smoking among smokers of different intensity levels. Such knowledge offers an important contribution to understanding the effectiveness of higher prices in reducing smoking.
METHODS
Data source and respondents
The analyses presented in this study utilize existing data from the National Epidemiologic Study on Alcohol and Related Conditions (NESARC). [6] The purpose of the NESARC was to document data on the prevalence of alcohol and drug use, abuse, and dependence as well as associated psychiatric and other medical conditions in the US population. Under contract and supervised by the National Institute on Alcohol Abuse and Alcoholism (NIAAA), the US Census Bureau conducted face-to-face interviews with a multi-stage probability sample of adults ages 18 and older that is nationally representative. The NESARC is a longitudinal survey consisting of Wave 1 (N=43,093, 81% response rate), conducted from 2001–2002, and a 3-year follow-up interview with a response rate of 86.7% (N= 34,653). [7] Wave 1 respondents that were not eligible for Wave 2 interviews were either institutionalized, mentally/physically impaired, on active duty in the armed forces, deceased or deported (n=3,134). Some respondents were eligible but did not participate in Wave 2 interviewer (n=5,306) because they refused or because of the inability to reach or locate them. Data were weighted to adjust for nonresponse at the household and person levels, the selection of one person per household, and over-sampling of young adults, African-Americans, and Hispanics. A detailed description of the survey methods, other quality control procedures, and test–retest reliability tests has been documented. [8]
A number of key strengths prompted our use of the NESARC. The NESARC provides an accurate longitudinal snapshot of cigarette smokers that were followed over a period of time during a new era of tobacco control when an unprecedented number of states began raising their cigarette taxes. Related, in consideration of the relatively short time period between Waves 1 and 2 of the NESARC, it is unlikely that there were any relevant endogenous social changes that influenced the smoking landscape adding further support for our findings. Additional strengths of the NESARC include its large, representative, and randomly selected sample, high response rate, oversampling of previously under-represented groups in the population, and breadth of content especially regarding cigarette smoking behaviors. [8]
Inclusion criteria
In order for respondents’ data to be included in the statistical analyses, specific inclusion criteria were established. Only respondents who reported smoking at Wave 1 were included in the analysis (N=7,906). In addition, ultra-light smokers (on average <1 cigarette/day) were excluded from analysis (N=655) because of the reduced likelihood that they would respond to increases in cigarette taxes given their intermittent smoking behaviors[9] and very diverse patterns of change relative to the other intensity levels. Respondents with missing data for amount of cigarettes smoked at either Wave 1 or Wave 2 (n=164) or who had missing data for covariates (n=19) were excluded from the analysis. These inclusion criteria resulted in 7,068 respondents for analysis. A greater percentage of those with missing data, compared to those without missing data, were male (71.9% vs 52.7%, X2 18.5, p<.001), had more than a high school education (55.4% vs 44.5%, Χ2 5.5, p=.022), and were age 65 years or older (13.2% vs 7.0%, X2 35.2, p<.001). We also multiply imputed the number of cigarettes smoked daily at Wave 1 and Wave 2 for those with missing data. Due to a low percentage of respondents that had missing data and because results from multiply imputed data were similar to complete case analysis indicating no evidence of bias, we present here the complete case analysis results.
Dependent variable
The average number of cigarettes smoked per day at each wave was calculated using the items assessing the usual frequency when the respondents smoked in the past year (i.e., every day, 5–6 days/week, 3–4 days/week, 1–2 days/week, 2–3 days/month, once a month or less) and the usual quantity when they smoked. The change in the average number of cigarettes smoked per day between Wave 1 and Wave 2 was used as the dependent variable.
State-level independent variables
The primary state-level variable of interest was percent change in price per pack of cigarettes during the study period. Price per pack of cigarettes by state was retrieved from ImpacTeen State-Level Tobacco Legislative Database (http://impacteen.org/tobacco.htm, funded by the Robert Wood Johnson Foundation) and prices are inflation adjusted to April 2008 dollars. The state of residence is available for each participant of the NESARC; thus, state-level prices per pack of cigarettes can be matched with our person-level data. We used the percent change in cigarette price corresponding to the years in which each individual participant was surveyed in the NESARC (i.e., Wave 1 in 2001 and Wave 2 in 2004, Wave 1 in 2001 and Wave 2 in 2005, Wave 1 in 2002 and Wave 2 in 2004, or Wave 1 in 2002 and Wave 2 in 2005).
We examined smoke-free air policies using publically available data from a tobacco chart book (also retrieved from the ImpacTeen State-Level Tobacco Legislative Database) which measures 3 key policies - those covering private worksites, restaurants, and bars. For this rating system, there are 3 key levels for each policy that range from no restrictions to a complete ban. Scores were assigned ranging from 0 to 6 that represent the sum of a three point scale for each (0 for nothing, 1 for restrictions with less than a complete ban, and 2 for a complete ban). We used the change in smoke-free air policy score corresponding to the years in which the participant was surveyed for each Wave of the NESARC, as described above for percent change in cigarette prices.
Person-level independent variables
The primary person-level variable of interest was amount of daily smoking at Wave 1: the average number of cigarettes smoked per day at Wave 1, calculated from the items assessing the usual frequency when the respondents smoked in the past year and the usual quantity when smoked in the past year. This was treated as a continuous variable, centered at the average of 16 cigarettes per day. We chose to include other person-level covariates which may be associated with reducing smoking, including age, gender, race/ethnicity, level of education, income level marital status, current or recent (in last 12 months) pregnancy at Wave 2 (coded “no” for males), and presence of diagnosed co-morbidities in the 12 months prior to Wave 1 (including arteriosclerosis, hypertension, angina pectoris, tachycardia, myocardial infarction, other heart disease, cirrhosis or other forms of liver disease).
Statistical Analysis
Descriptive statistics for person-level variables were performed using SAS-callable SUDAAN version 9.0.1, a software program that uses methods such as Taylor series linearization to adjust for design effects of complex sample surveys like the NESARC. [10]
Mixed-effects linear regression models were used to examine the association of state- and person-level predictor variables with change in daily smoking between Wave 1 and Wave 2. Because SUDAAN does not have the capability of multi-level modeling, PROC MIXED in SAS version 9.2 (SAS Institute, Inc., Cary, NC) was used for the linear mixed-effects models. Fixed effects were included for state-level and person-level predictors, and random state-level intercepts were included to account for clustering within states. Empirical sandwich estimation was used for covariance computations. Person-level weights were normalized to have a mean of 1.0 and applied in the models. One-thousand sample bootstrap (PSU sampling with replacement) was used to re-estimate standard errors and corresponding p values for parameter estimates and account for NESARC sampling design features. First, each independent variable was assessed in bivariate analysis; then, the cross-level interaction of Wave 1 daily smoking amount and change in price per pack was assessed, while also allowing a random effect for Wave 1 smoking amount. The cross-level interaction allowed us to assess whether the effect of Wave 1 smoking amount on change in daily smoking over time differed by the state-level variable change in price per pack. Finally, all state- and person-level predictors were included in the multivariable model along with the cross-level interaction of Wave 1 smoking amount and cigarette price change. The mixed effects form of the model predicting change in # of cigarettes/day for smoker i in state j is shown below:
| (Change in # cigs/day)ij = | γ(intercept) + |
| Person-level fixed effects | γ (# cigs/day at Wave 1 centered)ij + |
| γ (female)ij+ | |
| γ (age 30–44)ij+ | |
| γ (age 45–64)ij+ | |
| γ (age ≥65)ij+ | |
| γ (African American)ij+ | |
| γ (Hispanic)ij+ | |
| γ (other race)ij+ | |
| γ (< high school)ij+ | |
| γ (>high school)ij+ | |
| γ (very low income)ij+ | |
| γ (low income)ij+ | |
| γ (divorced)ij+ | |
| γ (married)ij + | |
| γ (current/recent pregnancy at Wave 2)ij + | |
| γ (presence of comorbidities at Wave 1)ij + | |
| State-level fixed effects | γ (price change)j + |
| γ (indoor air score change)j + | |
| Cross-level interaction | γ (# cigs/day at Wave 1 centered)ij(price change)j + |
| Random effects | u0j + |
| u1j(# cigs/day at Wave 1)ij+ | |
| rij |
RESULTS
A total of 7,068 respondents reported smoking an average of ≥ 1 cigarettes a day within the past year at Wave 1. A slight majority (53%) of the respondents was male, and a large majority was Caucasian (75%). Additional demographics are presented in Table 1. Overall at Wave 1, the average number of cigarettes smoked per day was 16 (Table 2). This decreased to 14 cigarettes per day at Wave 2, with an average change over time of −2 cigarettes per day. Of our 7,068 smokers, 1,193 quit smoking by Wave 2 (weighted percent 16.3%).The quit rate was higher for smokers with lower consumptions levels and lower for those with higher consumption levels (1–5 cigarettes/day 31.3%, 6–10 cigarettes/day 18.2%, 11–20 cigarettes/day 11.2%, 21–30 cigarettes/day 11.4%, >30 cigarettes/day 10.8%; p<.001).
Table 1.
Demographics of smokers who had smoked in the past year at Wave 1 (N=7,068)
| Variable | n (weighted %) |
|---|---|
| Gender | |
| Male | 3,319 (52.7) |
| Female | 3,749 (47.3) |
|
| |
| Race | |
| White | 4,500 (75.4) |
| African American | 1,312 (10.4) |
| Hispanic | 938 (8.4) |
| Other | 318 (5.8) |
|
| |
| Age | |
| 18–29 years | 1,644 (26.5) |
| 30–44 years | 2,477 (34.8) |
| 45–64 years | 2,397(31.8) |
| ≥65 years | 550 (7.0) |
|
| |
| Marital status | |
| Not married | 1,845 (24.2) |
| Married/Living together | 3,151 (54.9) |
| Divorced/Widowed/Separated | 2,072 (20.9) |
|
| |
| Education level | |
| High school | 2,469 (36.3) |
| < High school | 1,407 (19.3) |
| > High school | 3,192 (44.5) |
|
| |
| Income level | |
| ≥ 40,000 | 2,814 (46.6) |
| $15,000 – 39,999 | 2,701 (36.6) |
| < $15,000 | 1,553 (16.9) |
|
| |
| Current/recent pregnancy at Wave 2 | 220 (2.8) |
|
| |
| Presence of co-morbidities at Wave 1a | 1,483 (18.7) |
Co-morbidities include arteriosclerosis, hypertension, angina pectoris, tachycardia, myocardial infarction, other heart disease, cirrhosis or other forms of liver disease.
Table 2.
Overall number of cigarettes smoked per day at Wave 1 and Wave 2, among current smokers at Wave 1
| Number of cigarettes smoked/day | Mean (SE) | Median (IQR) |
|---|---|---|
| At Wave 1 | 16.0 (0.2) | 15.6 (9.0, 19.4) |
| At Wave 2 | 13.9 (0.2) | 11.8 (3.9, 19.3) |
| Change | −2.2 (0.2) | −0.8 (−7.8, 0.6) |
SE=standard error; IQR=interquartile range
Figure 1 provides details on the changes in price per pack of cigarettes by state for the most common interview year combination of respondents (Wave 1 at 2001 and Wave 2 at 2004, 71% of the sample). The mean cigarette price per pack was $3.96 in 2001 and $4.41 in 2004 (inflation adjusted to 2008 dollars). The mean percent change in price per pack was 11 percent. The mean smoke-free indoor air policy score was 1.2 in 2001 and 1.8 in 2004, with a mean change of 0.6.
Figure 1.

Percent change in price per pack of cigarettes from 2001 to 2004
In bivariate analysis, number of cigarettes smoked daily at Wave 1 was significantly associated with change in daily smoking from Wave 1 to Wave 2: those who smoked to a greater degree had a greater reduction in daily smoking (β for one cigarette increase in Wave 1 daily smoking= − 0.41, SE 0.02, p<.001). For example, smoking 10 cigarettes/day at Wave 1 would be associated with a 4 cigarette/day decrease between Wave 1 and Wave 2, while smoking 20 cigarettes per day at Wave 1 would be associated with an 8 cigarette/day decrease between Wave 1 and Wave 2. Percent change in price per pack and the change in smoke-free indoor air policy score were not significantly associated with changes in daily smoking in bivariate analysis. Age, education level, marital status, current/recent pregnancy at Wave 2, and presence of co-morbidities at Wave 1 were all associated with change in smoking in bivariate analysis (results not shown).
Results of a model with only the main effects of percent change in price per pack of cigarettes, Wave 1 smoking amount, and the cross-level interaction of the two are presented in Table 3. The significant negative interaction indicates that the more a person smoked at Wave 1, the greater their reduction in smoking in response to increase in price per pack of cigarettes. Results from the multivariable model are also presented in Table 3. This model includes the main effects of change in price, Wave 1 smoking amount, the interaction of change in price and Wave 1 smoking amount, and adjusts for person-level covariates (age, race, gender, education, marital status, income, current/recent pregnancy at Wave 2, co-morbidities at Wave 1) and the state-level covariate change in smoke-free indoor air policy score.
Table 3.
Results predicting change in number of cigarettes smoked daily from Wave 1 to Wave 2
| Variable | β | SE | p |
|---|---|---|---|
|
Unadjusted results
| |||
| Intercept | −1.96 | 0.20 | <.001 |
| Percent change in price per pack | −0.02 | 0.02 | .343 |
| Number of cigarettes smoked at Wave 1a | −0.37 | 0.02 | <.001 |
| Percent change in price per pack*Number of cigarettes smoked at Wave 1a (interaction term) | −0.004 | 0.002 | .037 |
|
| |||
|
Adjusted results
| |||
| Intercept | −0.62 | 0.52 | .230 |
| Percent change in price per pack | −0.01 | 0.02 | .512 |
| Number of cigarettes smoked at Wave 1a | −0.42 | 0.03 | <.001 |
| Percent change in price per pack*Number of cigarettes smoked at Wave 1a (interaction term) | −0.004 | 0.002 | .044 |
| Change in smoke-free indoor air policy score | −0.21 | 0.16 | .189 |
| Gender (women vs men) | −1.50 | 0.32 | <.001 |
| Age | |||
| 18–29 years | Ref. | ||
| 30–44 years | 1.27 | 0.36 | <.001 |
| 45–64 years | 1.34 | 0.42 | .002 |
| ≥65 years | −1.78 | 0.68 | .008 |
| Race | |||
| Caucasian | Ref. | ||
| African American | −2.45 | 0.35 | <.001 |
| Hispanic | −3.78 | 0.42 | <.001 |
| Other | −1.29 | 0.73 | .078 |
| Education | |||
| Less than high school diploma | −0.19 | 0.44 | .670 |
| High school diploma | Ref. | ||
| More than high school diploma | −1.56 | 0.29 | <.001 |
| Income | |||
| <$15,000 | 0.33 | 0.44 | .464 |
| $15,000 – 39,999 | 0.01 | 0.33 | .985 |
| ≥ $40,000 | Ref. | ||
| Marital status | |||
| Not married | Ref. | ||
| Divorced/Separated/Widowed | 0.69 | 0.44 | .121 |
| Married/Living together | −0.13 | 0.39 | .737 |
| Current/recent pregnancy at Wave 2 (yes vs. no) | −2.58 | 0.79 | .001 |
| Presence of co-morbiditiesb at Wave 1 (yes vs. no) | 0.05 | 0.45 | .908 |
| Random effects | Variance | Z | p |
| Intercept (Level-2: state) | 0.619 | 2.12 | .017 |
| # cigarettes at Wave 1 slope | 0.008 | 2.28 | .011 |
| Level-1 | 90.791 | 58.99 | <.001 |
Centered at the average of 16 cigarettes/day
Co-morbidities include arteriosclerosis, hypertension, angina pectoris, tachycardia, myocardial infarction, other heart disease, cirrhosis or other forms of liver disease.
The interaction between cigarette price change and amount of smoking at Wave 1 remained significant even after adjusting for covariates. This finding indicates heavier smokers were more responsive to increases in price per pack (i.e., more cigarettes were reduced in response to increases in price per pack). As illustrated in Figure 2, the interaction shows the predicted change in number of cigarettes smoked by percent changes in price per pack of cigarettes for different levels of smoking, using the estimated predictor values from the model (see Figure footnote). As percent change in price per pack increases, the heavier smokers have a greater reduction in number of cigarettes smoked daily. For example, someone who smoked 40 cigarettes/day would be expected to reduce by 11 cigarettes/day with no change in price per pack, and by 14 cigarettes per day in response to a 35% increase in price. Related, someone who smoked 20 cigarettes/day would be expected to reduce by 2 cigarettes/day with no change in price per pack, but by 3 cigarettes/day in response to a 35% increase in price per pack. The association between increase in price per pack and change in daily smoking for the lighter smokers is negligible. For example, according to model results, someone who smoked 10 cigarettes/day would be expected to increase their daily smoking by about approximately 2 cigarettes/day, regardless of the change in price per pack.
Figure 2.
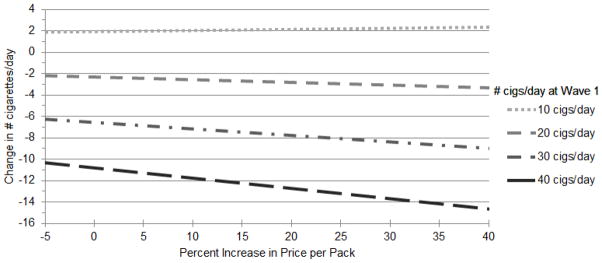
Predicted values of change in number of cigarettes smoked per day between Wave 1 and Wave 2 based on model results.
Equation used was: Change in # cigs/day = −0.62–0.01(percent change in price per pack) −0.42 (# cigs/day at Wave 1 centered at 16) − 0.004(# cigs/day at Wave 1 centered at 16) (percent change in price per pack). All other model predictors were kept at their reference values.
We also examined the relationship between percent change in price per pack and quitting smoking. For the outcome of quitting smoking, there was no significant association with percent change in price per pack and no significant interaction between change in price per pack and Wave 1 smoking amount (data not shown).
DISCUSSION
Using a large, nationally representative sample that was followed over a period of time during a new era of tobacco tax control, we found a significant interaction between change in price per cigarette pack and intensity level of cigarette smoker. Specifically, heavier cigarette smokers were more likely to reduce their daily smoking in response to increases in cigarette price changes.
Reduced smoking behaviors over the long-term have not been recommended as a desirable tobacco-control goal. [11, 12] However, a reduction in smoking behaviors has the major advantage of increasing the probability of subsequent quitting, especially when smoking reductions are at 50% of daily smoking or more. [11, 13–16] Therefore, a reduction in smoking behaviors has been recognized as a strategy to shift resistant smokers towards cessation. [11, 17, 18] As a result, our finding that heavier smokers reduce their daily smoking behaviors in response to increases in cigarette prices contributes novel information about a critical public health issue.
Heavier smokers report encouragement to quit smoking and it may be that an increase in cigarette prices further entices individuals who are already contemplating a decrease in smoking. [3,7] A reduction in smoking behaviors may be more of an issue for heavier smokers who tend to identify themselves as “smokers” more readily than lighter smokers and, consequently, receive more health messages about the significant health risks of cigarette smoking versus lighter smokers. [19] Or, our findings may be due to this already financially burdened subgroup of cigarette smokers (i.e., heavy smokers buy ≥ 25 individual cigarettes or one pack per day at minimum) becoming more motivated to reduce smoking behaviors following a hike in cigarette prices. Whatever the cause, our findings suggest that increases in state cigarette price increases may be an effective policy intervention for decreasing the cigarette smoking behaviors of heavier smokers who are highly susceptible to smoking-related health hazards and most resistant to smoking cessation and reduction.
Importantly, we also found that heavier smokers had substantial decreases in daily cigarette smoking in the absence of a price increase. This substantial decrease occurred even after controlling for the presence of diagnosed health problems at Wave 1 and recent pregnancy at Wave 2, both of which were associated with reductions in smoking in bivariate analysis. The dramatic reductions in daily smoking might be driven, at least in part, by heavier smokers’ desire to reduce the number of cigarettes they smoke per day. This could be because of their co-morbid health problems and/or advice from influential persons (e.g., doctors/friends/family) to try to quit and/or reduce smoking. Nevertheless, our findings corroborate existing population studies that document a trend in marked declines in the proportion of heavy smokers [20–23]. There is speculation that such changes are due to increased awareness of the adverse health effects of smoking along with strong tobacco control efforts. Exposure to anti-smoking media campaigns, increased access to cessation services, and receiving advice from physicians/friends/family to quit/reduce were not measured in our study but could be contributing to the larger decrease in smoking for those with higher daily cigarette use. Future research should work to determine the true cause of why some heavier smokers are reducing their cigarette intake in the absence of a price increase.
As a whole, the overall quit rate of our sample was high. The high quit rate average is largely driven by the lighter cigarette smokers quitting behaviors who more frequently reduced or quit their smoking in the absence of a price increase. Our findings support past evidence on the trajectories of light cigarette smokers who more often reduce their smoking or quit altogether over time; only a minority of light smokers go on to heavier smoking [24]. Note, light daily smokers who do continue smoking cigarettes eventually progress to higher and riskier levels of cigarette consumption as supported by our findings and existing literature [24]. However, change in price per cigarette pack had a negligible effect on lighter cigarette smokers.
Previous research has shown that smoke-free indoor air policies help to reduce overall cigarette consumption. [25, 26] We examined smoke-free indoor air policies in analysis (as a unique predictor and as an interaction with change in price per pack) because this state tobacco control activity is intended to restrict and discourage cigarette smoking. However, we found that change in smoke-free indoor air policy score was not significantly associated with changes in daily smoking. Our findings are in contrast to existing literature supporting the intended effects of smoke-free indoor air policies [25, 26] and may be due to few changes occurring in these policies during the study time period.
The findings of this study were limited by several factors. The NESARC does not provide information on potential explanatory variables that may motivate smokers to reduce or quit. Also, we relied on participants’ self-report of smoking in the past year and our analyses are subject to any biases introduced by retrospective recall. In addition, respondents may have underreported their cigarette use due to the social undesirability of smoking. We note that it is unlikely for underreporting of smoking behaviors to have changed from Wave 1 to Wave 2 given the relatively short time period between these waves. Third, our findings are not generalized to samples of the population not included in the NESARC including institutionalized or homeless adults, persons living outside the US, and adolescents. Related, our analysis only included respondents who participated in both waves of the NESARC and reported smoking cigarettes in Wave 1. Our measure of cigarette smoking (i.e., number of cigarettes smoked per day) may be an incomplete measure of current smoking exposure because we did not measure smoking topography, comprising variables such as maximum puff velocity, puff volume, and number of puffs. Moreover, our analysis does not take into consideration any cigarette purchasing behaviors such as cross-state border purchases, switching to higher nicotine brands in order to get “their dose” of nicotine through fewer cigarettes, or purchasing cigarettes on Indian reservations. Our analysis also assumes that cigarette price increases are equally effective among all subgroups of smokers. Last, regarding ImpacTeen data, the Tax Burden on Tobacco prices that the ImpacTeen cigarette prices are based on reflect regular prices and do not account for point-of-sale price-reducing marketing. Data on the extent of price-reducing marketing are only available at the national level, so adjustments are not possible.
Despite these limitations, study findings provide new and important epidemiologic insights into the interaction between smoking intensity levels and increases in state cigarette prices. In the present study, heavier cigarette smokers significantly adjusted their smoking behaviors in response to an increase in state cigarette prices. Our findings provide fresh insight to the evidence on the effectiveness of higher cigarette prices in reducing smoking.
What this paper adds.
Cigarette tax increases may not be equally effective in all subpopulations of smokers. Our findings indicted that the more cigarettes smoked per day at baseline, the more responsive the smokers were to increases in price per pack of cigarettes (i.e., number of cigarettes smoked per day was reduced in response to price increases). These findings provide fresh insight to the evidence on the effectiveness of higher taxes and prices in reducing smoking.
Acknowledgments
Role of funding source
This publication was also made possible by Grant Numbers UL1 RR024992 and KL2 RR024994 from the National Center for Research Resources (NCRR), a component of the National Institutes of Health (NIH), and NIH Roadmap for Medical Research and by K02DA021237 from the NIH. Other support includes an NIH Career Development Award awarded to Dr. Cavazos-Rehg (NIDA, K01DA025733) and ACS IRG-58-010-54 from the American Cancer Society, an NIH Midcareer Investigator Award awarded to Dr. Bierut (K02 DA021237), R21 DA026612 awarded to Dr. Grucza.
Footnotes
Conflicts of Interest
Dr. Bierut is listed as an inventor on Issued U.S. Patent 8,080,371,“Markers for Addiction” covering the use of certain SNPs in determining the diagnosis, prognosis, and treatment of addiction.
Contribution Statement
Patricia Cavazos-Rehg originated and supervised the study and led the writing of the article. Melissa Krauss and Brian Waterman assisted with data abstraction and management, completed the analyses, and participated in the writing. Edward Spitznagel participated in the writing and assisted with the study and the analyses. Frank Chaloupka and Douglas Luke assisted with drafting the article, interpreting results, and revising it for important intellectual content. Richard Grucza assisted with interpreting results, supervised the study, and reviewed and commented on the article. Laura Bierut supervised the study, assisted with interpreting results, and participated in the writing. All authors were involved in approving the final, submitted version of the article.
References
- 1.Chaloupka FJ. Tobacco control lessons learned: the impact of state and local policies. [Accessed 10/02/2011.];Research Paper Series. 2010 :1–67. http://www.www.impacteen.org/generalarea_PDFs/ITResearch38_Chaloupka.pdf.
- 2.Jha P, Chaloupka FJ. The economics of global tobacco control. BMJ. 2000;321:358–61. doi: 10.1136/bmj.321.7257.358. [DOI] [PMC free article] [PubMed] [Google Scholar]
- 3.Liang L, Chaloupka FJ. Differential effects of cigarette price on youth smoking intensity. Nicotine Tob Res. 2002;4:109–14. doi: 10.1080/14622200110103188. [DOI] [PubMed] [Google Scholar]
- 4.Tauras JA, Johnston LD, O’Malley PM. Effects of price and access laws on teenage smoking initiation: a national longitudinal analysis. Cambridge, Mass: National Bureau of Economic Research; 2001. Working Paper No. 8331. [Google Scholar]
- 5.Levy DT, Romano E, Mumford E. The relationship of smoking cessation to sociodemographic characteristics, smoking intensity, and tobacco control policies. Nicotine Tob Res. 2005;7:387–96. doi: 10.1080/14622200500125443. [DOI] [PubMed] [Google Scholar]
- 6.Grant BF, Dawson DA, Chou SP, et al. Co-occurrence of 12-month alcohol and drug use disorders and personality disorders in the United States: results from the national epidemiologic survey on alcohol and related conditions. Arch Gen Psychiatry. 2004;61:361–8. doi: 10.1001/archpsyc.61.4.361. [DOI] [PubMed] [Google Scholar]
- 7.Ruan WJ, Goldstein RB, Chou SP, et al. The alcohol use disorder and associated disabilities interview schedule-IV (AUDADIS-IV): Reliability of new psychiatric diagnostic modules and risk factors in a general population sample. Drug Alcohol Depend. 2008;92:27–36. doi: 10.1016/j.drugalcdep.2007.06.001. [DOI] [PMC free article] [PubMed] [Google Scholar]
- 8.Grant BF, Moore TC, Shepard J, et al. Source and accuracy statement: wave 1 national epidemiologic survey on alcohol and related conditions (NESARC) Bethesda, MD: National Institute on Alcohol Abuse and Alcoholism; 2003. [Google Scholar]
- 9.Coggins C, Murrelle E, Carchman R, et al. Light and intermittent cigarette smokers: a review (1989–2009) Psychopharmacology. 2009;207:343–63. doi: 10.1007/s00213-009-1675-4. [DOI] [PubMed] [Google Scholar]
- 10.Shah BV, Branwell G, Bieler GS. The SUDAAN user’s manual, release 7.5. Research Triangle Park, NC: Research Triangle Institute; 2002. [Google Scholar]
- 11.Hughes JR, Carpenter MJ. Does smoking reduction increase future cessation and decrease disease risk? A qualitative review. Nicotine Tob Res. 2006;8:739–49. doi: 10.1080/14622200600789726. [DOI] [PubMed] [Google Scholar]
- 12.Tverdal A, Bjartveit K. Health consequences of reduced daily cigarette consumption. Tob Control. 2006;15:472–80. doi: 10.1136/tc.2006.016246. [DOI] [PMC free article] [PubMed] [Google Scholar]
- 13.Broms U, Korhonen T, Kaprio J. Smoking reduction predicts cessation: longitudinal evidence from the Finnish adult twin cohort. Nicotine Tob Res. 10:423–7. doi: 10.1080/14622200801888988. [DOI] [PubMed] [Google Scholar]
- 14.Falba T, Jofre-Bonet M, Busch S, et al. Reduction of quantity smoked predicts future cessation among older smokers. Addiction. 2004;99(1):93–102. doi: 10.1111/j.1360-0443.2004.00574.x. [DOI] [PubMed] [Google Scholar]
- 15.Farkas AJ. When does cigarette fading increase the likelihood of future cessation? Ann Behav Med. 1999;21:71–6. doi: 10.1007/BF02895036. [DOI] [PubMed] [Google Scholar]
- 16.Cummings KM, Hyland A, Levy DT, et al. Reduction in amount smoked predicts future cessation. Psychol Addict Behav. 2005;19:221–25. doi: 10.1037/0893-164X.19.2.221. [DOI] [PubMed] [Google Scholar]
- 17.Fagerström KO. Can reduced smoking be a way for smokers not interested in quitting to actually quit? Respiration. 2005;72:216–20. doi: 10.1159/000084057. [DOI] [PubMed] [Google Scholar]
- 18.Tønnesen P. Smoking reduction for smokers not able or motivated to quit? Respiration. 2002;69:475–8. doi: 10.1159/000066468. [DOI] [PubMed] [Google Scholar]
- 19.Schane RE, Ling PM, Glantz SA. Health effects of light and intermittent smoking. Circulation. 2010;121(13):1518–22. doi: 10.1161/CIRCULATIONAHA.109.904235. [DOI] [PMC free article] [PubMed] [Google Scholar]
- 20.Pierce JP, Messer K, White MM, et al. Prevalence of heavy smoking in California and the United States, 1965–2007. JAMA. 2011;305(11):1106–12. doi: 10.1001/jama.2011.334. [DOI] [PubMed] [Google Scholar]
- 21.Frank PI, Morris JA, Frank TL, et al. Trends in smoking habits: a longitudinal population study. Family practice. 2004;21(1):33–8. doi: 10.1093/fampra/cmh108. [DOI] [PubMed] [Google Scholar]
- 22.American Lung Association. Trends in tobacco use. Research and Program Services Epidemiology and Statistics Unit. 2011. [Google Scholar]
- 23.Centers for Disease Control and Prevention. Vital signs: current cigarette smoking among adults aged 18 years and older—United States, 2005–2010. MMWR Recomm Rep. 2011;60(35):1207–1212. [PubMed] [Google Scholar]
- 24.Levy DE, Biener L, Rigotti NA. The natural history of light smokers: A population-based cohort study. Nicotine Tob Res. 2009;11(2):156–163. doi: 10.1093/ntr/ntp011. [DOI] [PMC free article] [PubMed] [Google Scholar]
- 25.Levy DT, Nikolayev L, Mumford E. Recent trends in smoking and the role of public policies: results from the SimSmoke tobacco control policy simulation model. Addiction. 2005;100:1526–36. doi: 10.1111/j.1360-0443.2005.01205.x. [DOI] [PubMed] [Google Scholar]
- 26.Eriksen M, Chaloupka F. The economic impact of clean indoor air laws. CA Cancer J Clin. 2007;57(6):367–78. doi: 10.3322/CA.57.6.367. [DOI] [PubMed] [Google Scholar]