Abstract
The tumor microenvironment, or stroma, is chemically and morphologically modified during carcinoma progression. The predominant cell type in the stroma, the fibroblast, maintains collagen properties in normal tissue and often transformed during tumor progression. Biochemical changes within fibroblasts upon initial cancer activation, however, are relatively poorly defined. Here, we hypothesized that Fourier transform infrared (FT-IR) spectroscopic imaging could potentially be employed to examine these early transformations. Further, we employ attenuated total reflectance (ATR) microscopy to characterize subcellular spectra and their changes upon transformation. We characterized fibroblast transitions upon stimulation with both a molecular agent and a carcinoma-mimicking cellular co-culture system. Changes were predominantly observed in the 1080 cm−1 and 1224 cm−1 peak absorbance, commonly associated with nucleic acids, as well as in the band at 2930 cm−1 associated with the C-H stretching of proteins in the cytoplasmic compartment. In conclusion, biochemical changes in cancer-associated fibroblasts that express a-SMA are dominated by the cytoplasm, rather than the nucleus. This ensures that spectral changes are not associated with proliferation or cell cycle processes of the cells and the cells are undergoing a true phenotypic change denoted by protein modifications in the cell body.
Introduction
Cancer is a leading cause of death and major healthcare issue today. A vast majority of cancers arise in epithelial cells and curbing growth of their tumors is a major focus of cancer management efforts. The non-epithelial compartment of tissue, or the stroma, around a growing epithelial tumor is also chemically and morphologically transformed during tumor progression. The biochemical evolution of stroma, however, is not well characterized. Understanding stromal involvement in tumor progression may lead to novel targeted therapies that will be successful for more patients than current therapies. Hence, there is interest in new technologies that can catalogue and help understand stromal changes. The main cell type comprising the stroma, and the one which maintains the tissue microenvironment, including the balance of collagen production and degradation, is the fibroblast. One of the best characterized changes in a cancer-associated stroma is the fibroblast to myofibroblast phenotypic change, distinguished by the expression of a-smooth muscle actin (α-SMA) in the cytoplasm of activated cells. The expression of this cytoskeletal protein results in the stiffening of the tumor microenvironment, which has implications in cancer progression.1–5 This stromal stiffening due to the fibroblast to myofibroblast transition may also play a role in, for example, lung fibrosis and in wound management.3 Hence, characterization of this transition is widely important for cancer and other diseases.
Normal fibroblasts co-cultured with cancerous epithelial cells also undergo the fibroblast to myofibroblast phenotypic change, and characteristically express α-SMA.3,5 Similarly, when normal fibroblasts are stimulated with TGF-β1, a growth factor which is known to have multiple roles in tumor growth and the conditioning of the microenvironment,6 α-SMA is expressed. α-SMA expression is measured using immunofluorescence, an antibody-based technique. There are limitations in using antibody-based techniques, however, as they target only a single molecular marker of the entire process that may or may not correspond to the entire cascade of events, are time-consuming, costly, and it is difficult to use them quantitatively. The use of spectroscopic techniques, especially imaging techniques, can provide a potential alternative to study stromal and, in particular, fibroblast transitions. Measurement of intrinsic chemical composition of cells, further, does not require dyes or antibodies and can potentially unmask underlying changes with greater sensitivity than that obtained via a single biomarker.
Fourier transform infrared (FT-IR) spectroscopy, in particular, is a spectroscopic technique that has been used to study biochemical changes that occur within cells undergoing disease processes.4,7–15 By directly comparing a biological state with spectroscopic data, a chemical signature of the disease process may be possible. Since IR spectra are holistically reflective of chemical composition, spectroscopic measurements can potentially yield more information than observing individual molecular targets. In terms of experimental configurations, transmittance and reflectance modes of sampling are common while attenuated total reflectance (ATR) is an especially attractive mode for this case. In the ATR mode, a high refractive index material is placed in close proximity to the sample such that the resulting evanescent wave arising from reflection within the high index material is used to interrogate the sample.16,17 Hence, ATR spectroscopy is generally useful for biological experiments because samples do not necessarily need to be dried. Since the evanescent wave set up has a limited penetration depth into the sample (0.5–5 μm), cells can be grown on substrates normally used for cell culture without a spectral contribution. Since the volume sampled is fixed, further, ATR data are also hypothesized to be less prone to optical distortions which can be a problem with biologically derived samples in other reflection modalities.18–22 These benefits allow for a direct comparison between biological phenomenon and spectral signatures, making ATR FT-IR spectroscopic imaging a potentially powerful tool in the laboratory. A further advantage of ATR imaging is the increase in effective numerical aperture due to the high index material acting as a solid immersion lens.23Used in conjunction with an IR microscope, this leads directly to a higher spatial resolution than available using other sampling modes.
Here, we sought to examine the early transformations in fibroblasts in cell culture to elucidate the spectroscopic characteristics of the fibroblast to myofibroblast transition. Then, we looked to examine and compare spectral characteristics of the transition in primary adult human dermal fibroblasts using two approaches: first, activation through TGF-β1 stimulation and, second, co-culture with a cancerous breast epithelial line. While the former is important to trace the transition to a molecular event, the latter is likely more reflective of the processes in complex tissue. Spectroscopic measurements were compared to immunofluorescence staining for α-SMA, the best characterized marker for the fibroblast to myofibroblast transition. To localize spectral changes in sub-cellular compartments, further, we employed ATR imaging. We anticipated that nuclear activation in response to external stimuli may have different temporal kinetics from cytoplasmic transitions that are likely to be dominated by protein expression. To our knowledge, the sub-cellular kinetics of cancer-associated transformations in stromal cells have not been examined in this manner.
Experimental methods
Cell culture
Normal primary adult dermal fibroblasts (NDF, Lonza) were cultured according to protocols provided by Lonza. All cells used in this study were between passage numbers 8 and 10 in order to maintain as consistent a chemical composition of the cells as possible. MCF-7, tumorigenic breast epithelial cells (ATCC), were cultured in a complete growth medium of Dulbecco's Modified Essential Medium (DMEM) supplemented with 10% FBS and 1% PenStrep and were subcultured every 3 days with 0.05% trypsin-EDTA. MCF10A, nontumorigenic breast epithelial cells (gifted by Dr Senthil Muthuswamy, Cold Spring Harbor Laboratory) were cultured in a complete growth medium of DMEM/F12 (Ham's) supplemented with 5% Horse Serum, 20 ng mL−1 EGF, 0.5 μg mL−1 hydrocortisone, 100 ng mL−1 cholera toxin, 10 μg mL−1 insulin, and 1% PenStrep. These cells were subcultured with 0.05% trypsin-EDTA every 3 days and were carefully maintained at subconfluence in order to avoid cells becoming contact-inhibited. All cells were grown in a humidified incubator with 5% CO2.
Sample preparation
NDF were grown on pieces of sterilized MirrIR (Kevley Technologies, Chesterland, OH, USA) slides in 12-well plates for 24 hours in complete growth medium, after which they were switched to a serum-free medium for 48 hours in order to halt growth. Simultaneously, MCF10A and MCF-7 were grown on 0.1 μm Transwell inserts (Corning Incorporated, Corning, NY, USA) for 24 hours in complete growth medium and then switched to serum-free DMEM for 48 hours before co-culture. The ‘zero hour’ time point is defined after 48 hours of culture in serum-free medium. At this time, four samples were fixed in 4% paraformaldehyde. The remaining samples were co-cultured with either MCF-7 or MCF10A. One third of the samples were treated with 1.5 ng mL−1 TGF-β1 in serum-free medium as a positive control. This concentration is known to induce α-SMA expression in fibroblasts over this time period. Samples were fixed in 4% paraformaldehyde after 6, 12, and 24 hours. The experiments were performed in duplicate with two samples at each time point and each condition being prepared for immunofluorescence and two samples prepared for FT-IR imaging. The experiment was independently repeated to show reproducibility in both α-SMA expression and IR spectra.
Immunofluorescence
After fixation in 4% paraformaldehyde, all samples were washed with PBS and quenched with 0.15 M glycine for ten minutes. After three washes in PBS, half of the samples were subsequently prepared for FT-IR imaging while the other half were processed for analysis using immunofluorescence. The samples for immunofluorescence imaging were permeabilized with 0.2% Triton-X-100 for fifteen minutes. They were washed and then blocked in 1% BSA in PBS/T for 90 minutes. After the blocking step, the samples were washed with PBS/T and incubated with primary antibody (Mouse anti-human α-SMA, Dako, 1 : 100 dilution in 1% BSA in PBS/T) overnight at 4 °C. The samples were washed again and incubated with secondary antibody (Goat anti-mouse IgG-FITC conjugated, abcam, 1 : 80 dilution in 1% BSA in PBS/ T). The samples were mounted with UltraCruz Mounting Medium for Fluorescence with DAPI (Santa Cruz Biotechnology, Cat # sc-24941) and imaged using a Zeiss Axiovert 200M fluorescence microscope. For the IR samples at 0 h and 24 h time points, 300 μm × 300 μm regions on each sample were imaged in ATR mode. These samples were then subsequently stained using the same protocol as the immunofluorescence samples to detect the presence of α-SMA in order to provide a more direct comparison between protein fibers and chemical spectra.
FT-IR imaging
All IR imaging was performed on a Spotlight-400 imaging system (PerkinElmer, Waltham, MA, USA) equipped with a thermal source and a raster-scanning, linear array detector. Transflection measurements were made for all samples in both confluent and sub-confluent regions of the slide. A background was taken on a spot of each sample where no cells were growing (120 co-adds, 8 cm−1 spectral resolution, 6.25 μm pixel size). All samples were imaged in transflection mode (32 co-adds, 8 cm−1 spectral resolution, 6.25 μm pixel size). 300 × 300 μm regions of the 0 h samples and all samples at the 24 h time point were imaged with the ATR configuration using a germanium crystal at the same spot as transflection measurements for a direct comparison (32 co-adds, 8 cm−1 spectral resolution, 1.56 μm pixel size). For all IR scans (transflection and ATR), an NB medium apodization was applied, a 1 cm s−1 mirror speed was used for acquisition, and zeropadding was not used. Prior to imaging, samples were washed with deionized water to remove PBS and then dried.
Data analysis
Atmospheric correction and ATR correction were performed using the Spectrum IMAGE program associated with the Spotlight. Files were imported into ENVI-IDL and a multipoint linear baseline was applied. Maximum noise fraction (MNF) transform was used to minimize noise in the ATR FT-IR images. For transflection measurements, a peak height at 1656 cm−1 (amide I vibrational mode) was used to segment pixels with an absorbance greater than 0.015 to ensure that only cells were being counted in the measurement. In ATR measurements, the nucleus and cytoplasm could be distinguished. Several hundred “nucleus” pixels and “cytoplasm” pixels were marked as separate regions of interest (ROIs) and average spectra were obtained. Spectra were normalized to 1656 cm−1 (amide I) band in order to account for variability in cell density.
Results and discussion
TGF-β1 and co-culture with MCF-7 generate morphological changes in human dermal fibroblasts
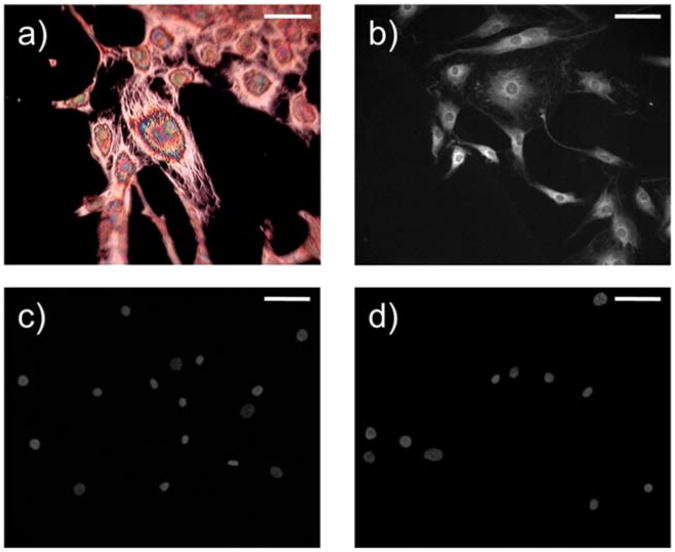
Two independent experiments were done in quadruplicate to understand the activation process. In the first, primary normal human dermal fibroblasts were stimulated using TGF-β1. In the second set of experiments, fibroblasts were co-cultured with epithelial cells. Two cell lines were used—a human tumorigenic breast epithelial line (MCF-7) for fibroblast activation and a normal breast epithelial line (MCF10A) as a control. In response to both stimulation with TGF-β1 and co-culture with MCF-7, cells morphologically displayed stress fibers, an example of which is shown in Fig. 1a. Furthermore, upon immunofluorescence imaging, these stress fibers were shown to have incorporated α-SMA protein (Fig. 1b). In contrast, fibroblasts co-cultured with MCF10A did not express α-SMA protein (Fig. 1c). Since fibroblasts are very sensitive to the stiffness of the substrate on which they are grown due to latent TGFβ1 signaling,24,25 we examined whether the use of the MirrIR substrate would have an effect. The majority of cells at the ‘zero hour’ time point did not show these fibers (Fig. 1d), indicating that they had not been pre-stressed or otherwise activated by the use of the new substrate. Further, there is little cell growth due to the culture in serum-free medium for 48 hours prior to beginning the experiment, which is also important in reducing confounding signals for spectroscopic analysis.
Fig. 1.
(a) Spotlight visible image of NDF after 24 h treatment with 1.5 ng mL−1 TGF-β1 in the reflection mode, likely indicating textures from subcellular optical phase retardation and interference of reflected light from the MirrIR substrate. (b) Immunofluorescence representing α-SMA protein expression in NDF after 24 h co-culture with MCF-7. Scale bar is 50 μm. (c) There is a lack of α-SMA expression in NDF at the 0 h time point and also in (d) NDF co-cultured with MCF10A for 24 hours. Cells have also been stained with DAPI, a nuclear stain, for visualization. Scale bar is 50 μm.
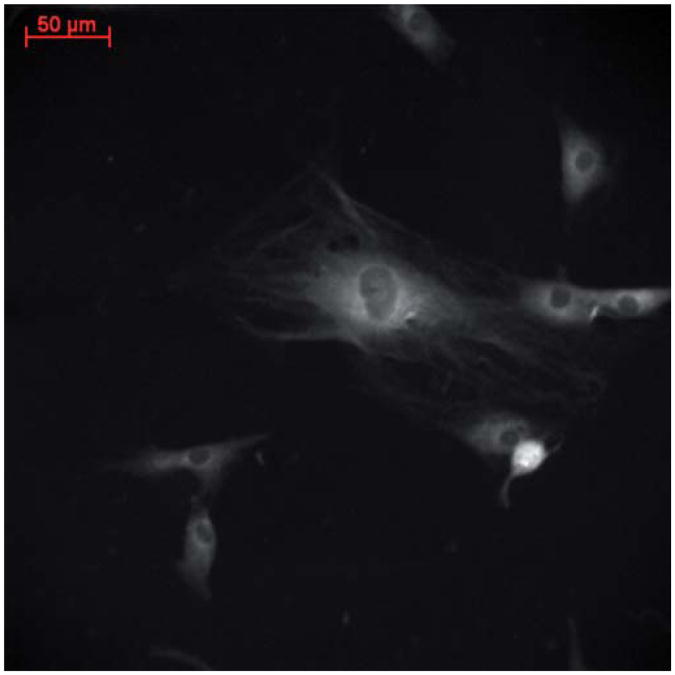
The observed stress fibers have been demonstrated to be the result of bundles of α-SMA protein,1 which is characteristically expressed by fibroblasts exposed to TGF-β1 or cancerous epithelial cells in vivo and in vitro.2,6 After 24 hours of co-culture with MCF-7 cells, primary normal dermal fibroblasts are activated under serum-free conditions (Fig. 2). This is due to soluble growth factors, small molecules that cells use to communicate with one another, being excreted into the media by MCF-7 cells and shared by the two cell types. Conversely, fibroblasts which have not been co-cultured with any epithelial cells and fibroblasts co-cultured with MCF10A cells do not express α-SMA (Fig. 1c and d). Noncancerous breast epithelial cells do not secrete growth factors that provide fibroblasts with appropriate chemical signals, and therefore they do not undergo this transition. The clear transition and stark difference in response to cancerous and normal cell lines make this pathway both interesting and an excellent model system to study tumor progression. α-SMA expression using immunofluorescence, however, is not quantitative. Hence, increasing amounts of α-SMA fibers over time could not be determined.26 When the same cells and process were observed using infrared spectroscopic imaging, however, there was a time dependence on evolution of absorption spectra.26 Although α-SMA expression was simply characterized as ‘on’ in the TGF-β1 treated and MCF-7 co-cultured samples and ‘off’ in the 0 h no co-culture and MCF10A co-cultured samples, IR data showed an evolution of peak height increase over time in the treatment groups. While the study demonstrated a change in spectra, the cellular origins of such a change were not examined.
Fig. 2.
α-SMA expression and incorporation into stress fibers in NDF after 24 h co-culture with MCF-7 cells. Scale bar is 50 μm.
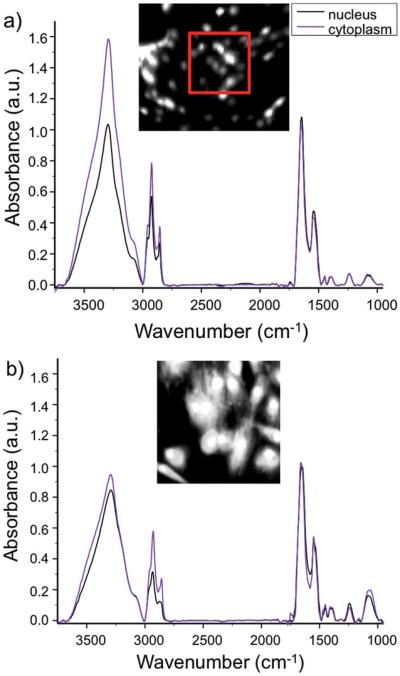
Average spectra across both confluent and subconfluent areas of the slide were acquired. From transflection measurements, the largest change in chemical spectra across co-culture time and sample type was in the two regions pertaining to nucleic acids, 1080 cm−1 (asymmetric phosphate) and 1224 cm−1 (symmetric phosphate). Although some discrimination could be made between the nuclear region and that of the cytoplasm, point spectra obtained from ‘cytoplasmic’ regions are inconclusive (Fig. 3a). In order to discriminate between the nucleus and cytoplasm of cells in transflection measurements, the 1080 cm−1 peak was used to pick out ‘nuclear’ pixels, and 2932 cm−1 was used to pick ‘cytoplasmic’ pixels. These pixels are very likely to be mixed, such that no subcellular differentiation is made. This highlights the need for high-resolution spectroscopic imaging for the analysis of mammalian cells.
Fig. 3.
Comparison of average IR spectra of cytoplasmic and nuclear pixels in (a) transflectance and (b) ATR sampling modes. Comparison of transflectance mode absorbance (a, inset) and ATR mode absorbance (b, inset) images at 1656 cm−1 (Amide I) of NDF stimulated with TGF-β1 after 24 h. The red box in (a) outlines the area shown in (b).
ATR FT-IR imaging is used to differentiate subcellular compartments of each cell
Since subcellular localization of spectra could not be accomplished using transflection mode, the ATR sampling mode was utilized in order to increase the spatial resolution of the IR images using a high index (Ge) material. The pixel size of 6.25 × 6.25 μm was consequently reduced to 1.56 × 1.56 μm and the depth of penetration is expected to be on the order of 1–5 μm. The pixel sampling density for each fibroblast increased by 16-fold and we were able to discriminate between nuclear and cytoplasmic regions (Fig. 3a and b) using simple univariate analysis. The unambiguously nuclear and cytoplasmic pixels (Fig. S1, ESI†) could then be carefully marked manually into regions of interest (ROI). Several hundred pixels from each subcellular region were marked as ROIs, averaged and plotted (Fig. 3b), resulting in both random noise reduction (because more pure pixels could be averaged) and biological noise reduction (as differences in the spectra of multiple cells and intracellular entities were averaged). The segmentation of cells into nuclear and cytoplasmic compartments allows for a ‘subcellular’ analysis of the biochemical changes occurring across the sample. While finer structural localization may be afforded by other techniques, our goal was to understand the spectral contributions of the two main subcellular compartments and understand whether the observed dynamics of transition could indicate separate nuclear and cytoplasmic activity.
Molecular events occurring within the fibroblast cytoplasm drive the fibroblast to myofibroblast phenotypic change after exposure to cancerous stimuli
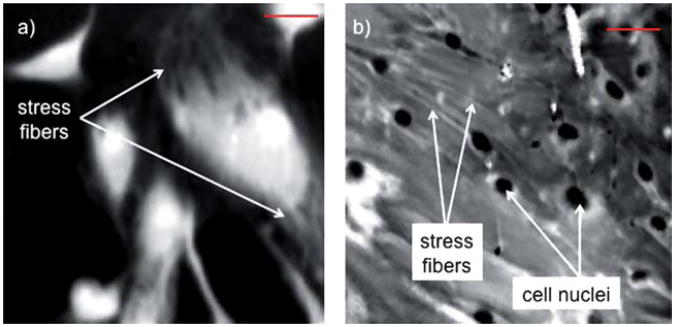
Next, α-SMA stress fibers present in activated fibroblasts were visualized using ATR FT-IR imaging (Fig. 4a and b). The peak absorbances at 1544 cm−1, 1656 cm−1, and 2932 cm−1 gave the highest contrast for stress fibers. These vibrational modes are generally related to protein conformational changes and, thus, are biochemically relevant for our analysis. There was no single vibrational mode which fully described the stress fibers, and so a collection of features (a ‘chemical signature’) was used. One confounding reason for this could be that the stress fibers are located at the basal surface of the cell, where the substrate generates intracellular tension as well as induces the over-expression of other proteins that help cells adhere to the substrate. The limited sampling volume may not be sensitive enough to assess stress fibers that are distributed throughout the cell. Furthermore, actin isoforms, including α-SMA, are characterized by an acetylated NH2-terminal decapeptide.27 However, there are only subtle differences between the isoforms (as little as a 4 amino acid residue change), and thus the spectral data probably cannot discriminate between endogenously expressed F-actin and the stimulated α-SMA. We hypothesize, however, that more global changes in the total biochemistry of the ‘activated fibroblasts’ are likely responsible for the spectral changes that distinguish the two states.
Fig. 4.
(a) ATR FT-IR absorbance image at 1656 cm−1 (amide I) of NDF stimulated with TGF-β1 for 24 h. MNF transform was applied to reduce noise and better segregate nuclear from cytoplasmic spectra for subsequent analysis. (b) NDF co-cultured with MCF-7 show intracellular stress fibers in ATR FT-IR absorbance image at 1656 cm−1 after application of MNF transform and limiting image reconstruction to bands that show stress fibers for visualization only. Scale bar is 50 μm.
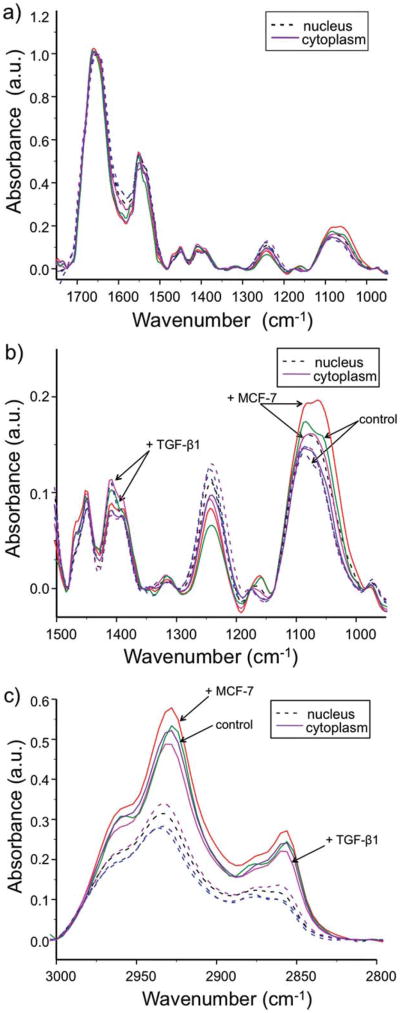
Finally, using average spectra obtained from ROI pixels, an evolution of the chemical changes occurring in NDF over time across all conditions was determined. Although increases in nucleic acids (1080 cm−1 and 1224 cm−1) can be logically thought to have a nuclear origin, average spectra obtained from ATR FT-IR measurements show greater increases in the nucleic acid material in the cytoplasm pixels and in particular the 1080 cm−1 peak (Fig. 5a and b). The result is somewhat surprising as it implies that there is either too little nuclear change in this process to be monitored by IR spectroscopy or that IR spectra do not actually capture nuclear contributions well due to dense chromatin packing of DNA in the nucleus of the cell.28 The results here imply that the observed phenotypic change is the result of chemical factors present in the cytoplasm, and it is not necessarily under nuclear control after 24 hours. This is likely as the transformation is characterized by the expression of a cytoplasmic protein.
Fig. 5.
Evolution of IR absorbance spectra over time under all conditions for nucleus and cytoplasm in the (a) fingerprint region. This region is zoomed in (b) for spectral detail. The spectral changes seen in the (c) C–H stretching region are dominated by the signal from the cytoplasm.
Similarly, in the C-H stretch region (3000–2750 cm−1), drastic changes in the cytoplasm under the 24 h MCF-7 co-culture condition are seen (Fig. 5c). In comparison with the 0 h control, absorbances at 2932 cm−1 and 2856 cm−1 in the 24 h MCF-7 co-culture sample were greatly increased while there was a decrease in the peak heights of the 24 h TGF-β1 treated sample. This shows that co-culture with MCF-7 likely induces this phenotype much more drastically than stimulation with TGF-β1. MCF-7 cells, having a cancerous phenotype, are more efficient at transforming NDF with a complex mix of molecular signals. Some of these signals may have synergistic effects in regulating the myofibroblast differentiation, which results in an increased response compared with induction of the phenotype by using a single growth factor. In addition, this could indicate de novo fatty acid production in fibroblasts which are located near cancerous epithelium undergoing this phenotypic change whereas TGF-b1 stimulated cells are simply metabolizing these fatty acids. De novo synthesis of fatty acids catalyzed by fatty acid synthase is one of the hallmarks of cancerous epithelium.12 Fatty acid synthase (FAS) converts acetyl-CoA into malonyl-CoA and its final product is palmityl-CoA, a fatty acid with a 16 carbon chain.29 The lengthening of this carbon chain is possibly shown by these increases in symmetric and asymmetric CH2 stretching bands at 2932 cm−1 and 2856 cm−1.
Conclusions
This work describes using FT-IR spectroscopy and imaging in the ATR mode as a means to further investigate the fibroblast to myofibroblast phenotypic change. The higher spatial resolution allowed the visualization of subcellular compartments and indicated that this transition is largely observed by IR spectroscopy due to biochemical changes occurring in the cytoplasm rather than the nucleus. By directly comparing this change to the regular biological technique of immunofluorescent staining for the biomarker α-SMA, a direct comparison was made between molecular expression and chemical spectra. ATR FT-IR spectroscopy is a powerful technique for understanding global changes in cell biology in order to see which assays to choose next. For example, the evolution in the C–H stretch region of fibroblasts co-cultured with cancerous breast epithelial cells suggests that fatty acid metabolism should be further investigated. In addition to this study, using label-free, global chemical changes to understand the fibroblast to myofibroblast phenotypic change could likely aid the study of lung fibrosis, wound management, and cancer progression.
Supplementary Material
Acknowledgments
We would like to thank Dr Senthil Muthuswamy, Cold Spring Harbor Laboratory, and Dr Supriya G. Prasanth, University of Illinois, for the generous gift of the MCF10A cell line. Funding for this study was provided by Susan G. Komen for the Cure (KG081426) and the National Institutes of Health (RO1CA138882).
Footnotes
Electronic supplementary information (ESI) available.
References
- 1.Goffin J, Pittet P, Csucs G, Lussi J. J Cell Biol. 2006;172:259–268. doi: 10.1083/jcb.200506179. [DOI] [PMC free article] [PubMed] [Google Scholar]
- 2.Ong V, Carulli M, Xu S, Khan K, Lindahl G. Exp Cell Res. 2009;315:151–161. doi: 10.1016/j.yexcr.2008.11.001. [DOI] [PubMed] [Google Scholar]
- 3.Rønnov-Jessen L. Breast J. 1996;2:320–339. [Google Scholar]
- 4.Kong R, Reddy R, Bhargava R. Analyst. 2010;135:1569–1578. doi: 10.1039/c0an00112k. [DOI] [PMC free article] [PubMed] [Google Scholar]
- 5.Rozenchan P, Carraro D. Int J Cancer. 2009;125:2767–2777. doi: 10.1002/ijc.24646. [DOI] [PubMed] [Google Scholar]
- 6.Rønnov-Jessen L, Petersen OW, Koteliansky VE, Bissell MJ. J Clin Invest. 1995;95:859–873. doi: 10.1172/JCI117736. [DOI] [PMC free article] [PubMed] [Google Scholar]
- 7.Matthaus C, Bird B, Miljkovic M, Chernenko T, Romeo M, Diem M. Methods Cell Biol. 2008;89:275–308. doi: 10.1016/S0091-679X(08)00610-9. [DOI] [PMC free article] [PubMed] [Google Scholar]
- 8.Bogomolny E, Huleihel M, Suproun Y. J Biomed Opt. 2007;12:024003. doi: 10.1117/1.2717186. [DOI] [PubMed] [Google Scholar]
- 9.Bogomolny E, Argov S, Mordechai S. Biochim Biophys Acta. 2008;1780:1038–1046. doi: 10.1016/j.bbagen.2008.05.008. [DOI] [PubMed] [Google Scholar]
- 10.Diem M, Romeo M, Matthaus C, Miljkovic M. Infrared Phys Technol. 2004;45:331–338. [Google Scholar]
- 11.Salman A, Sahu R, Bernshtain E, Zelig U. Vib Spectrosc. 2004;34:301–308. [Google Scholar]
- 12.Harvey T, Brown M, Lockyer N, Gardner P. Vib Spectrosc. 2009;50:99–105. [Google Scholar]
- 13.Lasch P, Pacifico A, Diem M. Biopolymers. 2002;67:335–338. doi: 10.1002/bip.10095. [DOI] [PubMed] [Google Scholar]
- 14.Baker M, Clarke C, Demoulin D, Nicholson J. Analyst. 2010;135:887–894. doi: 10.1039/b920385k. [DOI] [PubMed] [Google Scholar]
- 15.Lee S, Yoon K, Jang S, Ganbold E, Uuriintuya D. J Vet Med Sci. 2009;10:299–304. doi: 10.4142/jvs.2009.10.4.299. [DOI] [PMC free article] [PubMed] [Google Scholar]
- 16.Sommer AJ, Tisinger LG, Marcott C, Story GM. Appl Spectrosc. 2001;55:252–256. [Google Scholar]
- 17.Chan KLA, Kazarian SG. Appl Spectrosc. 2003;57:381–389. doi: 10.1366/00037020360625907. [DOI] [PubMed] [Google Scholar]
- 18.Brown M, Clarke N, Nicholson J, Gardner P. Analyst. 2007;132:750–755. doi: 10.1039/b702064c. [DOI] [PubMed] [Google Scholar]
- 19.Dumas P, Gazi E, Brown M, Clarke N, Gardner P. Analyst. 2009;134:1171–1175. doi: 10.1039/b821349f. [DOI] [PubMed] [Google Scholar]
- 20.Bhargava R, Wang S, Koenig JL. Appl Spectrosc. 1998;52:323–328. [Google Scholar]
- 21.Davis BJ, Carney PS, Bhargava R. J Anal Chem. 2010;82:3474–3486. doi: 10.1021/ac902067p. [DOI] [PubMed] [Google Scholar]
- 22.Romeo M, Mohlenhoff B, Diem M. Vib Spectrosc. 2006;42:9–14. doi: 10.1016/j.vibspec.2006.04.009. [DOI] [PMC free article] [PubMed] [Google Scholar]
- 23.Ippolito SB, Goldberg BB, Unlu MS. J Appl Phys. 2005;97:053105. [Google Scholar]
- 24.Hinz B. Curr Rheumatol Rep. 2009;11:120–126. doi: 10.1007/s11926-009-0017-1. [DOI] [PubMed] [Google Scholar]
- 25.Wells RG, Discher DE. Sci Signal. 2008;1:pe13. doi: 10.1126/stke.110pe13. [DOI] [PMC free article] [PubMed] [Google Scholar]
- 26.Holton SE, Walsh MJ, Bhargava R. unpublished work [Google Scholar]
- 27.Skalli O, Ropraz P, Trzeciak A. J Cell Biol. 1986;103:2787–2796. doi: 10.1083/jcb.103.6.2787. [DOI] [PMC free article] [PubMed] [Google Scholar]
- 28.Matthaus C, Boydston-White S, Miljkovic M, Romeo M, Diem M. Appl Spectrosc. 2006;60:1–8. doi: 10.1366/000370206775382758. [DOI] [PMC free article] [PubMed] [Google Scholar]
- 29.Menendez JA, Lupu R. Nat Rev Cancer. 2007;7:763–777. doi: 10.1038/nrc2222. [DOI] [PubMed] [Google Scholar]
Associated Data
This section collects any data citations, data availability statements, or supplementary materials included in this article.


