

Abstract
Objective
Patient-reported outcome measures with reporting periods of a week or more are often used to evaluate the change of symptoms over time, but the accuracy of recall in the context of change is not well understood. This study examined whether temporal trends in symptoms that occur during the reporting period impact the accuracy of 7-day recall reports.
Methods
Women with premenstrual symptoms (n = 95) completed daily reports of anger, depression, fatigue, and pain intensity for 4 weeks, as well as 7-day recall reports at the end of each week. Latent class growth analysis was used to categorize recall periods based on the direction and rate of change in the daily reports. Agreement (level differences and correlations) between 7-day recall and aggregated daily scores was compared for recall periods with different temporal trends.
Results
Recall periods with positive, negative, and flat temporal trends were identified and they varied in accordance with weeks of the menstrual cycle. Replicating previous research, 7-day recall scores were consistently higher than aggregated daily scores, but this level difference was more pronounced for recall periods involving positive and negative trends compared with flat trends. Moreover, correlations between 7-day recall and aggregated daily scores were lower in the presence of positive and negative trends compared with flat trends. These findings were largely consistent for anger, depression, fatigue, and pain intensity.
Conclusion
Temporal trends in symptoms can influence the accuracy of recall reports and this should be considered in research designs involving change.
Keywords: electronic diaries, patient-reported outcomes, recall bias, temporal trends
Introduction
The ability of patient-reported outcomes (PROs) to accurately depict patients' experiences of health and wellbeing is of critical importance for quality of life research. One key issue for maximizing accuracy is the selection of appropriate recall periods for PRO measurement [1,2], that is, the period of time over which respondents are asked to recollect. The most commonly used instruments ask patients to summarize their experiences over many days, for example, the past 7 days. This is often deemed useful to capture a clinically relevant window of time with a single assessment [2,3]. However, evidence suggests that recall ratings are impacted by a number of contextual factors [4] and memory biases [5,6].
To what extent the length of recall impacts the accuracy of PROs has been examined in a number of studies, with mixed results. Some studies suggest that recall periods beyond one day show considerable distortions [1,7], yet others have found reasonably high correspondence between real-time or daily assessment and recall ratings of a week or more [8–11]. An important limitation of many prior studies is that they were conducted with samples whose symptoms were constant or in a “steady state”, as opposed to symptoms that had systematic change (increases or decreases) over time. There has been a lingering concern that results from these studies may not adequately depict the accuracy of recall PROs where change is expected, for example, when PROs are used to evaluate health-related developmental processes or treatment effects in clinical trials [1,8].
There are several reasons to suspect that the accuracy of recall PROs may be affected by temporal trends of experiences during the recall period. Cognitive theory suggests that due to limitations of human memory, people often rely on mental shortcuts and provide ratings consistent with their global impression of the period as a whole. The rate at which experiences of health and quality of life improve or worsen over time is an important aspect of the overall “gestalt” of the recall period [12,13]. Behavioral decision-making research has demonstrated that people's satisfaction with hypothetical episodes is influenced by the extent to which an episode becomes more pleasant or unpleasant as it unfolds [14,15]. In addition, change is of fundamental importance to the sensitivity of perceptual systems; for example, when presented with a static visual image, visual perception fades quickly in the absence of change [16].
The goal of this study was to examine whether the accuracy of 7-day recall PROs is influenced by temporal trends of daily symptom experience during the recall period. The data are from a larger study comparing recall and daily PROs across several populations. The present study sample consists of women reporting premenstrual symptoms, for whom a monthly cyclical pattern of symptom change is expected [17,18]. Women provided daily assessments of anger, fatigue, depression, and pain intensity over the course of 4 weeks, and were administered 7-day recall assessments for each of these PRO domains at the end of each week. Recall periods were classified in accordance with the direction and rate of change of daily symptoms using latent class growth analysis and the accuracy of 7-day recall PROs was compared in groups defined by different temporal trends of daily symptoms.
In accordance with prior research, we expected that 7-day recall measures would generally yield higher symptom levels compared to the average of daily assessments [1,8,19]. The critical question was whether this effect would be accentuated or attenuated for different temporal trends. In addition, we examined whether the correspondence (i.e., correlation) between 7-day recall and aggregated daily assessments would be affected by temporal trends of daily experience [1].
Methods
Participants
One hundred women were recruited for this study. Eligibility criteria were age ≥ 21 years, availability to make daily ratings for 28 consecutive days, high-speed Internet access at home, English fluency, no visual impairment, no night shift job, no hysterectomy, regular monthly menses, not pregnant, and not currently using hormone replacement therapy or fertility drugs. In addition, women were required to report ≥2 physical premenstrual symptoms (abdominal bloating, weight gain from water retention, increase in appetite/food cravings, breast pain/tenderness, acne flare-ups, hot flashes, headache, dizziness, poor coordination, change in sex drive, constipation/diarrhea) and ≥1 emotional/behavioral symptom (irritability/angry outbursts, mood swings or depressed mood, poor impulse control, tension/anxiety, lethargy, insomnia, crying, social withdrawal, trouble concentrating or thinking clearly, thirst). The symptoms were required for the past 3 menstrual cycles; they had to occur during 5–7 days before menses and to fade by the end of menses [18].
Procedure
The study was approved by the Stony Brook University Institutional Review Board. Recruitment was conducted from Eastern and Central US time zones using an Internet panel of 1.7 million respondents who regularly participate in online surveys (www.surveyspot.com). Panelists pre-screened for premenstrual symptoms were invited to contact our office for eligibility screening. Participants provided electronic consent and were telephone-trained on how to complete the assessments on their home computers. Data were collected online using Assessment CenterSM (http://www.assessmentcenter.net/), a free research management tool. Participants were instructed to complete the daily ratings over 28 days between 6 PM and midnight. The 7-day recall measures were administered prior to the daily measures at the end of each week (day 7, 14, 21, and 28). The protocol started approximately two weeks before the women's estimated first day of her next menses to increase the likelihood of obtaining data for a full week before and after menses. Compliance was monitored daily and participants were contacted if they missed an assessment. Participants received up to $150 for study completion.
Measures
Anger, fatigue, and depression
Anger, fatigue, and depression were assessed with measures provided by the National Institutes of Health funded Patient-Reported Outcomes Measurement Information System (PROMIS) initiative [3,20,21]. PROMIS has developed item-banks (i.e., comprehensive sets of calibrated items) using a strategic item generation and selection methodology (including focus groups and cognitive interviews) and employed extensive psychometric testing using item response theory (IRT) [22,23]. PROMIS measures maintain high precision (reliability ≥.95) over wide ranges of the PRO severity continuum [20,24]. PROMIS uses a 7-day recall period for the domains in this study (anger, fatigue, depression). The scores are normed on a T-score metric, which is scaled to have a mean of 50 and a standard deviation of 10 in the U.S. general population [3,25].
PROMIS affords measurement via Computerized Adaptive Testing (CAT) or by selecting any subset of items from the bank to create a static short-form [3]. In the present study, the 7-day recall PROMIS measures were administered via CAT, which adaptively tailors the selection of items to optimize measurement precision and stops when sufficient precision (standard error <0.3, equaling reliability >.90) has been achieved (no less than 4 and no more than 12 items were administered for each domain)[24].
Daily versions of PROMIS measures were administered as static short-forms consisting of 8 (anger), 7 (fatigue), and 8 (depression) items. The reporting period of each PROMIS item was changed from “In the past 7 days…” to “In the last day…”; item content and response options were left unchanged. The items were taken from the PROMIS Version 1 short-forms [20,21], with the exception of two fatigue items with wordings not suitable for daily assessment (these items were substituted by other calibrated items from the fatigue bank [20]). The daily measures were scored with IRT using the national item parameters established for PROMIS (http://www.nihpromis.org). This placed the daily scores on the PROMIS T-score metric and thereby allowed for a direct comparison of daily and 7-day recall scores on the same metric [19].
Pain intensity
Pain intensity was measured on a standard 0–10 numeric rating scale (NRS; 0= no pain, 10= worst pain imaginable) using parallel versions for daily and 7-day recall assessments [26,27].
Days of menses
Days of menses were assessed with the daily question: “Did you have any menstrual bleeding today?” (Yes – No).
Analysis strategy
Data analysis proceeded in two consecutive steps. The purpose of step 1 was to classify the participants' 7-day recall periods based on the temporal trends underlying the daily scores. Latent class growth analysis (LCGA) was used for this purpose. The prevalence of the identified temporal trends across the weeks of the menstrual cycle was examined to validate the LCGA solution. In step 2, we analyzed whether agreement (level differences and correlations) between 7-day recall and aggregated daily scores differed across the types of temporal trends derived from the LCGA. It is noteworthy that the classification of temporal trends was entirely independent of the analyses in step 2.
Latent class growth analysis of daily scores
LCGA is similar to latent growth curve analysis in estimating change represented by latent intercept and slope coefficients. However, instead of assuming that a single continuum of growth curves describes the population, LCGA seeks to detect subgroups (or latent classes) following distinct temporal trends (e.g., groups following increasing, decreasing, and “flat” trends). For introductory reviews of LCGA techniques, see [28–31]. Whereas often LCGA is used to classify individuals, it was employed here to categorize the respondents' recall periods based on the growth parameters (intercept and linear slope) of the 7 daily scores of a recall period (i.e., week).1 Given that each respondent contributed 4 recall periods, a cluster-robust standard error estimator was used to adjust the test-statistics for the non-independence of observations arising from the “nesting” of recall periods within individuals [32]. Since we were solely interested in capturing the magnitude and direction of temporal trends irrespective of a person's overall symptom level during a given recall period, the daily scores were centered around the week's mean for each person (by subtracting the average daily score for the week from each individual daily score) prior to fitting the LCGA models. All LCGA models were estimated with 100 random starts; the best 10 were run to full convergence to avoid the potential of solutions converging at local maxima [33]. Missing values were accommodated by the use of full information maximum likelihood parameter estimation.
To determine the number of latent growth classes that best fit the data, we compared models with 1–4 classes based on the Bayesian Information Criterion (BIC) and the Vuong-Lo-Mendell-Rubin Likelihood Ratio (VLMR) test [29,30,34]. The model with the lowest BIC is generally preferred. The VLMR tests the statistical significance of the improvement in model fit when an additional class is extracted [34]. In addition, entropy (an index comparing latent versus predicted class memberships) was inspected for each model, with values closer to 1 (range 0 to 1) indicating higher classification accuracy.
Relationships with weeks of the menstrual cycle
After identifying the best fitting LCGA models for each PRO domain, we examined whether the types of temporal trends captured by the growth classes varied by week of the menstrual cycle. For this purpose, the 4 study weeks (recall periods) were categorized based on the self-reported first day of menses. Specifically, counting backwards from the first day of menses, the week of recall covering the majority (at least 4 of 7) of days before this day was coded as “pre-menstrual week”. The subsequent week was coded as “week of menses”. Using the remaining 2 study weeks as reference category, latent class membership was then regressed on dummy variables for the pre-menstrual week and the week of menses using multinomial logistic regression with cluster-robust standard errors.
Comparison of recall accuracy across types of temporal trends
To examine whether the agreement (level differences and correlations) between 7-day recall and aggregated daily scores differed across types of temporal trends, we used the “3-step” approach suggested by Vermunt [35,36]. Using this approach, the LCGA is run (step 1) to obtain predicted class memberships and probability rates (step 2). The predicted memberships are then used as latent class indicators with fixed probabilities to obtain class-specific estimates for additional, “distal” outcome variables (step 3). The 7-day recall scores and the average of the 7 daily scores of each recall period served as multivariate “distal” outcome variables, with mean levels, variances, and covariances for both variables freely estimated for each latent growth class. This allowed us to estimate mean level differences and correlations between recall and aggregated daily scores conditional upon growth classes while appropriately taking into account the uncertainty of class membership inherent in LCGA. Wald χ2 tests were used for statistical comparison of level differences and correlations between the growth classes. Maximum likelihood parameter estimation with cluster-robust standard errors was again used to correct the test-statistics for the nesting of 4 weeks within participants. All analyses were performed using Mplus Version 7 [37].
Results
Five participants dropped out of the study and were excluded from the analyses. Demographic characteristics of the analyzed sample (n= 95) are shown in Table 1. The mean age of the women was 36 years (range 21 to 54 years), about three-fourths (74%) were White, and about half (56%) were married. Women dropping out were somewhat younger (mean= 32 years, p = .23), but otherwise did not differ from study completers.
Table 1.
Demographic characteristics of study participants (n = 95)
| Frequency (%) | |
|---|---|
| Age (mean = 36.3, SD = 8.0) | |
| Age categories | |
| 21 – 30 | 25 (26.3) |
| 31 – 40 | 38 (40.0) |
| 41 – 54 | 32 (33.7) |
| Race | |
| White | 70 (73.7) |
| African American | 12 (12.7) |
| Asian | 5 (5.3) |
| Other/multiple | 8 (8.4) |
| Hispanic | 15 (15.8) |
| Married | 53 (55.8) |
| Education | |
| High school | 13 (13.7) |
| Some college | 39 (41.1) |
| College graduate | 31 (32.6) |
| Advanced degree | 12 (12.6) |
| Family incomea | |
| less than $20,000 | 9 (9.6) |
| $20,000 – 34,999 | 19 (20.2) |
| $35,000 – 49,999 | 24 (25.5) |
| $50,000 – 74,999 | 20 (21.3) |
| $75,000 and higher | 22 (23.4) |
Note:
Income was not reported by one participant.
Compliance with the 28-day protocol was high in the analyzed sample. Participants completed an average of 26.8 (SD = 1.72) out of 28 daily assessments, and a total of 113 (4.2%) out of 2,660 assessment days were missed. Out of 380 weekly recall assessments, 16 (4.2%) were missed on the 7th day of the week; 13 of those were completed on the subsequent day2, and only 3 recall assessments were completely missed.
LCGA for daily diary scores
Table 2 shows the fit indices for LCGA models with 1 to 4 classes. For each PRO domain, a 3-class model was selected as it provided the best model fit. The 3-class models generally showed the lowest BIC (except for pain, see Table 2), and the VLMR test suggested significant improvement in fit when moving from 2- to 3-class models, but not when moving from 3- to 4-class models for each domain. Entropy was high (≥.83) for 3-class solutions, and tended to decrease for 4-class solutions.
Table 2.
Fit indices of Latent Class Growth Analyses for daily diary PRO scores
| LCGA Model | LL | AIC | BIC | Entropy | VLMR (df = 3) |
|---|---|---|---|---|---|
| Anger | |||||
| 1-Class | −8339.75 | 16685.50 | 16697.30 | n/a | n/a |
| 2-Class | −8267.44 | 16546.88 | 16570.47 | 0.64 | 144.64* |
| 3-Class | −8224.78 | 16502.94 | 16502.94 | 0.83 | 85.33** |
| 4-Class | −8216.10 | 16456.20 | 16503.38 | 0.79 | 17.35ns |
| Fatigue | |||||
| 1-Class | −8441.77 | 16889.54 | 16901.33 | n/a | n/a |
| 2-Class | −8368.92 | 16749.84 | 16773.44 | 0.89 | 145.69* |
| 3-Class | −8304.95 | 16627.90 | 16663.29 | 0.89 | 127.94* |
| 4-Class | −8299.35 | 16622.70 | 16669.89 | 0.86 | 11.20ns |
| Depression | |||||
| 1-Class | −7658.53 | 15323.07 | 15334.87 | n/a | n/a |
| 2-Class | −7578.45 | 15168.91 | 15192.50 | 0.79 | 160.16** |
| 3-Class | −7527.97 | 15073.94 | 15109.33 | 0.86 | 100.97* |
| 4-Class | −7521.73 | 15067.47 | 15114.65 | 0.87 | 12.47ns |
| Pain intensity | |||||
| 1-Class | −3792.73 | 7591.45 | 7603.25 | n/a | n/a |
| 2-Class | −3575.62 | 7163.25 | 7186.84 | 0.92 | 434.21* |
| 3-Class | −3461.69 | 6941.38 | 6976.77 | 0.90 | 227.86** |
| 4-Class | −3431.33 | 6886.66 | 6933.85 | 0.86 | 60.72ns |
Note: LCGA = Latent Class Growth Analysis; LL = log likelihood; AIC = Akaike Information Criterion; BIC = Bayesian Information Criterion; VLMR = Vuong-Lo-Mendell-Rubin likelihood ratio test for K-1 (H0) versus K classes; ns = not significant.
p < .05;
p < .01.
Figure 1 shows the observed daily means and estimated linear trends of the daily scores in each latent class. For each PRO domain, the largest class displayed a “flat” temporal trend (41–48% of all recall periods). The second class (19–32%) was characterized by a “positive” trend, with scores increasing by 10.6 (anger), 13.3 (fatigue), and 10.2 (depression) T-score points on the PROMIS metric, and by 1.6 points for pain (11-point NRS) over the 7-day period. The third class (26–40%) displayed a “negative” temporal trend, with scores decreasing by 11.4 (anger), 8.8 (fatigue), 7.9 (depression), and 2.9 (pain) points over the 7-day period.
Figure 1.
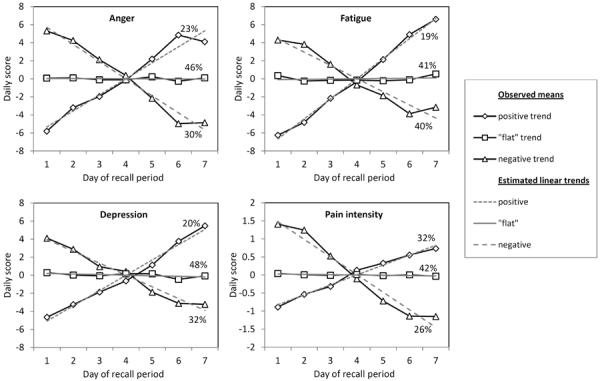
Observed means and estimated linear temporal trends for daily scores in each of the latent classes. Percentages represent the percent of weeks in each class. The estimated linear trends intersect approximately on day 4 due to the within-week centering applied to the observed daily scores.
Relationships with weeks of the menstrual cycle
We next examined whether the temporal trends varied by week of the menstrual cycle. As shown in Table 3, positive trends were most prevalent during pre-menstrual weeks (ps < .001 for all PRO domains) and negative trends were most prevalent during the week of menses (ps < .001 for anger, fatigue and pain, and p = .16 for depression). Specifically, compared with a flat trend, the odds of a positive trend were 3.2 to 5.0 times higher in the pre-menstrual week than in other weeks, and the odds of a negative trend were 1.4 to 6.9 times higher in the week of menses than in other weeks of the menstrual cycle.
Table 3.
Odds ratios of positive and negative temporal trends (versus a “flat” trend) for the pre-menstrual week and the week of menses when compared to the remaining two study weeks
| Positive versus flat trend |
Negative versus flat trend |
|||||
|---|---|---|---|---|---|---|
| 95% CI |
95% CI |
|||||
| Odds ratio | − | + | Odds ratio | − | + | |
| Anger | ||||||
| Pre-menstrual week | 5.02*** | 2.84 | 8.89 | 0.94 | 0.51 | 1.71 |
| Week of menses | 1.56 | 0.78 | 3.11 | 2.80*** | 1.72 | 4.56 |
| Fatigue | ||||||
| Pre-menstrual week | 3.22*** | 1.76 | 5.88 | 1.06 | 0.62 | 1.81 |
| Week of menses | 1.23 | 0.54 | 2.84 | 3.01*** | 1.84 | 4.93 |
| Depression | ||||||
| Pre-menstrual week | 6.12*** | 3.58 | 10.46 | 0.94 | 0.52 | 1.69 |
| Week of menses | 0.84 | 0.35 | 2.01 | 1.43 | 0.87 | 2.36 |
| Pain intensity | ||||||
| Pre-menstrual week | 3.87*** | 2.30 | 6.54 | 0.53 | 0.20 | 1.18 |
| Week of menses | 1.79 | 0.89 | 3.59 | 6.85*** | 3.84 | 12.22 |
Note: CI = confidence interval.
p < .001.
Level differences between 7-day recall and aggregated daily scores
As shown in Figure 2, the mean 7-day recall scores were consistently higher than aggregated daily scores for all PRO domains (ps < .001). On average, the 7-day recall scores exceeded aggregated daily scores by 6.6 T-scores (anger), 6.2 T-scores (fatigue), 4.2 T-scores (depression), and 0.48 points (pain, 11-point NRS). However, the magnitude of the level difference varied significantly (ps < .001) by temporal trend for anger, χ2(2) = 15.84, fatigue, χ2(2) = 11.04, depression, χ2(2) = 28.15, and pain, χ2(2) = 18.34. Specifically, the level differences were significantly more pronounced for recall periods with a positive temporal trend compared to a flat trend (ps < .05 except fatigue, ns), and they were significantly more pronounced for negative temporal trends compared to flat trends (ps < .01 for all PRO domains). No significant effects were found when comparing level differences between positive and negative trends (all ps > .08).
Figure 2.
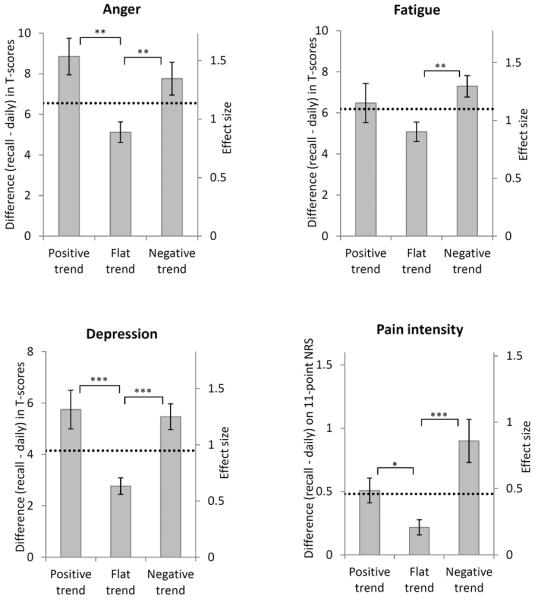
Mean level difference between 7-day recall and aggregated daily scores by type of temporal trend during the recall period. Error bars represent standard errors. Horizontal lines represent the overall level difference across all temporal trends. Effect sizes represent the level difference relative to the standard deviation of difference scores. * p < .05; ** p < .05; *** p < .001.
To evaluate whether the results could be explained by differences in overall PRO severity between the temporal trends, we repeated the analyses controlling for overall PRO levels (the average of daily and recall PRO ratings, entered as a continuous covariate). The pattern of results remained unchanged (anger, χ2[2]= 17.60, p< .001; fatigue, χ2[2]= 10.72, p< .01; depression, χ2[2]= 27.12 p< .001; pain, χ2[2]= 8.10, p = .02). The possibility that the effects of temporal trends could be moderated by PRO severity was also explored by examining interactions between the temporal trends and PRO severity levels for each domain; no significant interaction effects were found.
Correlations between 7-day recall and aggregated daily scores
Correlations between 7-day recall and aggregated daily scores were ≥ .80 when temporal trends were not distinguished (Table 4). However the magnitude of correlations varied significantly by type of temporal trend for all domains (ps< .05) except for anger (p = .14; see Table 4). In pairwise comparisons, the correlations were found to be lower for positive than for flat trends (ps< .05 for fatigue and pain, p = .07 for depression), and lower for negative than for flat trends (ps< .05 for fatigue, depression, and pain), with no significant differences between positive and negative trends (ps ≥ .39).
Table 4.
Correlations between 7-day recall and aggregated daily diaries by type of temporal trend during the recall period
|
|
Correlations for each type of temporal trend |
Difference between correlations |
|||
|---|---|---|---|---|---|
| Overall | Positive trend | Flat trend | Negative trend | χ2 (df = 2) | |
| Anger | .80 | .74 | .84 | .76 | 3.89 |
| Fatigue | .82 | .75a | .87ab | .79b | 6.80* |
| Depression | .86 | .84 | .90a | .81a | 6.23* |
| Pain intensity | .89 | .86a | .96ab | .83b | 17.58*** |
Note: Row correlations sharing the same subscript are significantly different from each other at p < .05.
p < .05;
p < .001.
Discussion
Recall PRO assessments of a week or more are often used to evaluate the course and development of health-related quality of life and to determine treatment effects in clinical trials. However, to date little is known about the accuracy of recall under conditions of symptomatic change. The concern addressed in this study is that recall reports might be influenced by temporal trends in symptom intensity occurring over the course of the recall period. We identified three classes of recall periods with “flat”, positive, and negative trends in the sample of women with premenstrual symptoms, consistently for four PRO domains (anger, fatigue, depression, pain intensity). The temporal trends varied significantly by the weeks of the menstrual cycle, supporting validity of the classification of recall periods.
We found that temporal trends predicted the differences in symptom levels between 7-day recall and aggregated diaries for each PRO domain. Overall, symptom intensities were higher in recall compared with aggregated daily scores; an effect that has been consistently observed in previous studies [1,8,19,38]. However, whereas some studies have suggested that this may simply be a constant shift due to the different lengths of time-periods covered by the reports [8,38,39], our results showed that the level difference was significantly more pronounced when there was either a positive or negative trend compared to a flat trend during the recall period. That is, participants rated their symptoms higher (relative to aggregated daily scores) when they had experienced improvement or worsening of symptoms than when their symptoms were relatively constant over the 7-day period. The effect was of similar magnitude for positive and negative trends.
These temporal trend effects are partially in accordance with predictions by the “peak-end” rule, which suggests that people disproportionately attend to the highest (peak) and most recent (end) symptom levels in recall [40,41]. For positive temporal trends in particular, the peak-end rule predicts inflated symptom levels in recall reports, given that the period changes toward the highest symptom intensity (with a higher “peak” and higher “end”); our findings are in line with this. On the other hand, somewhat contradicting the peak-end rule, we found the same effect for negative temporal trends, which end in the least intense symptom levels. One possible explanation for this finding is that women may have remembered both positive and negative temporal trends as being more intrusive to their wellbeing, and, thus, evaluated them as more aversive in recall. This corresponds with the notion that people strive to maintain homeostasis in wellbeing, such that symptom shifts are especially salient in memory [42]. Similarly, prior research has documented that patients who experience greater symptom variability (though not due to temporal trends) recall the average symptom intensity at higher levels [6,43,44].
In addition to the effects on recalled symptom levels, we found that the correspondence between 7-day recall and aggregated daily scores was diminished when participants experienced a positive or negative trend compared to a flat trend. From a cognitive perspective, forming an accurate summary rating may be more effortful and mentally challenging when symptoms change than when they are relatively constant. This could result in recall reports that contain more error or “noise”. Our findings are in line with this prediction: the lower correlations for periods with positive and negative trends indicate that recall reports explained less of the “actual” variance in aggregated daily ratings, and, thus, one interpretation is that the recall ratings contained more error variance in the presence of temporal trends.
Our findings have potential implications for the assessment of change, for example, in intervention research. A concern is that the validity of observed change between recall periods may be threatened if patients provide recall ratings in the context of changing temporal trends. For instance, patients may have relatively stable symptoms (a “flat” trend) during the baseline assessment of a clinical trial, but may experience improvement (a “negative” trend) due to the treatment proximal to the post-treatment assessment. If this happened, then the actual treatment effect could potentially be masked by a concomitant effect that is due to the shift in temporal trends between the assessment periods. In addition, if recall ratings contain more “error variance” in the presence of temporal trends, this could further reduce the statistical power to detect significant change due to treatment. A possible remedy is to ask patients directly about temporal trends during the recall period in order to correct the assessments. However, retrospective judgments of change are themselves subject to recall bias and have been found to be only modestly associated with change derived from diary assessments [7,45].
The findings must be viewed in the context of several study limitations. The sample involved women with premenstrual symptoms who may be accustomed to temporal trends in symptom levels. The results need to be replicated with other medical conditions and in settings where change is less predictable, most importantly, in response to medical treatment. Data were collected over the Internet and results may not generalize to other assessment modalities or to populations without Internet access, though we think this is unlikely. Additional research is needed to better understand to what extent background variables such as age, education level, or general mental and physical health impact the accuracy of recall reports. Furthermore, daily diaries were used to extract temporal trends in symptoms and served as the standard of comparison to examine the accuracy of 7-day recall. The use of daily diaries relies on patient memory (thus introducing potential bias), even though research has shown that information from daily reports corresponds highly with the average of multiple momentary assessments during the day [46–48]. Finally, our analyses address only the accuracy of 7-day recall, and the effects of temporal trends may well be different for longer (e.g., a month) or shorter (e.g., a single day) recall periods.
In conclusion, this study provided evidence that the accuracy of 7-day recall PROs can be threatened by a “temporal trend” effect. Both positive and negative temporal trends in symptom intensity during the recall period were associated with poorer agreement (level differences and correlations) between recall and aggregated daily reports. The findings were evident for anger, depression, fatigue, and pain intensity, suggesting that they generalize across various PRO domains. Research is needed to replicate the results in other medical conditions and to examine the potential impact of this “trend effect” in clinical trials.
Acknowledgements
This research was supported by a grant from the National Institutes of Health (1 U01AR057948-01). We thank Laura Wolff, Gim Yen Toh, and Lauren Cody for their assistance with data collection.
Footnotes
Publisher's Disclaimer: This is a PDF file of an unedited manuscript that has been accepted for publication. As a service to our customers we are providing this early version of the manuscript. The manuscript will undergo copyediting, typesetting, and review of the resulting proof before it is published in its final citable form. Please note that during the production process errors may be discovered which could affect the content, and all legal disclaimers that apply to the journal pertain.
Disclosures AAS is a Senior Scientist with the Gallup Organization and a Senior Consultant with ERT, inc. JEB has the conflicts due to her relationship with AAS.
Quadratic change models were also explored but yielded no subgroups with notable curvilinear trends; therefore, they were not considered further.
In those cases where the recall assessment was completed a day late, the applicable 7 daily scores of the recall period were used in the analyses.
References
- [1].Broderick JE, Schwartz JE, Vikingstad G, Pribbernow M, Grossman S, Stone AA. The accuracy of pain and fatigue items across different reporting periods. Pain. 2008;139:146–57. doi: 10.1016/j.pain.2008.03.024. [DOI] [PMC free article] [PubMed] [Google Scholar]
- [2].Stull DE, Leidy NK, Parasuraman B, Chassany O. Optimal recall periods for patient-reported outcomes: challenges and potential solutions. Curr Med Res Opin. 2009;25:929–42. doi: 10.1185/03007990902774765. [DOI] [PubMed] [Google Scholar]
- [3].Cella D, Riley W, Stone A, Rothrock N, Reeve B, Yount S, et al. The Patient-Reported Outcomes Measurement Information System (PROMIS) developed and tested its first wave of adult self-reported health outcome item banks: 2005–2008. Journal of clinical epidemiology. 2010;63:1179–94. doi: 10.1016/j.jclinepi.2010.04.011. [DOI] [PMC free article] [PubMed] [Google Scholar]
- [4].Schwarz N. Retrospective and concurrent self-reports: The rationale for real-time data capture. In: Stone AA, Shiffman SS, Atienza A, Nebeling L, editors. The science of real-time data capture: Self-reports in health research. Oxford University Press; New York: 2007. pp. 11–26. [Google Scholar]
- [5].Stone AA, Broderick JE, Kaell AT, DelesPaul PAEG, Porter LE. Does the peak-end phenomenon observed in laboratory pain studies apply to real-world pain in rheumatoid arthritics? J Pain. 2000;1:212–7. doi: 10.1054/jpai.2000.7568. [DOI] [PubMed] [Google Scholar]
- [6].Stone AA, Schwartz JE, Broderick JE, Shiffman SS. Variability of momentary pain predicts recall of weekly pain: A consequence of the peak (or salience) memory heuristic. Pers Soc Psychol B. 2005;31:1340–6. doi: 10.1177/0146167205275615. [DOI] [PubMed] [Google Scholar]
- [7].Stone AA, Broderick JE, Shiffman SS, Schwartz JE. Understanding recall of weekly pain from a momentary assessment perspective: absolute agreement, between- and within-person consistency, and judged change in weekly pain. Pain. 2004;107:61–9. doi: 10.1016/j.pain.2003.09.020. [DOI] [PubMed] [Google Scholar]
- [8].Broderick JE, Schneider S, Schwartz JE, Stone AA. Interference with activities due to pain and fatigue: accuracy of ratings across different reporting periods. Qual Life Res. 2010;19:1163–70. doi: 10.1007/s11136-010-9681-x. [DOI] [PMC free article] [PubMed] [Google Scholar]
- [9].Bennett AV, Patrick DL, Bushnell DM, Chiou CF, Diehr P. Comparison of 7-day and repeated 24-h recall of type 2 diabetes. Qual Life Res. 2011;20:769–77. doi: 10.1007/s11136-010-9791-5. [DOI] [PubMed] [Google Scholar]
- [10].Stel VS, Smit JH, Pluijm SMF, Visser M, Deeg DJH, Lips P. Comparison of the LASA Physical Activity Questionnaire with a 7-day diary and pedometer. Journal of clinical epidemiology. 2004;57:252–8. doi: 10.1016/j.jclinepi.2003.07.008. [DOI] [PubMed] [Google Scholar]
- [11].Jamison RN, Raymond SA, Slawsby EA, McHugo GJ, Baird JC. Pain assessment in patients with low back pain: comparison of weekly recall and momentary electronic data. J Pain. 2006;7:192–9. doi: 10.1016/j.jpain.2005.10.006. Epub 2006/03/07. [DOI] [PubMed] [Google Scholar]
- [12].Ariely D. Combining experiences over time: The effects of duration, intensity changes and on-line measurements on retrospective pain evaluations. Journal of Behavioral Decision Making. 1998;11:19–45. [Google Scholar]
- [13].Ariely D, Carmon Z. Gestalt characteristics of experiences: The defining features of summarized events. Journal of Behavioral Decision Making. 2000;13:191–201. [Google Scholar]
- [14].Loewenstein GF, Prelec D. Preferences for Sequences of Outcomes. Psychological Review. 1993;100:91–108. [Google Scholar]
- [15].Hsee CK, Abelson RP. Velocity Relation - Satisfaction as a Function of the 1st Derivative of Outcome over Time. J Pers Soc Psychol. 1991;60:341–7. [Google Scholar]
- [16].Pritchard RM, Heron W. Visual-Perception Approached by the Method of Stabilized Images. Canadian Journal of Psychology. 1960;14:67–77. doi: 10.1037/h0083168. [DOI] [PubMed] [Google Scholar]
- [17].Dickerson LM, Mazyck PJ, Hunter MH. Premenstrual syndrome. American family physician. 2003;67:1743–52. [PubMed] [Google Scholar]
- [18].Freeman EW. Premenstrual syndrome and premenstrual dysphoric disorder: definitions and diagnosis. Psychoneuroendocrinology. 2003;28(Supplement 3):25–37. doi: 10.1016/s0306-4530(03)00099-4. [DOI] [PubMed] [Google Scholar]
- [19].Schneider S, Choi SW, Junghaenel DU, Schwartz JE, Stone AA. Psychometric characteristics of daily diaries for the Patient Reported Outcomes Measurement Information System (PROMIS®): a preliminary investigation. Qual Life Res. doi: 10.1007/s11136-012-0323-3. in press (DOI 10.1007/s11136-012-0323-3) [DOI] [PMC free article] [PubMed] [Google Scholar]
- [20].Lai JS, Cella D, Choi S, Junghaenel DU, Christodoulou C, Gershon R, et al. How item banks and their application can influence measurement practice in rehabilitation medicine: a PROMIS fatigue item bank example. Arch Phys Med Rehabil. 2011;92:S20–7. doi: 10.1016/j.apmr.2010.08.033. Epub 2011/10/14. [DOI] [PMC free article] [PubMed] [Google Scholar]
- [21].Pilkonis PA, Choi SW, Reise SP, Stover AM, Riley WT, Cella D, et al. Item Banks for Measuring Emotional Distress From the Patient-Reported Outcomes Measurement Information System (PROMIS (R)): Depression, Anxiety, and Anger. Assessment. 2011;18:263–83. doi: 10.1177/1073191111411667. [DOI] [PMC free article] [PubMed] [Google Scholar]
- [22].DeWalt DA, Rothrock N, Yount S, Stone AA. Evaluation of item candidates - The PROMIS qualitative item review. Med Care. 2007;45:S12–S21. doi: 10.1097/01.mlr.0000254567.79743.e2. [DOI] [PMC free article] [PubMed] [Google Scholar]
- [23].Reeve BB, Hays RD, Bjorner JB, Cook KF, Crane PK, Teresi JA, et al. Psychometric evaluation and calibration of health-related quality of life item banks - Plans for the patient-reported outcomes measurement information system (PROMIS) Med Care. 2007;45:S22–S31. doi: 10.1097/01.mlr.0000250483.85507.04. [DOI] [PubMed] [Google Scholar]
- [24].Choi SW, Reise SP, Pilkonis PA, Hays RD, Cella D. Efficiency of static and computer adaptive short forms compared to full-length measures of depressive symptoms. Qual Life Res. 2010;19:125–36. doi: 10.1007/s11136-009-9560-5. [DOI] [PMC free article] [PubMed] [Google Scholar]
- [25].Liu H, Cella D, Gershon R, Shen J, Morales LS, Riley W, et al. Representativeness of the Patient-Reported Outcomes Measurement Information System Internet panel. Journal of clinical epidemiology. 2010;63:1169–78. doi: 10.1016/j.jclinepi.2009.11.021. [DOI] [PMC free article] [PubMed] [Google Scholar]
- [26].Revicki DA, Kawata AK, Harnam N, Chen WH, Hays RD, Cella D. Predicting EuroQol (EQ-5D) scores from the patient-reported outcomes measurement information system (PROMIS) global items and domain item banks in a United States sample. Qual Life Res. 2009;18:783–91. doi: 10.1007/s11136-009-9489-8. [DOI] [PMC free article] [PubMed] [Google Scholar]
- [27].Farrar JT, Young JP, Jr, LaMoreaux L, Werth JL, Poole RM. Clinical importance of changes in chronic pain intensity measured on an 11-point numerical pain rating scale. Pain. 2001;94:149–58. doi: 10.1016/S0304-3959(01)00349-9. Epub 2001/11/03. [DOI] [PubMed] [Google Scholar]
- [28].Nagin DS. Analyzing developmental trajectories: A semiparametric, group-based approach. Psychological methods. 1999;4:139–57. doi: 10.1037/1082-989x.6.1.18. [DOI] [PubMed] [Google Scholar]
- [29].Jung T, Wickrama KAS. An introduction to latent class growth analysis and growth mixture modeling. Social and Personality Compass. 2008;2:302–17. [Google Scholar]
- [30].Nagin DS, Odgers CL. Group-Based Trajectory Modeling in Clinical Research. Annu Rev Clin Psycho. 2010;6:109–38. doi: 10.1146/annurev.clinpsy.121208.131413. [DOI] [PubMed] [Google Scholar]
- [31].Muthén B, Muthén LK. Integrating person-centered and variable-centered analyses: Growth mixture modeling with latent trajectory classes. Alcohol Clin Exp Res. 2000;24:882–91. [PubMed] [Google Scholar]
- [32].Muthén BO, Satorra A. Complex sample data in structural equation modeling. Sociol Methodol. 1995;25:267–316. [Google Scholar]
- [33].Hipp JR, Bauer DJ. Local solutions in the estimation of growth mixture models. Psychological methods. 2006;11:36–53. doi: 10.1037/1082-989X.11.1.36. Epub 2006/04/06. [DOI] [PubMed] [Google Scholar]
- [34].Nylund KL, Asparoutiov T, Muthen BO. Deciding on the number of classes in latent class analysis and growth mixture modeling: A Monte Carlo simulation study. Struct Equ Modeling. 2007;14:535–69. [Google Scholar]
- [35].Vermunt JK. Latent Class Modeling with Covariates: Two Improved Three-Step Approaches. Polit Anal. 2010;18:450–69. [Google Scholar]
- [36].Asparouhov T, Muthén B. Auxiliary variables in mixture modeling: a 3-step approach using Mplus. Retrieved February 2013 from http://www.statmodel.com/examples/webnote.shtml2013.
- [37].Muthén LK, Muthén BO. Mplus user's guide. 7th ed Muthén & Muthén; Los Angeles, CA: 1998–2012. [Google Scholar]
- [38].Watson D, Clark LA, Tellegen A. Development and Validation of Brief Measures of Positive and Negative Affect - the Panas Scales. J Pers Soc Psychol. 1988;54:1063–70. doi: 10.1037//0022-3514.54.6.1063. [DOI] [PubMed] [Google Scholar]
- [39].Keller SD, Bayliss MS, Ware JE, Hsu MA, Damiano AM, Goss TF. Comparison of responses to SF-36 Health Survey questions with one-week and four-week recall periods. Health Serv Res. 1997;32:367–84. [PMC free article] [PubMed] [Google Scholar]
- [40].Fredrickson BL. Extracting meaning from past affective experiences: The importance of peaks, ends, and specific emotions. Cognition Emotion. 2000;14:577–606. [Google Scholar]
- [41].Redelmeier DA, Katz J, Kahneman D. Memories of colonoscopy: a randomized trial. Pain. 2003;104:187–94. doi: 10.1016/s0304-3959(03)00003-4. [DOI] [PubMed] [Google Scholar]
- [42].Cummins RA. Normative life satisfaction: measurement issues and a homeostatic model. Social Indicators Research. 2003;64:225–56. [Google Scholar]
- [43].Kikuchi H, Yoshiuchi K, Miyasaka N, Ohashi K, Yamamoto Y, Kumano H, et al. Reliability of recalled self-report on headache intensity: investigation using ecological momentary assessment technique. Cephalalgia. 2006;26:1335–43. doi: 10.1111/j.1468-2982.2006.01221.x. [DOI] [PubMed] [Google Scholar]
- [44].Houtveen JH, Oei NY. Recall bias in reporting medically unexplained symptoms comes from semantic memory. Journal of psychosomatic research. 2007;62:277–82. doi: 10.1016/j.jpsychores.2006.11.006. Epub 2007/02/28. [DOI] [PubMed] [Google Scholar]
- [45].McPhail S, Haines T. Response shift, recall bias and their effect on measuring change in health-related quality of life amongst older hospital patients. Health and Quality of Life Outcomes. 2010;8:65. doi: 10.1186/1477-7525-8-65. [DOI] [PMC free article] [PubMed] [Google Scholar]
- [46].Schneider S, Stone AA, Schwartz JE, Broderick JE. Peak and End Effects in Patients' Daily Recall of Pain and Fatigue: A Within-Subjects Analysis. J Pain. 2011;12:228–35. doi: 10.1016/j.jpain.2010.07.001. [DOI] [PMC free article] [PubMed] [Google Scholar]
- [47].Broderick JE, Schwartz JE, Schneider S, Stone AA. Can End-of-Day Reports Replace Momentary Assessment of Pain and Fatigue? J Pain. 2009;10:274–81. doi: 10.1016/j.jpain.2008.09.003. [DOI] [PMC free article] [PubMed] [Google Scholar]
- [48].Jensen MP, Mardekian J, Lakshminarayanan M, Boye ME. Validity of 24-h recall ratings of pain severity: Biasing effects of “Peak” and “End” pain. Pain. 2008;137:422–7. doi: 10.1016/j.pain.2007.10.006. [DOI] [PubMed] [Google Scholar]