Abstract
Acid ceramidase (AC) is overexpressed in most prostate tumors and confers oncogenic phenotypes to prostate cancer cells. AC modulates the cellular balance between ceramide, sphingosine and sphingosine 1-phosphate (S1P). These bioactive sphingolipids have diverse, powerful and often oppositional impacts on cell signaling, including the activation status of the oncogenic kinase Akt. Our studies show that AC expression correlates with phosphorylation of Akt in human prostate tumors, and elevation of phosphorylated Akt in tumor versus patient-matched benign tissue is contingent upon AC elevation. Investigation of the mechanism for AC-induced Akt activation revealed that AC activates Akt through sphingosine kinase 1 (SphK1)-derived generation of S1P. This signaling pathway proceeds through S1P receptor 2 (S1PR2)-dependent stimulation of PI3K. Functionally, AC-overexpressing cells are insensitive to cytotoxic chemotherapy, however, these cells are more susceptible to targeted inhibition of Akt. AC-overexpressing cells proliferate more rapidly than control cells and form more colonies in soft agar; however, these effects are profoundly sensitive to Akt inhibition, demonstrating increased dependence on Akt signaling for the oncogenic phenotypes of AC-overexpressing cells. These observations may have clinical implications for targeted therapy as PI3K and Akt inhibitors emerge from clinical trials.
Keywords: acid ceramidase, sphingosine 1-phosphate, Akt, sphingolipids, sphingosine kinase
Introduction
AC has been shown to be overexpressed at the mRNA1 and protein levels2 in prostate tumors, and has been shown to mediate proliferation, chemo- and radioresistance,3, 4 and cell invasion.5 Despite the important processes mediated by AC, the signaling mechanisms underlying these oncogenic phenotypes have been understudied. AC deacylates ceramide to form sphingosine, which can be phosphorylated by sphingosine kinase (SphK)1 or SphK2 to form sphingosine 1-phosphate (S1P).6 These bioactive lipids have been shown to mediate numerous physiologic and pathologic processes. Ceramide has a well-studied role in Protein phosphatase 2A (PP2A)-mediated deactivation of Akt.7 The role of sphingosine in regulating Akt is equivocal, with reports of sphingosine-induced Akt activation8 and deactivation.9 On the other hand, S1P has been convincingly shown to activate Akt downstream of its G protein-coupled receptors (GPCRs). A number of studies ascribe oncogenic roles to S1PR1 and 3, both of which activate Akt through Gi-mediated stimulation of PI3K.10 S1PR3 also transactivates platelet-derived growth factor receptors (PDGFR) to directly stimulate PI3K.11, 12 In contrast, S1PR2 is thought to primarily couple to G12/13 to mediate Rac/Rho-dependent inhibition of cell migration, and through Rho-mediated PTEN (phosphatase and tensin homolog) activation, antagonize Akt activation.13 However, S1PR2 couples to Gi, G12/13 and Gq, and thus may mediate a diverse set of signals.14
The present study uncovers an important oncogenic signal elicited by AC. We show that AC promotes activation of Akt through SphK1-generated S1P. Interestingly, this signal depends on S1PR2-mediated stimulation of PI3K, challenging the dogma that S1PR2 is tumor-suppressive. AC overexpression confers resistance to nontargeted chemotherapies; however, the oncogenic phenotypes of AC-overexpressing cells are uniquely sensitive to Akt inhibition. This set of observations has immediate clinical implication, as the success of nascent PI3K/Akt inhibitors is likely to depend on determining which tumors are susceptible to interdiction of this pathway, as we here suggest AC-overexpressing prostate tumors may be.
Results
AC and phosphorylation of Akt correlate in prostate adenocarcinoma
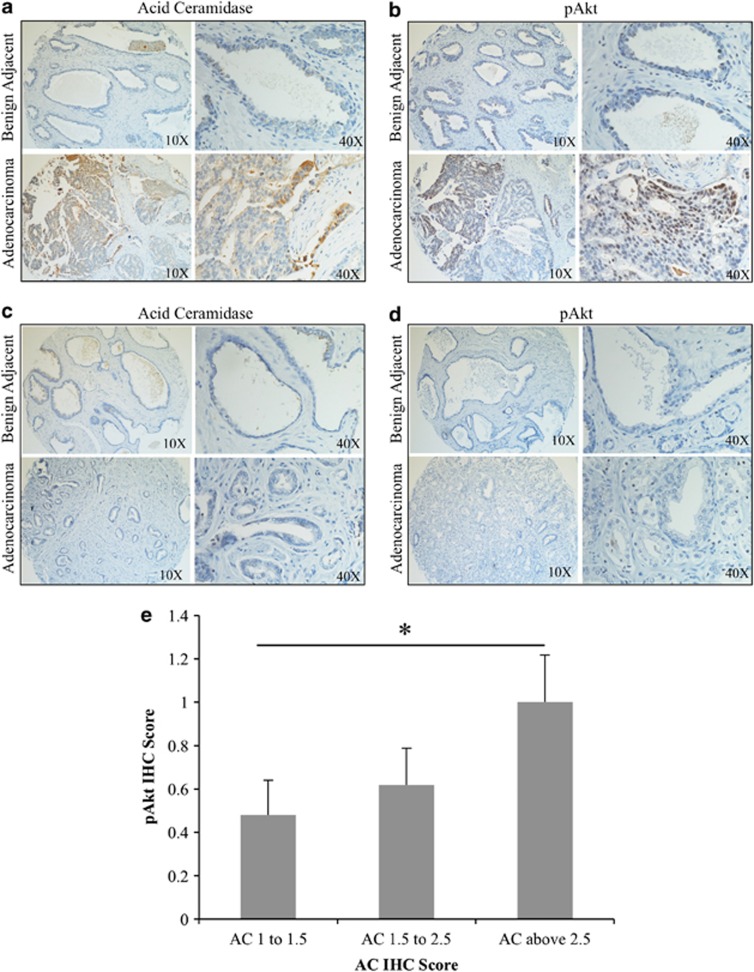
Our previous studies have demonstrated that most prostate tumors overexpress AC, compared with benign prostate tissue.15 As Akt activation is a common feature of many tumors, including prostate, we sought to determine whether there was a relationship between AC expression and Akt activation in the progression to prostate adenocarcinoma. Using a tissue microarray made up of prostate adenocarcinoma and patient-matched benign adjacent biopsy cores from 27 prostate cancer patients, we determined that the 22 patients whose tumor AC immunohistochemistry staining was elevated compared with their benign AC score (Figure 1a); 12 had the same trend in pAkt staining (Figure 1b). Conversely, none of the five patients whose tumor AC staining was not elevated compared with their benign tissue (Figure 1c) had increased pAkt staining (Figure 1d). Analysis of these data with Fisher's exact test demonstrates that pAkt elevation from benign to tumor is contingent on AC elevation, with a P-value of 0.0307. In a further analysis of 56 prostate tumors immunostained for AC and pAkt, we found that tumors which scored high (above 2.5) for AC also had elevated pAkt scoring compared with AC-low (below 1.5) tumors (Figure 1e).
Figure 1.
AC correlates with pAkt in prostate cancer. (a–d) A 27-patient tissue microarray with patient-matched prostate adenocarcinoma and adjacent benign tissue was immunostained for AC and pAkt (Ser473). Staining intensity was evaluated by a blinded pathologist. (e) A total of 56 prostate tumor biopsies were immunostained for AC and pAkt. Tumors were grouped by AC intensity as indicated in the figure, and the mean pAkt score for tumors in the indicated group is plated. *P<0.05, Student's t test.
AC activates Akt
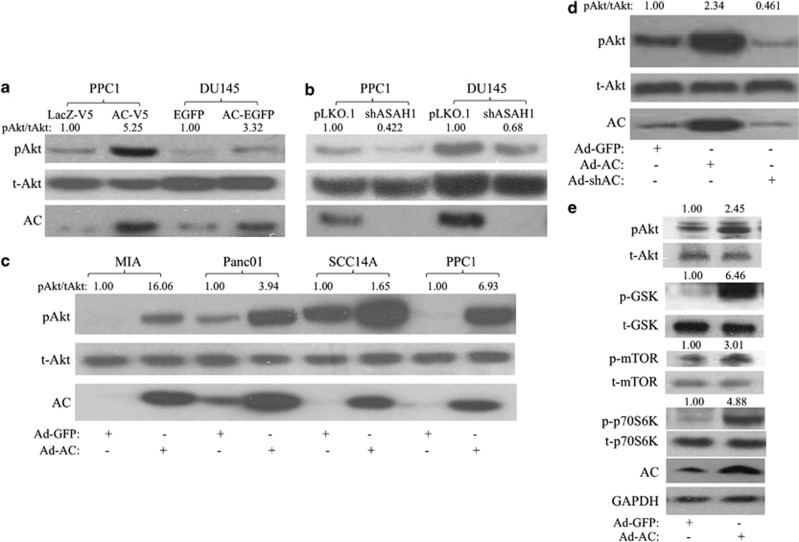
The relationship between AC and Akt activation was investigated using several approaches. We stably expressed AC in PPC1 and DU145 prostate cancer cell lines and found that high levels of AC increased phosphorylation of Akt at Serine 473 compared with vector control cells, indicating activation (Figure 2a, Supplementary Figure 1A) In cells with stable short-hairpin RNA (shRNA) knockdown of AC, we observed a reduction in basal Akt phosphorylation in both DU145 and PPC1 cells versus vector control (Figure 2b, Supplementary Figure 1B). Transient adenoviral expression of AC (Ad-AC) compared with adenoviral expression of green-fluorescent protein (Ad-GFP) also revealed increased Akt phosphorylation in MIA, Panc01, SCC14A, PPC1 (Figure 2c, Supplementary Figure 1C) and DU145 (Figure 2d, Supplementary Figure 1D) cells, suggesting a generalizable phenomenon of AC-induced Akt activation in cancer. Furthermore, shRNA delivered by adenovirus (Ad-shAC) decreased pAkt (Figure 2d, Supplementary Figure 1D). In order to validate that we are observing functional signaling through Akt when we express AC, we probed for phosphoproteins downstream of Akt (Figure 2e, Supplementary Figure 1E). We observed activation of the mammalian target of rapamycin (mTOR) pathway (p-mTOR and p-p70S6K), as well as inhibition of GSK-3beta, which is involved in regulation of cell proliferation and metabolism.16
Figure 2.
AC activates Akt. PPC1 and DU145 prostate cancer cells stably expressing (a) AC or control (PPC1: AC-V5 or LacZ-V5; DU145-AC-EGFP or EGFP), or (b) ASAH1 antisense or empty vector (shAC or pLKO.1) were analyzed by western blotting. (c) MIA, Panc01, SCC14A and PPC1 cells were infected with Ad-AC or Ad-GFP. After 48 h of infection, cells were analyzed by western blotting. (d) DU145 cells were infected with Ad-GFP, Ad-AC or Ad-shAC. After 48 h of infection, cells were analyzed by western blotting. (e) PPC1 cells were infected with Ad-AC or Ad-GFP. After 48 h of infection, cells were analyzed by western blotting. pAkt/tAkt is the ratio of phosphorylated Akt to total Akt normalized to the reference (that is, Ad-GFP is the reference of Ad-AC).
SphK1 mediates AC-induced Akt activation
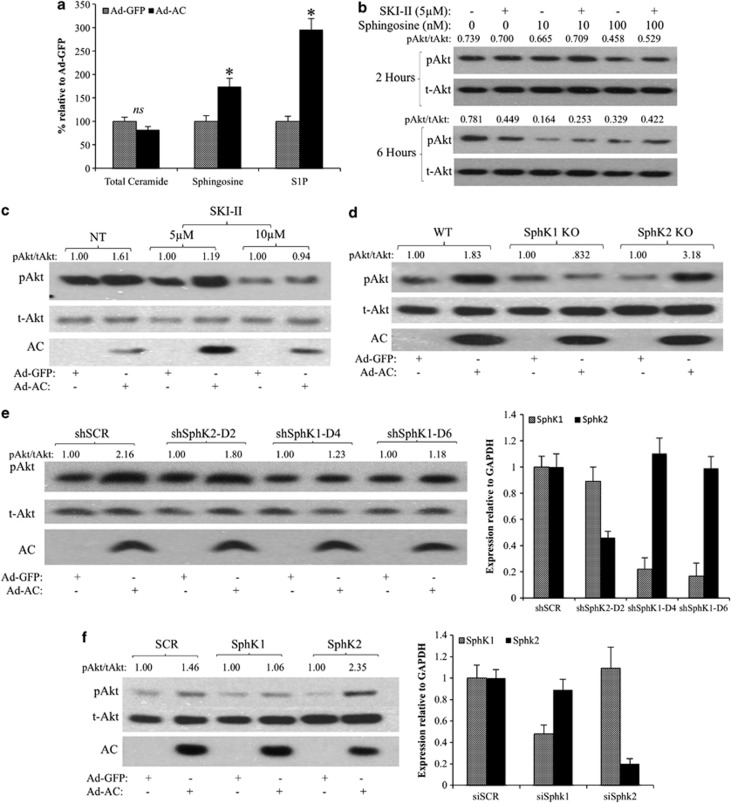
The bioactive lipids ceramide, sphingosine and S1P have all been linked to the regulation of Akt. We observed no change in total cell ceramide in Ad-AC-infected PPC1 cells compared with Ad-GFP (Figure 3a), though species-specific alterations were observed (data not shown). Sphingosine and S1P were significantly elevated in Ad-AC-infected cells (Figure 3a). In order to measure secreted S1P, we treated Ad-AC/GFP-infected PPC1 cells with C17-C6 ceramide, finding significant C17-S1P increase in the cells (Supplementary Figure 2A) and medium (Supplementary Figure 2B). Treatment of cells with exogenous sphingosine did not activate Akt, rather decreasing pAkt moderately after 6 h of treatment (Figure 3b). Addition of the dual-isoform sphingosine kinase inhibitor SKI–II decreased Akt activation at 6 h, and did not augment Akt activation alone or in combination with sphingosine (Figure 3b). We then infected PPC1 cells with Ad-AC or Ad-GFP in the presence of SKI–II, and observed a dose-dependent reduction in Akt activation (Figure 3c, Supplementary Figure 1F), suggesting that sphingosine kinase activity is necessary for AC-induced Akt activation. Infection of wild-type (WT) or sphingosine kinase 2-knocked out (SphK2 KO) mouse embryonic fibroblasts (MEFs) with Ad-AC promoted strong activation of Akt, whereas AC had no impact on Akt activation in SphK1 KO MEFs (Figure 3d, Supplementary Figure 1G). Ad-AC increased S1P cell content (Supplementary Figure 2C) and secretion into the medium (Supplementary Figure 2D) in WT and SphK2 KO MEFs, but not in SphK1 KO MEFs. To confirm the observation that SphK1 may be necessary for AC-induced Akt activation, we used shRNA (Figure 3e, Supplementary Figure 1H) and small-interfering RNA (siRNA) (Figure 3f, Supplementary Figure 1I) to knock down each SphK isoform and confirmed that knockdown of SphK1, but not SphK2, abrogated AC-induced Akt activation.
Figure 3.
SphK1 mediates AC-induced Akt activation. (a) Ad-GFP- or Ad-AC-infected PPC1 cell pellets were analyzed by LC/MS for ceramide, sphingosine and S1P. Bars represent sphingolipid level relative to Ad-GFP. *P<0.05 analyzed by Student's t-test. (b) PPC1 cells were treated for 2 h with the indicated dose of SphK inhibitor SKI–II or vehicle (dimethyl sulphoxide, DMSO) before treatment with the indicated doses of sphingosine or vehicle (EtOH). Cells were collected 2 or 6 h after addition of sphingosine, as indicated. pAkt/tAkt ratios were generated using NIH ImageJ band densitometries, and are represented as raw ratios so that multiple comparisons can be made. (c) PPC1 cells were infected with Ad-AC or Ad-GFP in the presence of the indicated dose of SKI–II. After 48 h of infection, cells were analyzed by western blotting. (d) WT, SphK1 KO and SphK2 KO MEFs were infected with Ad-AC or Ad-GFP at multiplicity of infection (MOI) 100. After 48 h of infection, cells were analyzed by western blotting. (e) PPC1 cells were transfected with nontargeting (SCR) or SphK1, or SphK2-targeting shRNA vectors. After 6 h of transfection, cells were infected with Ad-GFP or Ad-AC. After 48 h of infection, cells were analyzed by western blotting and qRT–PCR. (f) PPC1 cells were transfected with nontargeting (SCR) or SphK1, or Sphk2-targeting siRNA. After 6 h of transfection, cells were infected with Ad-GFP or Ad-AC. After 48 h of infection, cells were analyzed by western blotting and qRT–PCR.
S1PR2 stimulates PI3K to activate Akt
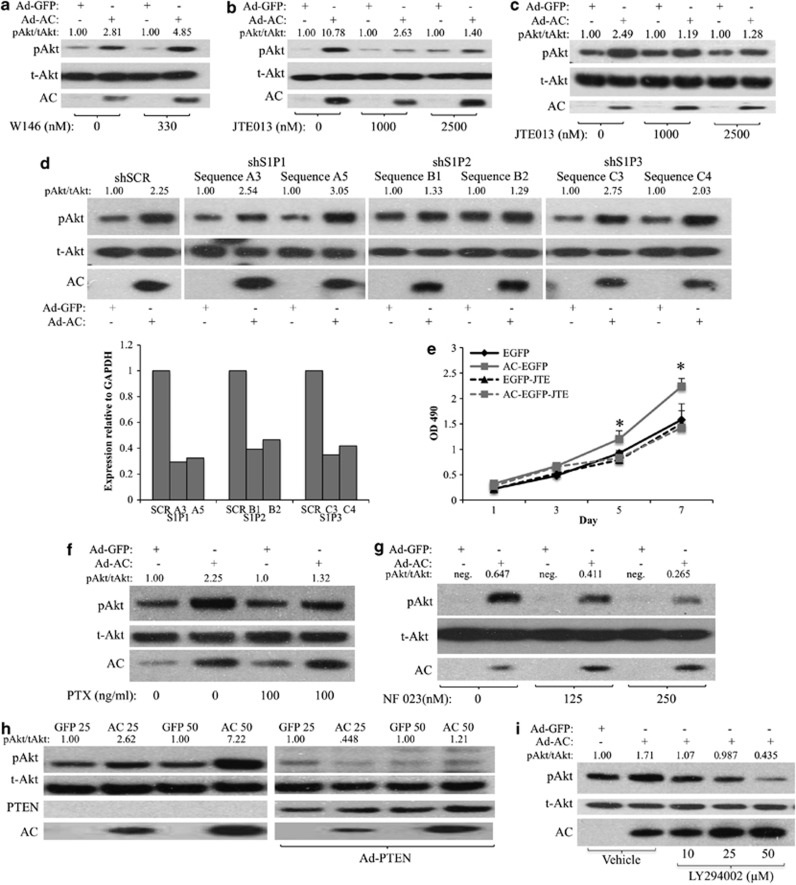
To determine whether AC/S1P-induced Akt activation was mediated by S1PRs, we expressed AC in PPC1 cells in the presence of the S1PR1 antagonist W146, or the S1PR2 antagonist JTE013. Whereas W146 had no impact on reducing AC-induced Akt activation (Figure 4a, Supplementary Figure 1J), JTE013 strongly inhibited AC-induced Akt activation (Figure 4b, Supplementary Figure 1K). W146 was validated in Supplementary Figure 3. Similarly, AC-induced Akt activation was also prevented by JTE013 in WT MEFs, confirming that this phenomenon is intact in PTEN-positive as well as PTEN-negative (PPC1) cells (Figure 4c, Supplementary Figure 1l). When we transfected PPC1 cells with shRNA sequences against S1PR1, S1PR2 or S1PR3, Ad-AC-induced Akt activation was unaffected in multiple S1PR1- and 3-knocked down cells, despite 60–70% reduction in mRNA (Figure 4d, Supplementary Figures 1M and 6). Both S1PR2 shRNA sequences greatly reduced Ad-AC-induced Akt activation, confirming a prominent role for S1PR2 signaling in the activation of Akt downstream of AC. As the observation that S1PR2 activates an oncogenic signaling pathway challenges the dogma on the role of S1PR2 in cancer cell signaling, we performed a proliferation experiment and found that the proliferation advantage of AC-overexpressing prostate cancer cells is diminished by treatment with JTE013 (Figure 4e). Basal S1PR1–3 expression was evaluated in PPC1 and DU145, both of which had predominate S1PR2 mRNA with markedly less S1PR1 and 3 (Supplementary Figure 4A). Further analysis revealed that S1PR2 mRNA is induced slightly (1.3–2 fold), but significantly, upon AC expression (Supplementary Figure 4B), whereas the other ceramidases are not affected by AC expression, except for a reduction in ACER1 mRNA in PPC1 (Supplementary Figure 4C). S1PRs are GPCRs known to stimulate Akt activation by activating Gi-mediated stimulation of PI3K. Pertussis toxin, which inactivates Gi, G0 and Gt, prevented AC-induced Akt activation (Figure 4f Supplementary Figure 1N), and the Gi inhibitor NF023 abrogated AC-induced Akt activation (Figure 4g), suggesting a role for G proteins, specifically Gi, in AC-induced Akt activation. Expressing PTEN in PPC1 cells antagonized AC-induced Akt activation (Figure 4h, Supplementary Figure 1O), and the PI3K inhibitor LY294002 effected dose-dependent abrogation of pAkt (Figure 4i, Supplementary Figure 1P), supporting an S1PR2, PI3K-dependent mechanism. To test whether exogenous S1P works in the same way on these cell lines, we treated PPC1 and DU145 with 500 nℳ S1P for 2 h in the presence or absence of JTE013 (Supplementary Figure 5). JTE013 blocked S1P-induced Akt activation in both cell lines, supporting the findings using AC expression to drive increased S1P signaling.
Figure 4.
S1PR2 stimulates PI3K to activate Akt. (a and b) PPC1 cells were infected with Ad-AC or Ad-GFP. After 6 h, cells were treated with the indicated dose of either (a) W146 or (b) JTE013. After 48 h of infection, cells were analyzed by western blotting. (c) WT MEFs were infected with Asd-AC or Ad-GFP (MOI 100). After 6 h, cells were treated with the indicated dose of JTE013. After 48 h, cells were collected for western blotting. (d) PPC1 cells were transfected with nontargeting (SCR) or S1PR1–3-targeting shRNA vectors. After 6 h of transfection, cells were infected with Ad-GFP or Ad-AC. After 48 h of infection, cells were analyzed by western blotting and qRT–PCR. (e) DU145 EGFP and AC-EGFP cells were plated at low density in 96-well plates in the presence or absence of 1 μℳ JTE013, and analyzed by MTS assay on the indicated days. Statistical analysis was performed using a one-way ANOVA with Bonferroni correction, *P<0.05. PPC1 cells were infected with Ad-AC or Ad-GFP. After 24 h, cells were treated with the indicated dose of (f) pertussis toxin, (g) NF023 and (i) LY294002. After another 24 h, cells were analyzed by western blotting. (h) PPC1 cells were coinfected with Ad-AC or Ad-GFP and Ad-PTEN (MOI 20), as indicated; after 48 h cells were analyzed by western blotting.
AC promotes chemotherapy resistance, but confers sensitivity to Akt inhibition
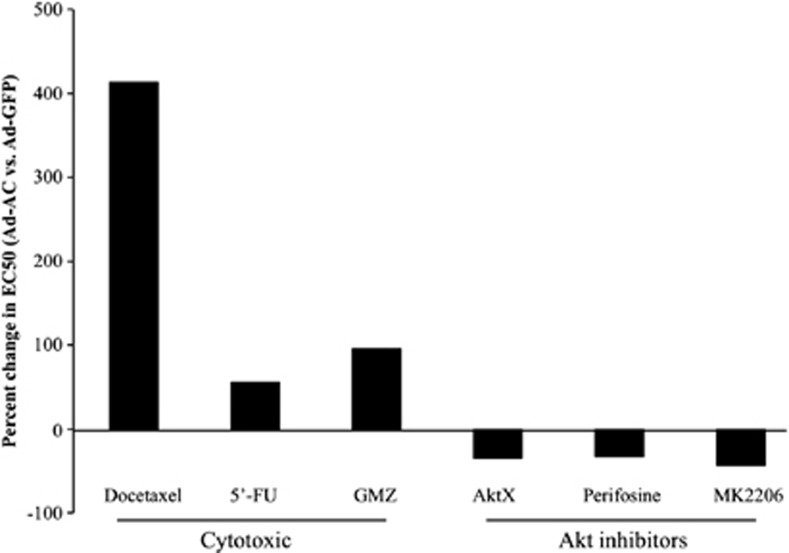
Cytotoxic chemotherapy depends, in part, on ceramide accumulation to cause cell death.17, 18, 19 PPC1 cells were subjected to a wide dose range of the cytotoxic chemotherapeutic agents Docetaxel, Gemcitabine and 5′-Fluorouracil. PPC1 cells infected with Ad-AC were found to be less sensitive to all the three compounds (Docetaxel: 413%, Gemcitabine: 55% and 5′-Fluorouracil: 96% less sensitive), reflected by an increased EC50 (Figure 5, Table 1). Conversely, AC-overexpressing cells were more sensitive to inhibition of Akt with Akt inhibitor X (AktX), Perifosine or MK2206, with AC-expressing cells being ∼30–40% more sensitive than Ad-GFP-infected cells.
Figure 5.
AC promotes chemotherapy resistance, but confers sensitivity to Akt inhibition. (a) PPC1 cells infected 24 h prior with Ad-GFP, or Ad-AC were treated with various doses of the indicated compounds. After 48 h, cell viability was measured by MTS assay. Prism software was used to calculate the EC50 of each compound (Table 1) and the EC50 of Ad-AC-infected cells was compared with that of Ad-GFP-infected cells to determine the percent change in EC50 of Ad-AC-infected cells.
Table 1. EC50 of various compounds.
| Ad-GFP | Ad-AC | |
|---|---|---|
| Docetaxel (nℳ) | 1.89 | 9.74 |
| 5′-Fu (μℳ) | 4.36 | 6.8 |
| GMZ (μℳ) | 31.8 | 62.45 |
| AktX (μℳ) | 13.7 | 8.92 |
| Perifosine (μℳ) | 29.54 | 19.89 |
| MK 2206 (μℳ) | 3.5 | 1.97 |
Abbreviations: AC, acid ceramidase; Ad-AC, adenoviral expression of AC; 5′-Fu, Fluorouracil, GMZ, Gemcitabine.
Proliferation in AC-overexpressing cells is profoundly sensitive to Akt inhibition
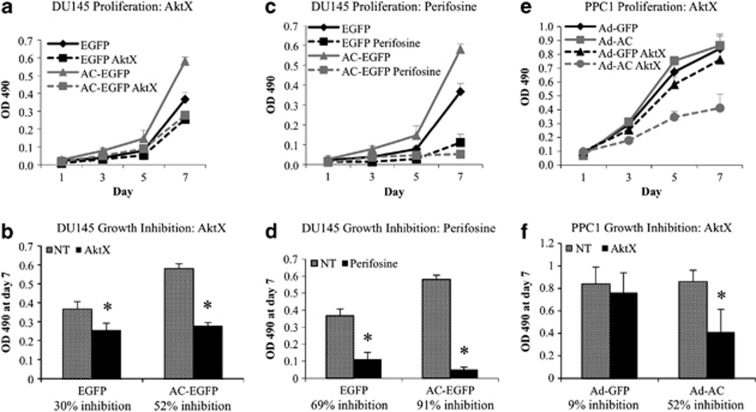
Akt signaling promotes cancer in numerous ways, including increased cell proliferation. To determine whether AC-induced proliferation is Akt-dependent, we evaluated prostate cancer cell proliferation in the presence of AktX and Perifosine. In DU145-AC-EGFP cells stably expressing AC, we noted significantly more rapid cell proliferation compared with the vector control (Figure 6a). Treatment with AktX (Figure 6a) and Perifosine (Figure 6c) both reduced proliferation in AC-EGFP and EGFP cell lines. However, directly comparing cell number on day 7 revealed that AktX and Perifosine more strongly inhibited proliferation in AC-EGFP cells (Figures 6b and d). EGFP cell proliferation was reduced 30% (AktX) and 52% (Perifosine), whereas AC-EGFP cell proliferation was reduced 52% (AktX) and 91% (Perifosine). The same effect was observed in PPC1 cells infected with Ad-AC, in which AktX inhibited cell proliferation 52%, in contrast to Ad-GFP-infected cells, which had no significant reduction in cell number compared with untreated cells (Figures 6e and f).
Figure 6.
Proliferation in AC-overexpressing cells is profoundly sensitive to Akt inhibition. (a, c, e) 500 cells were plated on 96-well plates of DU145-AC-EGFP and EGFP (a, c), or PPC1 cells infected with Ad-GFP or Ad-AC (e). After overnight cell attachment, cells were treated with 2.5 μℳ AktX (a, e) or 5 μℳ Perifosine (c). On the indicate day, MTS assay was used to determine relative cell proliferation. (b, d, f) OD 490 values on day 7 were compared and used to calculate the percent inhibition in cell proliferation in each cell type by the indicated compound. *P<0.05 calculated by the Student's t-test.
AC-induced Akt signaling promotes soft agar-colony formation
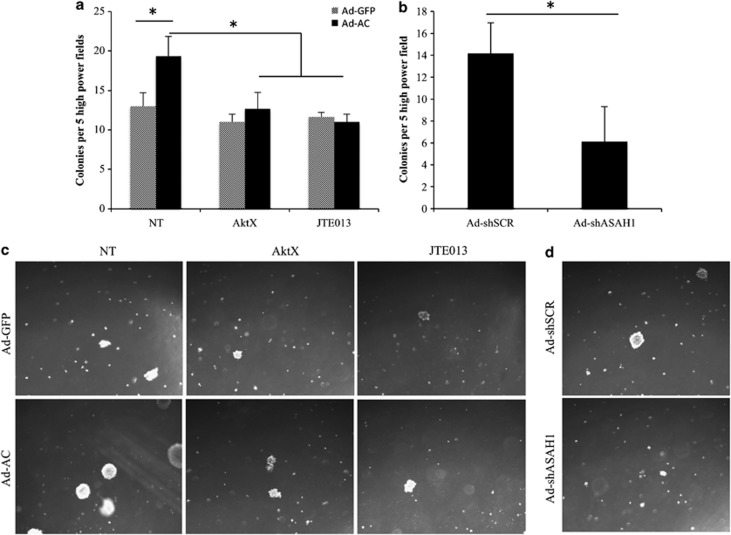
Anchorage-independent growth is a hallmark of oncogenic potential. PPC1 cells infected with Ad-AC formed more colonies on soft agar compared with Ad-GFP-infected cells (Figures 7a and c). Interestingly, while inhibition of Akt signaling with AktX and JTE013, the S1PR2 antagonist did not have an impact on soft agar-colony formation in Ad-GFP-infected PPC1 cells, Ad-AC-infected cells were sensitive to both Akt inhibition and S1PR2 antagonism, consistent with the hypothesis that AC-induced Akt activation is oncogenic. Similarly, when cells were infected with an adenovirus delivering an anti-AC short hairpin, Ad-shASAH1, fewer colonies were formed than when cells were infected with nontargeting shRNA (Figures 7b and d).
Figure 7.
AC-induced Akt signaling promotes soft agar-colony formation. (a, b) PPC1 cells were infected with Ad-GFP, Ad-AC (MOI 50), Ad-shSCR or Ad-shASAH1 (MOI 20) 1 day prior to plating on six-well plates in a total volume of 4 ml soft agar. (a) Four hours after plating, 5 μℳ JTE013, 10 μℳ AktX or vehicle (DMSO) was added in 1 ml complete medium. Colonies, represented in (c, d), were counted 2 weeks after plating.
Discussion
AC occupies a powerful position in the balance between ceramide, sphingosine and S1P. As AC is frequently overexpressed in prostate cancer and multiple other malignancies,15, 20, 21 understanding the dominant downstream signaling consequences of the impact of AC on the ceramide–sphingosine–S1P balance is of great interest. AC expression did not reduce total ceramide, as one might predict; however, species-specific alterations were prominent, particularly reduced C16 ceramide and increased C24 and C24:1 (data not shown). The lack of impact on total ceramide diminished the likelihood that alterations in ceramide-mediated PP2A signaling were responsible for increased Akt activation. Literature on the direct impact of sphingosine on Akt activation is sparse. One report demonstrated in hepatoma cells that exogenous sphingosine promoted apoptosis by decreasing serum-stimulated Akt activation.22 This is consistent with our observation of exogenous sphingosine decreasing pAkt; however, we cannot conclude whether this is a direct role for sphingosine, as it is a substrate of both SphKs and ceramide synthases. Of interest, AC was shown to drive sphingosine-mediated activation of Akt in alveolar macrophages.8 Several observations in this study pointed to a direct functional role for sphingosine. However, AC-mediated Akt signaling was not studied in the context of genetic manipulation or inhibition of SphK, which would have provided strength to the authors' conclusions. In the present study, no role for sphingosine in activating Akt could be demonstrated. Moreover, it appears that treatment with sphingosine caused deactivation of Akt. One explanation for this is feedback inhibition of AC by exogenous sphingosine, which would lead not only to a reduction of S1P, but also an increase in ceramide, whose role in PP2A-dependent deactivation of Akt is well studied. Salvage generation of ceramide by ceramide synthases could also account for the deactivation of Akt upon addition of exogenous sphingosine.23
Our data implicate S1P in mediating activation of Akt in the context of AC expression. The vast majority of S1P-mediated phenomena have been attributed to the signaling of its five GPCRs, S1PR1–5. S1PR 4 and 5 are relatively restricted in their expression to the immune system (S1PR4) and the nervous system (S1PR5).24 S1PR1–3 are ubiquitously expressed, and have numerous roles in diverse phenomena. S1P is characterized to mediate Gi stimulation of PI3K, and thereby cause activation of Akt as well as MAPK signaling. These effects have been associated with S1PR1 and, to a lesser degree, with S1PR3, and both receptors have been shown to enhance cell proliferation and migration through Rac activation.25, 26, 27, 28 In contrast, S1PR2 is thought to predominantly couple with G12/13,24, 29 and thereby antagonize Akt activation by Rho-mediated recruitment of PTEN to the cell membrane.13 This effect, coupled with its suppression of Rac activity, has resulted in S1P2 being designated as an antimigratory, antiproliferative receptor, which largely opposes the oncogenic signaling of S1PR1 and 3. The present study breaks this dogma by showing that S1PR2 can activate oncogenic Akt signaling in prostate cancer. It is important to note that S1PR2 couples to Gi, G12/13 and Gq, with effects of G12/13 predominating in many functional assays. In our study, interdiction of Gi signaling substantially reduced AC-induced Akt activation, suggesting that S1PR2 has adopted a Gi -dominant downstream signal. Interestingly, the prostate cancer cell lines studied here had far more abundant S1PR2 mRNA than S1PR1 or 3, which may explain why inhibition of S1PR2 had an strong impact on cell signaling and phenotype, however it does not explain why a typically tumor-suppressive receptor now signals to activate Akt. One hypothesis is that S1PR2 is initially upregulated in response to AC overexpression in neoplastic tissues as a means to suppress the oncogenic effects of AC. In the hyperselective tumor environment, cancer cells may evolve to favor Gi signaling through S1PR2, compounding the oncogenic insult of AC by further increasing the impact of the downstream metabolite S1P. In support of this, we found that primary prostate epithelial cells had equal expression of S1PR1–3 (data not shown), suggesting that receptor expression is altered at some point during malignant transformation, although we did not observe AC-induced upregulation of S1PR2 in primary cells.
Our study clearly identifies a role for SphK1 in mediating AC-induced Akt activation, with knockout or knockdown of SphK2 having little or no effect. We believe that this may be due to the cellular localizations of the different SphK isoforms. SphK1 has been found to be primarily cytoplasmic or associated with the plasma membrane, whereas SphK2 is largely located in the nucleus or endoplasmic reticulum.30 As AC resides in the lysosome, thus producing sphingosine primarily in this compartment, it may be that SphK1 has preferential or exclusive access to lysosomal sphingosine. We found that SphK2 KO MEFs had an increase in S1P equivalent to WT MEFs when we overexpressed AC, however SphK1 KO MEFs had no increase in S1P, consistent with this hypothesis.
The observations in this study that AC promotes resistance to cytotoxic chemotherapies but sensitivity to agents that target Akt demonstrate important differences of the diverse functions mediated by AC. An exceedingly common and critical event in cell death in response to nonspecific stressors like radiation and chemotherapy is the accumulation of ceramide, which activates apoptosis through well-characterized mechanisms.19, 31 The efficacy of cytotoxic chemotherapies in this and previous studies have been shown to be lessened by expression of AC, presumably by dampening the accumulation of ceramide and thus downstream apoptotic signals.3 In contrast, targeted inhibition of Akt proves especially effective in cells overexpressing AC, indicating that AC-overexpressing cancer cells, and thus potentially AC-overexpressing tumors, are reliant on oncogenic Akt activation through the pathway defined in this study for their oncogenic phenotypes. Chemotherapy for hormone-refractory prostate cancer is currently limited to Docetaxel, which provides minimal benefit.32 Biopsy-based diagnostic methods could be readily adapted for evaluation of AC expression and Akt activation, potentially informing treatment decisions in the near future as PI3K and Akt inhibitors enter clinical use. Thus, while AC contributes to death resistance in the context of diverse cell stressors such as radiation and chemotherapy by attenuating ceramide accumulation, the identification in this study of AC-mediated Akt activation provides critical insight into specific susceptibilities downstream of AC that could inform future clinical decisions.
Akt signaling promotes proliferation indirectly by activating the mTOR pathway that controls translation of peptides necessary for cell growth, and directly by phosphorylating multiple cyclin-dependent kinase inhibitors.33 Our study of the functional consequences of AC-induced Akt signaling reveals three important observations: (1) AC-expressing cells proliferate more rapidly, (2) AC promotes soft agar-colony formation and (3) these oncogenic phenotypes are profoundly sensitive to Akt inhibition. That AC promotes cell proliferation is not surprising, given the signaling mechanism outlined in this study—Akt phosphorylates Wee1 and Myt1 both of which promote mitotic entry by activating cdc2,34, 35, 36 and Akt directly inactivates the cyclin-dependent kinase inhibitor p27kip1 whose inactivation allows transition from G1/S.37 More interesting is the finding that AC-overexpressing cells are more sensitive to Akt inhibition with regards to these functional assays than are controls cells. This indicates that AC-overexpressing cells not only rely heavily on Akt signaling for the growth advantages incurred by increased AC signaling, but also for their baseline cell proliferation and tumor formation properties, on the whole suggesting that AC expression causes Akt signaling pathway addiction.
The importance of the pathway outlined in this study is made clear by our tissue microarray studies of human prostate cancer patients. Our ability to study the pattern of expression of AC and pAkt in prostate tumors, and patient-matched benign tissue was critical in understanding whether a statistical relationship existed between AC and pAkt. Simply put, due to the numerous factors that contribute to Akt activation, a prohibitively large sample size would have been required to demonstrate a direct correlation between AC level and phosphorylation of Akt. Instead, we were able to show that when a patient's tumor had more AC than his benign tissue, pAkt tended to increase as well. In patients whose AC did not increase in their tumors, pAkt was not elevated. Analyzing these tissues in a contingency table revealed that a statistically meaningful relationship does exist between AC and pAkt in the benign to adenocarcinoma progression of human prostate tissue. In an analysis of 56 patients' tumors, grouping AC immunohistochemistry score into low-, middle- and high-intensity staining groups revealed that pAkt scores were significantly higher in the AC-high versus AC-low groups, providing more evidence that AC-induced Akt activation is a relevant process in human prostate cancer.
In summary, the present study uncovers a mechanistic basis for oncogenic processes mediated by AC. Cancer cells expressing high levels of AC have increased activated Akt. This is due to generation of S1P by Sphk1, which stimulates S1PR2 to effect PI3K-dependent Akt activation. Moreover, whereas AC-overexpressing cells are resistant to cytotoxic chemotherapy, proliferate more rapidly and exhibit enhanced anchorage-independent growth compared with control cells, they are significantly more sensitive to Akt inhibition. As most prostate tumors overexpress AC and as we show here a correlation between AC and Akt activation in human prostate biopsy tissue, Akt addiction in AC-overexpressing tumors may inform targeting of specific cancers with nascent Akt inhibitors.
Materials and methods
Cell lines and culture
PPC1 (a gift of Dr Yi Lu, University of Tennessee), SCC14A (shared by Dr Besim Ogretmen, Medical University of South Carolina), MIA, Panc01 and DU145 (ATCC, Manassas, VA, USA) were maintained in RPMI 1640 with 10% bovine growth serum (BGS) and incubated in 5% CO2 at 37 °C. WT, SphK1 KO and SphK2 KO MEFs (shared by Dr Besim Ogretmen) were cultured in DMEM with 10% fetal bovine serum and incubated in 5% CO2 at 37 °C. DU145-AC-EGFP/DU145-EGFP and PPC1-AC-V5/PPC1-LacZ-V5 have been described.3, 5 PPC1 pLKO.1/pLKO.1-shAC were generated by transfection of vectors obtained from Open Biosystems (Huntsville, AL, USA), and stable selection was done with puromycin.
Reagents
Synthesis of sphingosine (2-amino-4-octadecene-1,3-diol) and 17C-C6-ceramide were conducted in the Lipidomics Shared Resource. Reagents used include: SKI–II, Docetaxel (Thermo Fisher, Lafayette, CO, USA), LY294002, Wortmannin, AktX (Cayman Chemical, Ann Arbor, MI, USA), W146, JTE013, NF023 (Tocris, Bristol, UK), Perifosine (BioVision, Milpitas, CA, USA) and pertussis toxin (Sigma Aldrich, St Louis, MO, USA).
Preparation of tumor tissue microarray
Twenty-seven formalin-fixed paraffin-embedded prostate carcinomas were obtained from the Hollings Cancer Center Tissue Biorepository (Medical University of South Carolina). Tissues were obtained in accordance with an Institutional Review Board approved protocol (no. 426). Three tissue cores were sampled from each tumor, and one core was sampled from adjacent normal tissue. Four-micrometer sections of the tissue microarray were cut and processed for immunohistochemistry. Furthermore, human prostate tissues from the Eastern Virginia Medical School, assembled as described,38 were immunostained as described below.
Immunohistochemistry
Formalin-fixed paraffin-embedded sections were deparaffinized in xylene, rehydrated in alcohol and processed for pretreatment as follows: the sections were incubated with target retrieval solution (Dako, Glostrup, Denmark) in a steamer (Rival, Mill Valley, CA, USA) for 45 min, and then 3% hydrogen peroxide solution for 10 min and protein block (Dako) for 20 min at room temperature. Primary antibody incubation overnight in a humid chamber at 4 °C, followed by biotinylated secondary antibody (Vector, Burlingame, CA, USA) for 30 min and ABC reagent (Vector) for 30 min. Immunocomplexes of horseradish peroxidase were visualized by DAB (Dako) reaction, and sections were counterstained with hematoxylin before mounting. Immunoreactivity was scored using a semiquantitative system, combining intensity of staining (0–3) and percentage of cells staining positive (0–3).
Adenovirus infection
AC complementary DNA was purchased from Origene (Rockville, MD, USA) and Ad-AC (adenovirus expressing AC and GFP), and Ad-GFP were developed by Vector Biolabs (Philadelphia, PA, USA). Ad-PTEN was purchased from Vector Biolabs. The short-hairpin sequence (5′-CCGGGCTGTTATTGACAGCGATATACTGAGTATATCGCTGTCAATAACAGCTTTTT-3′) obtained from Open Biosystems was validated and developed into an adenoviral delivery vector (Ad-shAC) by Vector Biolabs. A total of 2 × 10⁵ cells were infected in suspension in growth medium and plated on 35-mm dishes. Multiplicity of infection was 50, unless stated otherwise in the figure legend. After overnight attachment, infection was verified by fluorescent microscopy, and the medium was replaced to contain the indicated treatments. For infections following si/shRNA transfection, medium was replaced 24 h after transfection to contain the indicated adenovirus.
Transfections
Dharmacon siGENOME SMART POOL siRNA against SphK1 and SphK2 were purchased from Thermo Fisher, and nontargeting siRNA was purchased from Qiagen (Valencia, CA, USA). siRNA transfections were performed using Oligofectamine (Qiagen) according to the manufacturer's instructions. The following MISSION shRNA sequences were obtained from Sigma Aldrich encoded in pLKO.1 vectors.
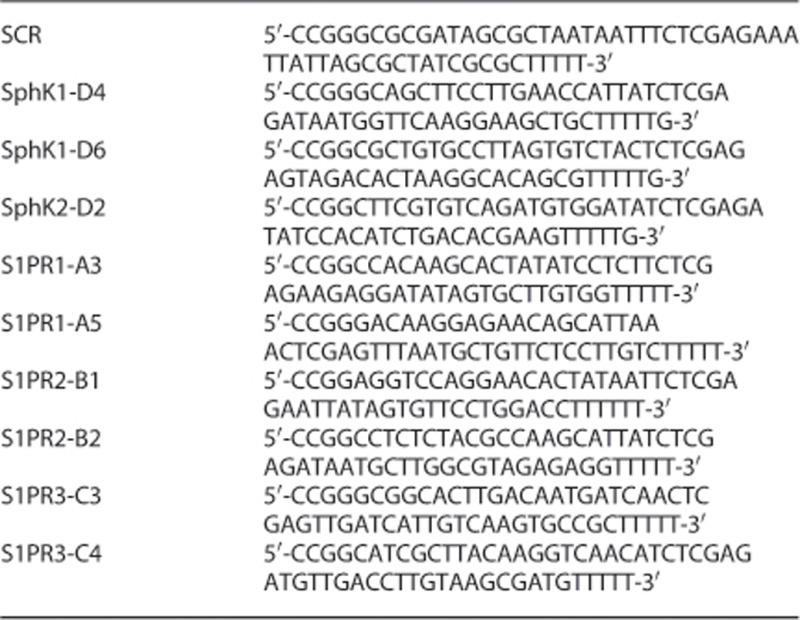
These were transfected using Lipofectamine 2000 (Life Technologies, Carlsbad, CA, USA), according to the manufacturer's instructions.
qRT–PCR
si/shRNA knockdown validation was carried out by isolation of RNA using TRI Reagent (Molecular Research Center, Cincinnati, OH, USA) and complementary DNA synthesis using the Bio-Rad (Hercules, CA, USA) iScript complementary DNA synthesis kit, according to the manufacturer's instructions. qRT–PCR was performed by using iCycler iQ real-time PCR detection system (Bio-Rad) using annealing temperature 58 °C and the following primers:
Sphk1: forward-5′-TGAGCAGGTCACCAATGAAG-3′ reverse-5′-TGTGCAGAGACAGCAGGTTC-3′
SphK2: forward-5′-GGAGGAAGCTGTGAAGATGC-3′ reverse-5′-GCAACAGTGAGCAGTTGAGC-3′
S1PR1: forward-5′-GAAGGGGGAGAATACGAACA-3′ reverse-5′-GCCAAATGAACCCTTTAGGA-3′
S1PR2: forward-5′-CACCTGGAAAGGCCAGATAA-3′ reverse-5′-CAGTGCAAGATTCCGTCTCA-3′
S1PR3: forward-5′-GCCGACGGAGGAGCCCTTTTTC-3′ reverse-5′-ATGCTCCCGCAGGGTCTCGTT-3′
ACER1: forward-5′-GCCTAGCATCTTCGCCTATCAG-3′ reverse-5′-GGAAGTTGCTCTCACACCAGTC-3′
ACER2: forward-5′-AGTGTCCTGTCTGCGGTTACG-3′ reverse-5′-TGTTGTTGATGGCAGGCTTGAC-3′
ACER3: forward-5′-TGGACTGGTGCGAGGAGAAC-3′ reverse-5′-TCCAGAACTCGGCGATGTACC-3′
ASAH2: forward-5′-TTACCCTTGGGTCCTTGGCCATAA-3′ reverse-5′-TCTGCCACGATGTTGAAGTAGCCT-3′
GAPDH: forward-5′-CAATGACCCCTTCATTGACC-3′ reverse-5′-GATCTCGCTCCTGGAAGATG-3′
Western blotting
Cell lysates were prepared and analyzed as previously described,4 using the following antibodies: pAkt (D9E, no. 4060), total Akt (C67E7, no. 4691), p-mTOR S2448, no. 2971), p-4E-BP1 (236B4, no. 2855), p-P70S6K (108D2, no. 9234), p-GSK-3beta (S9, no. 9336), Erk1/2 (137F5, no. 4695), p-Erk1/2 (197G2, no. 4377) and PTEN (138G6, no. 9559) (Cell Signaling Technologies, Danvers, MA, USA), AC (BD Transduction no. 612302), S1P1 (H-60, Santa Cruz Biotechnology, Santa Cruz, CA, USA), S1P2 (6E8.1, Millipore, Billerica, MA, USA) and S1P3 (no. PA5-28762, Pierce, Rockford, IL, USA). Band densitometries were quantified using NIH ImageJ software (Bethesda, MD, USA). Unless otherwise stated, pAkt/tAkt ratios are represented normalized to the reference (set at 1.00) to allow rapid evaluation of increases or decreases from control. Western blots are representative of a minimum of three independent experiments.
Cell viability assays
A total of 5000 cells per well were infected with Ad-AC or Ad-GFP and plated in 96-well plates. After overnight attachment, medium containing the indicated compound was added. For each compound tested, a broad dose range was selected encompassing doses effecting little to complete cell death. After 48 h, the Promega CellTiter 96 AQueous One Solution Cell Proliferation Assay (MTS) (Promega, Madison, WI, USA) was used to approximate the number of viable cells. Prism v4 (GraphPad, La Jolla, CA, USA) was used to determine the EC50 of the various compounds.
Proliferation
A total of 500 cells were plated per well in 96-well plates. After overnight attachment, medium containing the indicated compound was added to the indicated final concentration. On the indicated day (day 1 being the day after plating), the Promega CellTiter 96 AQueous One Solution Cell Proliferation Assay (MTS) was used to approximate the number of viable cells. All readings were performed 1 h after addition of assay reagent.
Soft agar-colony-formation assay
A base layer composed of 2 ml 0.5% agar, 10% serum and 1 × RPMI was prepared in six-well plates. A top layer was prepared to a final composition of 0.35% agar, 10% serum and 1 × RPMI, with 2500 cells per 2 ml. This layer was prepared at 40 °C and plated on top of the base layer. After 4 h at 37 °C, 1 ml complete medium containing the indicated compound was carefully added to the top of each well. In 2 weeks, colony formation was analyzed by counting the number of colonies per × 100 microscope field. Five fields were counted for each well, and the average of three wells was used to generate data.
Sphingolipid analysis
Ceramide species, sphingosine and S1P from cell pellets were collected and analyzed with LC-MS/MS by the Lipidomics Shared Resource, MUSC, as previously described.4
Statistical analysis
Independent experiments were performed a minimum of three times. Statistical analyses on experiments performed in triplicate were performed by unpaired one-tailed Student's t-test, one-way analysis of variance with Bonferroni correction using Prism (version 4.0) from GraphPad, or Fisher's exact test. *P<0.05 was considered significant.
Acknowledgments
PPC1 cells were a kind gift from Dr Yi Lu, University of Tennessee. WT, SphK1 and SphK2 KO MEFs were a kind gift of Dr Besim Ogretmen, Medical University of South Carolina. Grant support provided by the Department of Defense PCTA PC101962 and NCI 5P01CA097132, and Award Number UL1RR029882 from the National Center For Research Resources. Research supported in part by the Lipidomics Shared Resource, Hollings Cancer Center, Medical University of South Carolina (P30 CA138313) and the Lipidomics Core in the SC Lipidomics and Pathobiology COBRE (P20 RR017677).
The authors declare no conflict of interest.
Footnotes
Supplementary Information accompanies this paper on the Oncogenesis website (http://www.nature.com/oncsis).
Supplementary Material
References
- Seelan RS, Qian C, Yokomizo A, Bostwick DG, Smith DI, Liu W. Human acid ceramidase is overexpressed but not mutated in prostate cancer. Genes Chromosomes Cancer. 2000;29:137–146. doi: 10.1002/1098-2264(2000)9999:9999<::aid-gcc1018>3.0.co;2-e. [DOI] [PubMed] [Google Scholar]
- Norris JS, Bielawska A, Day T, El-Zawahri A, Elojeimy S, Hannun Y, et al. Combined therapeutic use of AdGFPFasL and small molecule inhibitors of ceramide metabolism in prostate and head and neck cancers: a status report. Cancer Gene Ther. 2006;13:1045–1051. doi: 10.1038/sj.cgt.7700965. [DOI] [PubMed] [Google Scholar]
- Saad AF, Meacham WD, Bai A, Anelli V, Elojeimy S, Mahdy AE, et al. The functional effects of acid ceramidase overexpression in prostate cancer progression and resistance to chemotherapy. Cancer Biol Ther. 2007;6:1455–1460. doi: 10.4161/cbt.6.9.4623. [DOI] [PubMed] [Google Scholar]
- Mahdy AE, Cheng JC, Li J, Elojeimy S, Meacham WD, Turner LS, et al. Acid ceramidase upregulation in prostate cancer cells confers resistance to radiation: AC inhibition, a potential radiosensitizer. Mol Ther. 2009;17:430–438. doi: 10.1038/mt.2008.281. [DOI] [PMC free article] [PubMed] [Google Scholar]
- Beckham TH, Lu P, Cheng JC, Zhao D, Turner LS, Zhang X, et al. Acid ceramidase-mediated production of sphingosine 1-phosphate promotes prostate cancer invasion through upregulation of cathepsin B. Int J Cancer. 2012;131:2034–2043. doi: 10.1002/ijc.27480. [DOI] [PMC free article] [PubMed] [Google Scholar]
- Ogretmen B, Hannun YA. Biologically active sphingolipids in cancer pathogenesis and treatment. Nat Rev Cancer. 2004;4:604–616. doi: 10.1038/nrc1411. [DOI] [PubMed] [Google Scholar]
- Schubert KM, Scheid MP, Duronio V. Ceramide inhibits protein kinase B/Akt by promoting dephosphorylation of serine 473. J Biol Chem. 2000;275:13330–13335. doi: 10.1074/jbc.275.18.13330. [DOI] [PubMed] [Google Scholar]
- Monick MM, Mallampalli RK, Bradford M, McCoy D, Gross TJ, Flaherty DM, et al. Cooperative prosurvival activity by ERK and Akt in human alveolar macrophages is dependent on high levels of acid ceramidase activity. J Immunol. 2004;173:123–135. doi: 10.4049/jimmunol.173.1.123. [DOI] [PubMed] [Google Scholar]
- Thayyullathil F, Chathoth S, Shahin A, Kizhakkayil J, Hago A, Patel M, et al. Protein phosphatase 1-dependent dephosphorylation of Akt is the prime signaling event in sphingosine-induced apoptosis in Jurkat cells. J Cell Biochem. 2011;112:1138–1153. doi: 10.1002/jcb.23033. [DOI] [PubMed] [Google Scholar]
- Radeff-Huang J, Seasholtz TM, Matteo RG, Brown JH. G protein mediated signaling pathways in lysophospholipid induced cell proliferation and survival. J Cell Biochem. 2004;92:949–966. doi: 10.1002/jcb.20094. [DOI] [PubMed] [Google Scholar]
- Baudhuin LM, Jiang Y, Zaslavsky A, Ishii I, Chun J, Xu Y. S1P3-mediated Akt activation and cross-talk with platelet-derived growth factor receptor (PDGFR) FASEB J. 2004;18:341–343. doi: 10.1096/fj.03-0302fje. [DOI] [PubMed] [Google Scholar]
- Baudhuin LM, Cristina KL, Lu J, Xu Y. Akt activation induced by lysophosphatidic acid and sphingosine-1-phosphate requires both mitogen-activated protein kinase kinase and p38 mitogen-activated protein kinase and is cell-line specific. Mol Pharmacol. 2002;62:660–671. doi: 10.1124/mol.62.3.660. [DOI] [PubMed] [Google Scholar]
- Sanchez T, Skoura A, Wu MT, Casserly B, Harrington EO, Hla T. Induction of vascular permeability by the sphingosine-1-phosphate receptor-2 (S1P2R) and its downstream effectors ROCK and PTEN. Arterioscler Thromb Vasc Biol. 2007;27:1312–1318. doi: 10.1161/ATVBAHA.107.143735. [DOI] [PubMed] [Google Scholar]
- Means CK, Brown JH. Sphingosine-1-phosphate receptor signalling in the heart. Cardiovasc Res. 2009;82:193–200. doi: 10.1093/cvr/cvp086. [DOI] [PMC free article] [PubMed] [Google Scholar]
- Elojeimy S, Liu X, McKillop JC, El-Zawahry AM, Holman DH, Cheng JY, et al. Role of acid ceramidase in resistance to FasL: therapeutic approaches based on acid ceramidase inhibitors and FasL gene therapy. Mol Ther. 2007;15:1259–1263. doi: 10.1038/sj.mt.6300167. [DOI] [PubMed] [Google Scholar]
- Lin CF, Chen CL, Chiang CW, Jan MS, Huang WC, Lin YS. GSK-3beta acts downstream of PP2A and the PI 3-kinase-Akt pathway, and upstream of caspase-2 in ceramide-induced mitochondrial apoptosis. J Cell Sci. 2007;120:2935–2943. doi: 10.1242/jcs.03473. [DOI] [PubMed] [Google Scholar]
- Ogretmen B, Hannun Y. Updates on functions of ceramide in chemotherapy-induced cell death and in multidrug resistance. Drug Resist Updat. 2002;4:368–377. doi: 10.1054/drup.2001.0225. [DOI] [PubMed] [Google Scholar]
- Charles AG, Han T-Y, Liu YY, Hansen N, Giuliano AE, Cabot MC. Taxol-induced ceramide generation and apoptosis in human breast cancer cells. Cancer Chemother Pharmacol. 2001;47:444–450. doi: 10.1007/s002800000265. [DOI] [PubMed] [Google Scholar]
- Wang XZ, Beebe JR, Pwiti L, Bielawska A, Smyth MJ. Aberrant sphingolipid signaling is involved in the resistance of prostate cancer cell lines to chemotherapy. Cancer Res. 1999;59:5842–5848. [PubMed] [Google Scholar]
- Musumarra G, Barresi V, Condorelli DF, Scire S. A bioinformatic approach to the identification of candidate genes for the development of new cancer diagnostics. Biol Chem. 2003;384:321–327. doi: 10.1515/BC.2003.037. [DOI] [PubMed] [Google Scholar]
- Shah MV, Zhang R, Irby R, Kothapalli R, Liu X, Arrington T, et al. Molecular profiling of LGL leukemia reveals role of sphingolipid signaling in survival of cytotoxic lymphocytes. Blood. 2008;112:770–781. doi: 10.1182/blood-2007-11-121871. [DOI] [PMC free article] [PubMed] [Google Scholar]
- Chang HC, Tsai LH, Chuang LY, Hung WC. Role of AKT kinase in sphingosine-induced apoptosis in human hepatoma cells. J Cell Physiol. 2001;188:188–193. doi: 10.1002/jcp.1108. [DOI] [PubMed] [Google Scholar]
- Kitatani K, Idkowiak-Baldys J, Hannun YA. The sphingolipid salvage pathway in ceramide metabolism and signaling. Cell Signal. 2008;20:1010–1018. doi: 10.1016/j.cellsig.2007.12.006. [DOI] [PMC free article] [PubMed] [Google Scholar]
- Takuwa N, Du W, Kaneko E, Okamoto Y, Yoshioka K, Takuwa Y. Tumor-suppressive sphingosine-1-phosphate receptor-2 counteracting tumor-promoting sphingosine-1-phosphate receptor-1 and sphingosine kinase 1—Jekyll Hidden behind Hyde. Am J Cancer Res. 2011;1:460–481. [PMC free article] [PubMed] [Google Scholar]
- Okamoto H, Takuwa N, Gonda K, Okazaki H, Chang K, Yatomi Y, et al. EDG1 is a functional sphingosine-1-phosphate receptor that is linked via a Gi/o to multiple signaling pathways, including phospholipase C activation, Ca2+ mobilization, Ras-mitogen-activated protein kinase activation, and adenylate cyclase inhibition. J Biol Chem. 1998;273:27104–27110. doi: 10.1074/jbc.273.42.27104. [DOI] [PubMed] [Google Scholar]
- Liu F, Verin AD, Wang P, Day R, Wersto RP, Chrest FJ, et al. Differential regulation of sphingosine-1-phosphate- and VEGF-induced endothelial cell chemotaxis. Involvement of G(ialpha2)-linked Rho kinase activity. Am J Respir Cell Mol Biol. 2001;24:711–719. doi: 10.1165/ajrcmb.24.6.4323. [DOI] [PubMed] [Google Scholar]
- Windh RT, Lee MJ, Hla T, An S, Barr AJ, Manning DR. Differential coupling of the sphingosine 1-phosphate receptors Edg-1, Edg-3, and H218/Edg-5 to the G(i), G(q), and G(12) families of heterotrimeric G proteins. J Biol Chem. 1999;274:27351–27358. doi: 10.1074/jbc.274.39.27351. [DOI] [PubMed] [Google Scholar]
- Sugimoto N, Takuwa N, Okamoto H, Sakurada S, Takuwa Y. Inhibitory and stimulatory regulation of Rac and cell motility by the G12/13-Rho and Gi pathways integrated downstream of a single G protein-coupled sphingosine-1-phosphate receptor isoform. Mol Cell Biol. 2003;23:1534–1545. doi: 10.1128/MCB.23.5.1534-1545.2003. [DOI] [PMC free article] [PubMed] [Google Scholar]
- Arikawa K, Takuwa N, Yamaguchi H, Sugimoto N, Kitayama J, Nagawa H, et al. Ligand-dependent inhibition of B16 melanoma cell migration and invasion via endogenous S1P2 G protein-coupled receptor. Requirement of inhibition of cellular RAC activity. J Biol Chem. 2003;278:32841–32851. doi: 10.1074/jbc.M305024200. [DOI] [PubMed] [Google Scholar]
- Pitson SM. Regulation of sphingosine kinase and sphingolipid signaling. Trends Biochem Sci. 2011;36:97–107. doi: 10.1016/j.tibs.2010.08.001. [DOI] [PubMed] [Google Scholar]
- Haimovitz-Friedman A, Kan CC, Ehleiter D, Persaud RS, McLoughlin M, Fuks Z, et al. Ionizing radiation acts on cellular membranes to generate ceramide and initiate apoptosis. J Exp Med. 1994;180:525–535. doi: 10.1084/jem.180.2.525. [DOI] [PMC free article] [PubMed] [Google Scholar]
- Domingo-Domenech J, Vidal SJ, Rodriguez-Bravo V, Castillo-Martin M, Quinn SA, Rodriguez-Barrueco R, et al. Suppression of acquired docetaxel resistance in prostate cancer through depletion of notch- and hedgehog-dependent tumor-initiating cells. Cancer Cell. 2012;22:373–388. doi: 10.1016/j.ccr.2012.07.016. [DOI] [PMC free article] [PubMed] [Google Scholar]
- Engelman JA. Targeting PI3K signalling in cancer: opportunities, challenges and limitations. Nat Rev Cancer. 2009;9:550–562. doi: 10.1038/nrc2664. [DOI] [PubMed] [Google Scholar]
- Watanabe N, Broome M, Hunter T. Regulation of the human WEE1Hu CDK tyrosine 15-kinase during the cell cycle. EMBO J. 1995;14:1878–1891. doi: 10.1002/j.1460-2075.1995.tb07180.x. [DOI] [PMC free article] [PubMed] [Google Scholar]
- McGowan CH, Russell P. Human Wee1 kinase inhibits cell division by phosphorylating p34cdc2 exclusively on Tyr15. EMBO J. 1993;12:75–85. doi: 10.1002/j.1460-2075.1993.tb05633.x. [DOI] [PMC free article] [PubMed] [Google Scholar]
- Mueller PR, Coleman TR, Kumagai A, Dunphy WG. Myt1: a membrane-associated inhibitory kinase that phosphorylates Cdc2 on both threonine-14 and tyrosine-15. Science. 1995;270:86–90. doi: 10.1126/science.270.5233.86. [DOI] [PubMed] [Google Scholar]
- Koff A, Polyak K. p27KIP1, an inhibitor of cyclin-dependent kinases. Prog Cell Cycle Res. 1995;1:141–147. doi: 10.1007/978-1-4615-1809-9_11. [DOI] [PubMed] [Google Scholar]
- Hawley S, Fazli L, McKenney JK, Simko J, Troyer D, Nicolas M, et al. A model for the design and construction of a resource for the validation of prognostic prostate cancer biomarkers: the canary prostate cancer tissue microarray. Adv Anat Pathol. 2013;20:39–44. doi: 10.1097/PAP.0b013e31827b665b. [DOI] [PMC free article] [PubMed] [Google Scholar]
Associated Data
This section collects any data citations, data availability statements, or supplementary materials included in this article.


