Abstract
The availability of both HLA data and genotypes for thousands of SNPs across the major histocompatibility complex (MHC) in 1240 complete families of the Type 1 Diabetes Genetics Consortium allowed us to analyze the occurrence and extent of megabase contiguous identity for founder chromosomes from unrelated individuals. We identified 82 HLA-defined haplotype groups, and within these groups, megabase regions of SNP identity were readily apparent. The conserved chromosomes within the 82 haplotype groups comprise approximately one third of the founder chromosomes. It is currently unknown whether such frequent conservation for groups of unrelated individuals is specific to the MHC, or if initial binning by highly polymorphic HLA alleles facilitated detection of a more general phenomenon within the MHC. Such common identity, specifically across the MHC, impacts type 1 diabetes susceptibility and may impact transplantation between unrelated individuals.
Keywords: Type 1 diabetes, MHC, HLA, Extended haplotypes, SNP, 8.1, DR8
Introduction
An important question in localizing putative disease polymorphisms is how frequently SNP haplotypes of presumably “unrelated” individuals are identical over large (megabase) regions. Evidence utilizing tracts of homozygosity have indicated that regions of such conservation occur in specific areas of the human genome, but of note, none of the largest regions was identified to be within the major histocompatibility complex (MHC) [1–4]. Other studies have used haplotypic data (inferred from genotype data and rarely from family data) and have noted common haplotypes (frequency >1%) larger than 1 Mb [5–7]. A seminal study from twenty-five years ago analyzed HLA alleles (HLA-B and HLA-DR) and polymorphisms in complement genes (complotypes, a single genetic unit of the complement genes CFB, C2, C4A and C4B) and identified multiple extended haplotypes across this region [8]. This report has been confirmed in several subsequent studies, with haplotypes always defined by HLA alleles and/or complotypes [9–12]. In addition, recent studies have confirmed that for the most common extended haplotypes (e.g. HLA-DR3-B8-A1; DR3-B18-A30), nearly complete conservation between unrelated individuals for up to 9 million base pairs can be found when SNPs are analyzed in addition to HLA alleles [13–16]. We hypothesized that multiple additional haplotypes with long-range identity would be apparent with a systematic analysis of MHC SNP haplotypes. In addition, we hypothesized that some of these haplotypes, despite identity at HLA-DR and DQ alleles, would differ in their association with autoimmune disorders such as type 1A diabetes due to the effect of non-HLA-DR and DQ genetic factors.
A major advantage of searching for evidence of long-range “complete” linkage disequilibrium within the MHC is the existence of widely spaced highly polymorphic HLA markers. With an initial search algorithm utilizing HLA alleles, analysis of individual chromosomes from thousands of individuals might identify likely candidate haplotypes for specialized analysis of long-range SNP linkage disequilibrium. Our analysis of data from the initial 5 cohort subset MHC SNP typing release from the Type 1 Diabetes Genetics Consortium (T1DGC) revealed that it is common for chromosomes to fall into different conserved MHC haplotype groups (n=82 groups). “Completely” conserved long-range SNP haplotypes within these 82 MHC haplotype groups comprise approximately 1/3 of diabetes case chromosomes and 1/4 of control chromosomes.
Methods
Study population
This study included 1240 families (6297 individuals, mostly affected sib pairs and their parents) from the British Diabetic Association (BDA), Danish (DAN), Human Biological Data Interchange (HBDI), Joslin (JOS), and United Kingdom (UK) populations from the 5 cohort subset of the T1DGC.
Genotyping
SNPs were typed across the MHC using the dense standard Illumina (MHC mapping and exon-centric panels [2957 distinct SNPs (1536 SNPs in each panel with 115 overlapping SNPs) with 2837 of 2957 SNPs successfully typed, yielding a 96% SNP success rate]. In addition, complete HLA typing (HLA-DPB1, HLA-DPA1, HLA-DQB1, HLA-DQA1, HLA-DRB1, HLA-B, HLA-C, and HLA-A, performed using traditional strip-based methods), was available for all samples.
Generation of phased chromosomes
Chromosomes were generated from SNP genotype data by a variety of software packages. First, to establish that the genotype data demonstrated a Mendelian inheritance pattern within each family, the PedCheck program was used (http://watson.hgen.pitt.edu) on data from both Illumina panels and HLA separately [17]. Mendelian inheritance patterns were present for all families. Next, data from the Illumina mapping SNP panel, the exon-centric SNP panel, and HLA were combined. Merlin software (www.sph.umich.edu/csg/abecasis/Merlin) [18] was used to phase the SNP genotype data from families into chromosomes. AFBAC (affected family based control) methodology was used to assign case or control status to chromosomes [19–21].
Evaluation of conserved haplotypes
An initial search for groups of conserved haplotypes within founder chromosomes (founder chromosomes are from only the parents, yielding 4 unique chromosomes per family) identified groups of chromosomes with identical HLA-DR, HLA-B, and HLA-A alleles, termed a “haplotype group.” Chromosomes within these groups were then compared to a consensus sequence (longest pair of chromosomes with “complete” conservation by SNPs). We defined loss of “conservation” in our linear analysis of chromosomes as at least 33% of SNPs across 30 SNP blocks not matching a consensus sequence, and chromosomes were compared from HLA-DR to HLA-B, to HLA-A, and to the telomeric end of the typing panel. Centromeric of HLA-DR there was little evidence of maintenance of conservation.
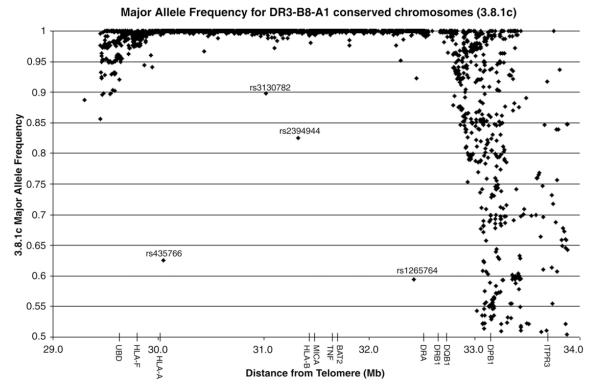
For Figure 4, 3.8.1c chromosomes were identified based on DR3-B8-A1 typing and conservation from HLA-DR to HLA-A. SNPs were excluded if more than 50% of the chromosomes were missing typing (excluded 134/2837 or 5% of the SNPs).
Figure 4.
3.8.1c major allele frequency. Major allele frequency for each SNP was calculated in 3.8.1 chromosomes that were conserved from HLA-DR to HLA-A (3.8.1c). Major allele frequency is equal to 1 if the SNP is invariant on the 3.8.1 haplotype. Only SNPs with typing for more than 50% of the chromosomes were included.
Statistical analysis
The Fisher’s exact test (two-sided) was used to calculate p-values for association with type 1A diabetes, with α=0.05. We used a chi-square test of independence to test whether the allele frequencies differed across the five cohorts with α=0.05. A tree consisting of all DR8 chromosomes was created using MEGA4 [22]. Input data consisted of the 90 DR8 chromosomes (2837 SNPs per chromosome) and ID numbers encoding HLA data (so no HLA data was used to create the tree). Three chromosomes of 93 DR8-B39-A24 were excluded from the analysis as they met an exclusion criterion of more than 1500 unphased or failed SNPs across the chromosome. We used the pairwise comparison option with pairwise deletion and the neighbor-joining method to create the tree in MEGA4 [23]. This means that each chromosome is compared SNP by SNP with another chromosome, and eventually the program draws a tree that shows the relationship among all the chromosomes with respect to overall SNP conservation.
Results
Generation of extended haplotype groups
In the initial step of our analysis, we simply “binned” 4386 founder chromosomes based upon identical HLA-DR, HLA-B, and HLA-A alleles, with a minimum of ten chromosomes in each bin. We identified 82 groups, ranging in group size from 510 to 10 chromosomes per group. In the subsequent step we compared 2837 SNPs between the chromosomes within each of the individual groups, looking for stretches of contiguous identity in three overlapping regions: starting at HLA-DR and extending 1.2 million base pairs to HLA-B, another 1.4 Mb to HLA-A, and an additional 0.7 Mb to the telomeric end of the SNP typing panel. We compared individual chromosomes within each haplotype group and found that, in general, when conservation is lost, the transition is abrupt when we defined loss of conservation as ≤10 SNPs differing from the consensus sequence within any 30 contiguous SNPs [the consensus sequence represents the longest pair of chromosomes with SNP identity (see Methods)]. In addition, we found that the chromosomes often lose conservation at different positions. We suggest a designation for SNP-defined conservation, where the conserved DR3-B8-A1 haplotype is described as 3.8.1c (DR to A), where c=conserved and the conserved region is from HLA-DR to HLA-A, and for those chromosomes not conserved, 3.8.1n (DR to A), where n=not conserved.
Description of extended haplotype groups
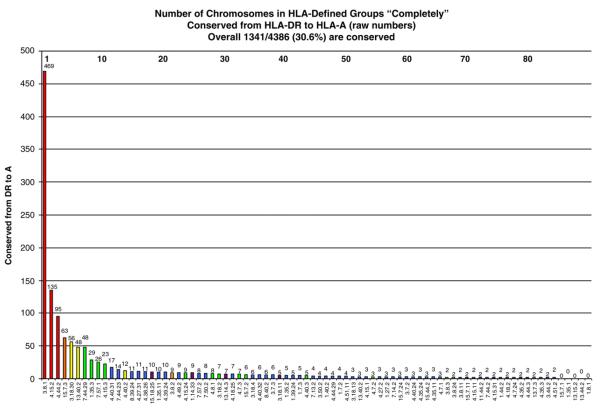
Of the extended haplotype groups, the HLA-DR3-B8-A1 was the most common haplotype with 510 HLA-defined chromosomes. In this HLA-defined group, 469 (92%) 3.8.1 chromosomes were composed of essentially identical SNPs from HLA-DR to HLA-A (469 3.8.1c (DR to A)). This is the most prevalent conserved HLA haplotype by a factor of three (Fig. 1). The next most common conserved haplotypes were the 4.15.2c (DR to A) haplotype (n=135) followed by the 4.44.2c (DR to A) haplotype (n=95). For all other haplotype groups, the number of conserved chromosomes was considerably lower (n≤63).
Figure 1.
Conservation of 82 extended DR-B-A haplotype groups. Raw number of chromosomes (both cases and controls) within each HLA haplotype group conserved for SNPs from HLA-DR to HLA-A. Number above each bar represents raw number of conserved chromosomes. Numbers at the top of the graph are an arbitrary value for each haplotype (legend is in Supplementary Table 1). Bar colors represent the total number of chromosomes in the group (red ≥100, orange 75–99, yellow 50–74, green 25–49, blue 11–24, purple ≤10).
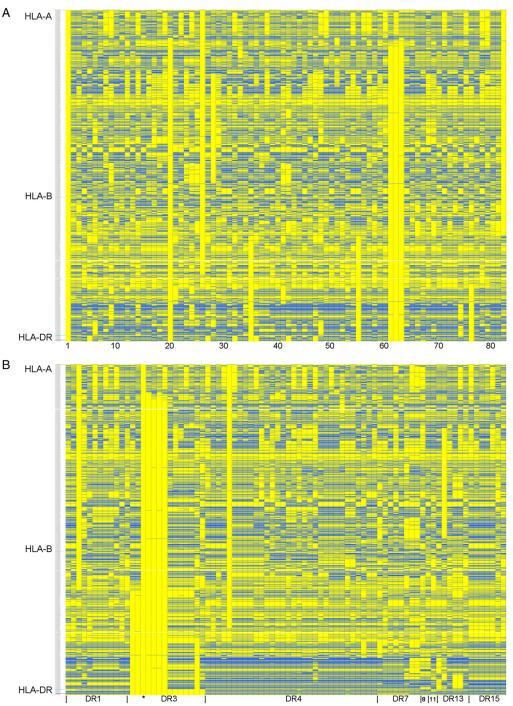
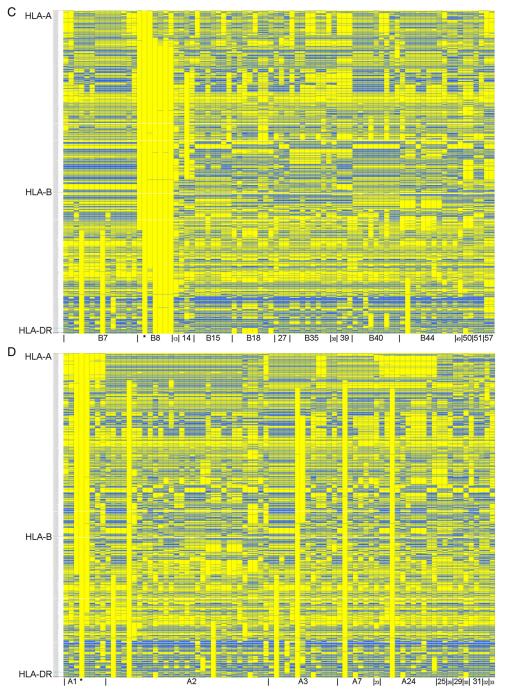
Figure 2 shows the consensus SNP sequence from each of the different haplotype groups, compared to 3.8.1c [on the far left in Fig. 2A and labeled with an asterisk (*) in Figs. 2B–D]. Each column represents the consensus sequence from a haplotype group, and each row is an individual SNP. Yellow boxes show SNP alleles that match 3.8.1c, whereas blue boxes are alleles that do not match 3.8.1c. For Figure 2A, the conserved haplotype groups are in the same order as in Figure 1. As can be seen from this graph, the haplotype groups are usually very different from each other, but stretches of conservation between groups are also apparent. Figures 2B–D sort the consensus sequences for the haplotype groups on the x-axis by HLA-DR (Fig. 2B), HLA-B (Fig. 2C) and HLA-A types (Fig. 2D). In general, stretches of identity appear easiest to discern after grouping by HLA-DR alleles.
Figure 2.
Consensus sequences of 82 extended DR-B-A haplotype groups. Consensus sequences from 82 DR-B-A haplotype groups are shown, organized by different criteria in each panel. In this graph, each column represents the consensus sequence from one haplotype group, and each row one SNP. 2837 SNPs are shown for each consensus sequence. Haplotype groups are compared to the 3.8.1c consensus sequence shown on the far left in panel A (also labeled with an asterisk (*) in panels B, C and D). Yellow boxes show that the allele matches that of the 3.8.1c, whereas blue represents the opposite allele. The telomeric end of the MHC is at the top of the graph. (A) Haplotype consensus sequences are in the same order as Figure 1 (numbers at bottom of picture are defined in Supplementary Table 1). (B) Haplotype consensus sequences are grouped on the x-axis by HLA-DR alleles, followed by HLA-B and HLA-A alleles respectively. (C) Haplotype consensus sequences are grouped on the x-axis by HLA-B alleles, followed by HLA-A and HLA-DR alleles respectively. (D) Haplotype consensus sequences are grouped on the x-axis by HLA-A alleles, followed by HLA-B and HLA-DR alleles respectively.
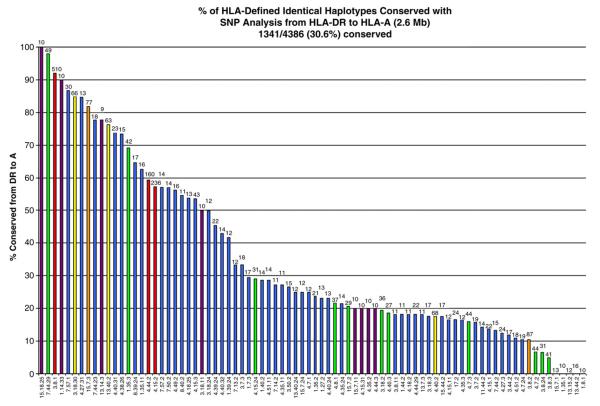
Figure 3 shows the percentage of chromosomes conserved to HLA-A within each haplotype group. The percentage of conserved chromosomes ranged from 100% for 15.18.25 to 0% for 5 haplotype groups. From this plot, it is obvious that even some of the less common haplotype groups can be highly conserved across the 2.6 Mb from HLA-DR to HLA-A (e.g. the 15.18.25 with 10 of 10 (100%) chromosomes conserved by SNPs and the 7.44.29 with 48 of 49 (98%) chromosomes conserved by SNPs). When the number of conserved chromosomes is summed across all the haplotype groups, 42% are conserved from HLA-DR to HLA-B and 31% are conserved from HLA-DR to HLA-A (Table 1). These data clearly show that conserved MHC haplotypes are common within the defined groups, and that they show long-range SNP conservation across the MHC region (25% of chromosomes are conserved for 3.4 million base pairs from HLA-DR to the telomeric end of the MHC SNP panels in this analysis).
Figure 3.
Percent conservation of 82 extended DR-B-A haplotype groups. Percent of chromosomes (both cases and controls) within each HLA haplotype group that have conserved SNPs from HLA-DR to HLA-A. Number above each bar represents the total number of chromosomes within the haplotype group. Bar colors represent the total number of chromosomes in the group (red ≥100, orange 75–99, yellow 50–74, green 25–49, blue 11–24, purple ≤10).
Table 1.
Conservation of all chromosomes (summed across all 82 bins) for specified distances
| Region of conservation | DR to B | DR to A | DR to F | DR to 29.3 Mb (end) | Complete length (34.2 Mb to 29.3 Mb) |
|---|---|---|---|---|---|
| Length (Mb) | 1.23 | 2.64 | 2.86 | 3.36 | 4.94 |
| Number conserved | 1821/4386 | 1341/4386 | 1296/4386 | 1109/4386 | 337/4386 |
| Percent conserved (%) | 42 | 31 | 30 | 25 | 8 |
DR3-B8-A1 haplotype (3.8.1)
We decided to further investigate the 3.8.1 haplotype as it was so common. Figure 4 shows a graph of the major allele frequency of each SNP in the 3.8.1c (DR to A) chromosomes. A major allele frequency of 1 means that SNP is invariant (one major specific nucleotide) within 3.8.1c chromosomes. From the graph, it is clear that the vast majority of SNPs from HLA-DR to HLA-A are nearly invariant on 3.8.1 chromosomes (2298/2703 or 85% of SNPs have a minor allele frequency <5%). Multiple SNPs are polymorphic telomeric of HLA-F and centromeric of HLA-DR, since the region of identity decays as expected from previous studies [13,16]. The SNPs rs435766 and rs1265764 were examined in more detail, as they are very polymorphic for 3.8.1c chromosomes despite being in a general region of 3.8.1c identity. An examination of the region surrounding these SNPs on the 3.8.1c chromosomes indicates that only these SNPs are very polymorphic (and not neighboring SNPs), suggesting that the variation derives from an early change of these specific SNPs on a 3.8.1c haplotype. Of note, these two SNPs are not in linkage disequilibrium with each other (r2 =0.0236). There is no evidence that these specific SNPs have a high mutation rate, because neither SNP is polymorphic within other conserved haplotype groups. The T1DGC data that we analyzed is made up of five geographic cohorts, and we analyzed the distribution of the alleles of the two polymorphic SNPs within these cohorts. The allele frequencies were significantly different across the five cohorts for rs435766 (C allele ranged from 57% to 96%, p=0.007) and rs1265764 (T allele ranged from 20% to 84%, p<0.0001). It is most likely that these two SNPs represent different mutations on 3.8.1c haplotypes with a different evolutionary history.
Examples of haplotype groups
Supplementary Figures 1A–E show additional examples of chromosomes within haplotype groups. The graphs are organized in much the same way as Figure 2, except the chromosomes are compared to a consensus sequence that is specific to each haplotype group. On the left side of the graph are chromosomes that were conserved from HLA-DR to HLA-A, whereas the right side shows chromosomes with the same HLA-DR-B-A type but not conserved for SNPs from HLA-DR to HLA-A. Figures for five haplotype groups are shown (3.8.1, 3.18.30, 8.39.24, 8.40.2 and 1.35.2). Supplementary Figure 1A (3.8.1) illustrates both 3.8.1 chromosomes that are highly conserved and multiple non-conserved chromosomes. It should be noted that only a sample of chromosomes are shown for the 3.8.1 and 3.18.30 due to space limitations. As shown in Supplementary Figures 1B and C, chromosomes that are very similar to the consensus sequence but with a small stretch of variable SNPs are, by our strict definition, classified as “not conserved” (see Methods). For the 8.40.2 haplotype group (Supplementary Figure 1D), the “not conserved” chromosomes differ from the consensus in multiple large regions. Finally, in Supplementary Figure 1E, only a minority of the 1.35.2 chromosomes are conserved (5 of 21 chromosomes are conserved to HLA-A), and the “not conserved” chromosomes are very different from the consensus sequence.
Haplotype group association with type 1 diabetes
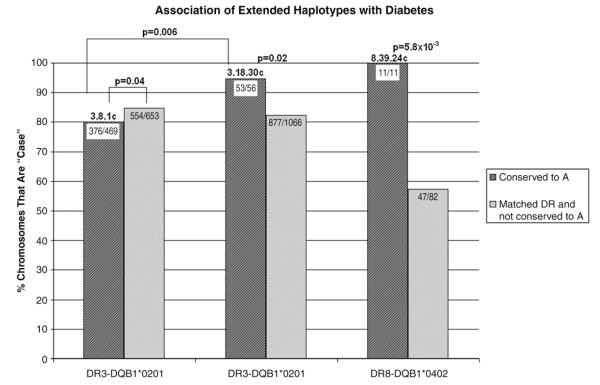
We analyzed the association of chromosomes with type 1A diabetes for conserved versus non-conserved (identical HLA-DR/DQ) haplotypes. Figure 5 and Table 2 show the three haplotype groups that were significantly associated with type 1A diabetes when compared to chromosomes with the same HLA-DR and HLA-DQ type. The conserved (from HLA-DR to HLA-A) 3.8.1 haplotype is lower risk than other DR3 chromosomes (including non-conserved 3.8.1 chromosomes) (p=0.04, OR=0.7). The 3.18.30 haplotype (the HLA-DR3-B18-A30 “Basque” haplotype) is higher risk than other DR3 chromosomes (p=0.02, OR=3.8) and is much higher risk than 3.8.1c chromosomes (p=0.006, OR=4.4). Similarly, the 8.39.24 conserved chromosomes are associated with type 1A diabetes (11/11 are DR8-B39-A24 case chromosomes versus 47/82 of other DR8 chromosomes, p=5.8×10⁻³). We also looked at these haplotype groups with respect to transmission to offspring with type 1A diabetes. Haplotypes with 3.18.30 are transmitted from heterozygous parents 78% (62/79) of the time compared to the 3.8.1 haplotype [transmitted 332/523 or 63%, p = 0.01, OR = 2.1 (95% CI=1.2–3.7)]. Of note, there is not a significant difference between the transmission of the complete 3.18.30 haplotype compared to DR3-B18 haplotype (not A30) (62/79 or 78% compared to 110/137 or 80%, p=0.86), suggesting that polymorphisms on DR3-B18 haplotypes telomeric to HLA-B are not essential for the greater transmission. In contrast the 3.8.1 haplotype does have a significantly lower risk than the DR3-B8 (not A1) [332/523 or 63% compared to 180/255 or 71%, p=0.05, OR=0.72 (95% CI=0.5–1.0)]. This suggests that polymorphisms between HLA-B and HLA-A may influence the decreased risk associated with DR3-B8 haplotypes.
Figure 5.
The percent of conserved case chromosomes in each haplotype group is plotted on the y-axis (striped bars). These are compared to non-conserved chromosomes with that same HLA-DR type (for example, the 3.8.1 striped bar contains chromosomes that are conserved from HLA-DR to HLA-A, whereas the solid bar contains both the non-conserved 3.8.1 chromosomes and the non-3.8.1 DR3 chromosomes). This allows risk from the HLA-DR type to be fixed. Only the three haplotype groups shown were significant after comparison to its corresponding HLA-DR (including DRB1*04 subtype) and HLA-DQ type.
Table 2.
Association of specific extended haplotypes with type 1 diabetes, stratified by HLA-DR type
| HLA haplotype group | OR (95% CI) | p value | Case conserved |
Case matched DR and not conserved to A |
Control conserved |
Control matched DR and not conserved to A |
|---|---|---|---|---|---|---|
| DR3-B8-A1 | 0.7 (0.53, 0.99) | 0.04 | 376 (80%) | 554 (85%) | 93 (20%) | 99 (15%) |
| DR3-B18-A30 | 3.8 (1.2, 12.3) | 0.02 | 53 (95%) | 877 (82%) | 3 (5%) | 189 (18%) |
| DR8-B39-A24 (DQB1*0402) |
17.2 (0.98, 301.56) | 5.8E–3 | 11 (100%) | 47 (57%) | 0 (0%) | 35 (43%) |
Only three haplotype groups were significantly associated with type 1 diabetes when compared to chromosomes with the same HLA-DR type. For example, the 8.39.24 conserved chromosomes were conserved from HLA-DR to HLA-A. The “matched DR and not conserved to A” bar includes non-8.39.24 DR8 chromosomes and also includes 8.39.24 chromosomes that were not conserved from HLA-DR to HLA-A.
DR8 chromosomes as an example of a general method to assess SNP-defined differential disease association
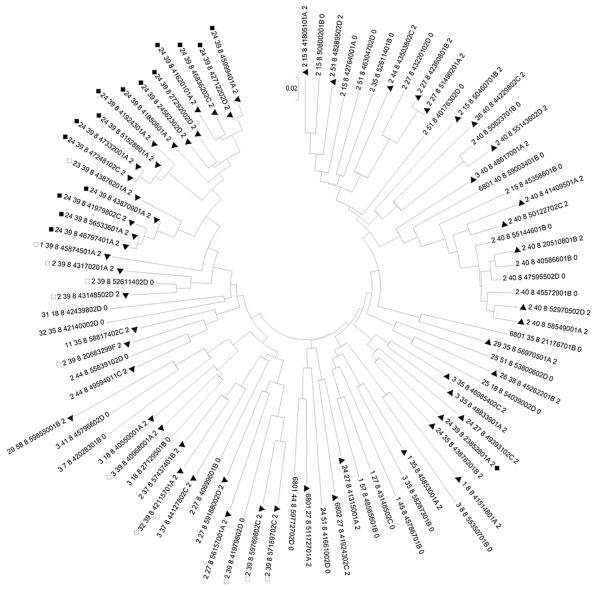
The significant association of the 8.39.24c haplotype with diabetes compelled us to examine the DR8 chromosomes in more depth. We created a DR8 tree (see Methods) using all founder DR8 chromosomes and compared them in a pairwise fashion at all 2837 SNPs (Fig. 6). There are 90 DR8 chromosomes, 58 case chromosomes (64%) and 32 control chromosomes. We noted that in the upper left corner of the tree, there are 17 case chromosomes in a row. All these 17 DR8 clustered case chromosomes contain HLA-B39, and the majority have both HLA-B39 and HLA-A24, both previously associated with type 1A diabetes [24,25]. Stratification of chromosomes by HLA-DR/DQ followed by tree analysis and detecting runs of case or control chromosomes should help identify high or lower risk variant haplotypes with identical HLA-DR and DQ alleles.
Figure 6.
HLA-DR8 neighbor-joining tree. SNP data for 90 DR8 chromosomes was analyzed with MEGA4 and a neighbor-joining tree using pairwise comparisons (see Methods). HLA data was not used to create the tree but is encoded within the ID numbers associated with each chromosome [HLA-A_HLA-B_HLA-DR_analyticID_(case =2, control=0)]. Case chromosomes are marked with a closed triangle. Chromosomes with DR8-B39-A24 are marked with closed squares, and chromosomes with DR8-B39, but not A24, are marked with open squares. Of note, one 8.39.24 chromosome does not cluster with the rest-this chromosome is the first “non-conserved” chromosome in Supplementary Figure 1C and visibly differs from the others between HLA-B and HLA-A.
Discussion
The MHC has long been known to have a number of extended or “ancestral” haplotypes with matching HLA and complement alleles. With direct sequences of specific haplotypes and analyses of SNPs across the MHC, the conservation across millions of base pairs for specific haplotypes has become apparent [13,16,26]. The current study has systematically analyzed 4386 unique chromosomes from 1240 families with HLA data, evaluating typing at 2837 SNPs. Given that we have family data, phase was determined by direct analysis of inheritance, and when ambiguous was scored as such. Eighty-two groups of chromosomes were identified with ≤10 chromosomes per group with the same HLA-DR, HLA-B and HLA-A alleles. For most groups of HLA-defined identical chromosomes, SNP typing indicated that the majority of chromosomes were essentially identical for all 1819 SNPs between HLA-DR and HLA-A. Therefore many apparently unrelated individuals have essentially complete identity across the classical MHC region from HLA-DR to HLA-A, with identity extending to the telomeric end of the analyzed panel (beyond HLA-F) for a subset. Therefore, conserved extended haplotypes are extremely common. Many of these extended haplotypes could be readily identified with specific SNPs, as has been demonstrated for the common HLA-DR3-B8-A1 haplotype [16,26]. The ability to match unrelated individuals for not simply HLA alleles [27] but for the complete MHC, using carefully selected SNPs to identify conserved haplotypes, may have practical benefits in terms of transplantation, and analysis of the clinical course of transplantation between individuals with identical extended haplotypes would be of interest.
Several of these extended haplotypes influence type 1 diabetes susceptibility beyond HLA-DR and DQ alleles. Such an influence may occur related to the specific HLA-B and HLA-A alleles, and it is of interest that the 8.39.24c haplotype (DR8-B39-A24) combines the specific HLA-B and HLA-A alleles previously individually related to diabetes risk and associated with earlier onset of type 1A diabetes [24,25,28,29]. In particular, in a recent paper by Nejentsev et al., HLA-B*39, (present in 4% of T1DGC case chromosomes and 1% of control chromosomes) accounted for the majority of the association of HLA-B with type 1 diabetes [25]. Additionally, the Nejentsev group found associations with several HLA-A alleles [25]. In addition, polymorphisms of other loci located in the conserved extended haplotypes may underlie increased susceptibility. Further analysis of both the extended haplotypes and the non-extended haplotypes should aid in resolving individual loci contributing to such differential risk. Similar analyses are likely to be of utility in studies of additional autoimmune disorders where the influences of specific alleles of genes in the MHC are not as apparent as for type 1A diabetes.
It is noteworthy that simple analysis of SNP homozygosity in 209 unrelated HapMap individuals did not identify the frequent and marked identity of haplotypes that characterizes the MHC [1]. This is probably due to the limited number of chromosomes analyzed, as even the most common haplotype, 3.8.1, is expected to be homozygous in only 0.8% of individuals. Such megabase SNP identity became apparent from the initial grouping of chromosomes with selection for identity at the very polymorphic and widely spaced HLA alleles. Though we have defined the extreme of essentially “completely” conserved haplotypes as illustrated by the examples provided, there are “non-conserved” chromosomes with discontinuous regions of conservation to the consensus haplotypes. Such regional sub-conservation may aid in further positioning of disease associated loci. A genetic “imprint” of recent positive selection is reported to be high extended haplotype homozygosity (EHH) and high population frequency [30,31]. A haplotype such as 3.8.1c is very common and shows extensive long-range conservation. This would be consistent with polymorphic genes of the MHC having a major role in shaping immune responses. Tree analysis within fixed HLA-DR/DQ chromosomes can readily identify unusual runs of case versus control chromosomes as illustrated for DR8 chromosomes. An unanswered question is whether many regions outside of the MHC contain similar and frequent extended haplotypes. Though “hot spots” and “warm spots” (regions) with increased and corresponding decreased crossing over in the MHC have been identified, analyses (e.g. analysis of sperm) indicate that recombinants occur throughout the MHC and that the genetic distance of the MHC exceeds 1.5 cM [32,33]. In addition, the overall haplotype block size for the MHC has been reported not to differ compared to other regions of the genome [32]. Existing studies of SNP homozygosity and specific studies of certain chromosomal regions suggest that extended haplotypes within Caucasian populations might well be common [1–7,34]. If this is the case, it will obviously impact firm identification of specific loci determining disease susceptibility, just as it influences the search for loci within the MHC.
Supplementary Material
Acknowledgments
This research utilizes resources provided by the Type 1 Diabetes Genetics Consortium, a collaborative clinical study sponsored by the National Institute of Diabetes and Digestive and Kidney Diseases (NIDDK), National Institute of Allergy and Infectious Diseases (NIAID), National Human Genome Research Institute (NHGRI), National Institute of Child Health and Human Development (NICHD), Juvenile Diabetes Research Foundation International (JDRF), and supported by U01 DK062418. We thank Elise Eller for bioinformatics assistance. This work was supported by the National Institutes of Health (DK32083, DK057538), Diabetes Autoimmunity Study in the Young (DAISY, DK32493), Autoimmunity Prevention Center (AI050864), Diabetes Endocrine Research Center (P30 DK57516), Clinical Research Centers (MO1 RR00069, MO1 RR00051), the Immune Tolerance Network (AI15416), the American Diabetes Association, the Juvenile Diabetes Research Foundation, the Children’s Diabetes Foundation, and the Brehm Coalition.
Footnotes
Appendix A Supplementary data Supplementary data associated with this article can be found, in the online version, at doi:10.1016/j.clim.2009.03.530.
References
- [1].Gibson J, Morton NE, Collins A. Extended tracts of homozygosity in outbred human populations. Hum. Mol. Genet. 2006;15:789–795. doi: 10.1093/hmg/ddi493. [DOI] [PubMed] [Google Scholar]
- [2].Simon-Sanchez J, Scholz S, Fung HC, Matarin M, Hernandez D, Gibbs JR, Britton A, de Vrieze FW, Peckham E, Gwinn-Hardy K, Crawley A, Keen JC, Nash J, Borgaonkar D, Hardy J, Singleton A. Genome-wide SNP assay reveals structural genomic variation, extended homozygosity and cell-line induced alterations in normal individuals. Hum. Mol. Genet. 2007;16:1–14. doi: 10.1093/hmg/ddl436. [DOI] [PubMed] [Google Scholar]
- [3].International HapMap Consortium A second generation human haplotype map of over 3.1 million SNPs. Nature. 2007;449:851–861. doi: 10.1038/nature06258. [DOI] [PMC free article] [PubMed] [Google Scholar]
- [4].Curtis D, Vine AE, Knight J. Study of regions of extended homozygosity provides a powerful method to explore haplotype structure of human populations. Ann. Hum. Genet. 2008;72:261–278. doi: 10.1111/j.1469-1809.2007.00411.x. [DOI] [PMC free article] [PubMed] [Google Scholar]
- [5].Bersaglieri T, Sabeti PC, Patterson N, Vanderploeg T, Schaffner SF, Drake JA, Rhodes M, Reich DE, Hirschhorn JN. Genetic signatures of strong recent positive selection at the lactase gene. Am. J. Hum. Genet. 2004;74:1111–1120. doi: 10.1086/421051. [DOI] [PMC free article] [PubMed] [Google Scholar]
- [6].Saunders MA, Slatkin M, Garner C, Hammer MF, Nachman MW. The extent of linkage disequilibrium caused by selection on G6PD in humans. Genetics. 2005;171:1219–1229. doi: 10.1534/genetics.105.048140. [DOI] [PMC free article] [PubMed] [Google Scholar]
- [7].International HapMap Consortium A haplotype map of the human genome. Nature. 2005;437:1299–1320. doi: 10.1038/nature04226. [DOI] [PMC free article] [PubMed] [Google Scholar]
- [8].Awdeh ZL, Raum D, Yunis EJ, Alper CA. Extended HLA/complement allele haplotypes: evidence for T/t-like complex in man. Proc. Natl Acad. Sci. U. S. A. 1983;80:259–263. doi: 10.1073/pnas.80.1.259. [DOI] [PMC free article] [PubMed] [Google Scholar]
- [9].Yunis EJ. 1987 Philip Levine award lecture. MHC haplotypes in biology and medicine. Am. J. Clin. Pathol. 1988;89:268–280. doi: 10.1093/ajcp/89.2.268. [DOI] [PubMed] [Google Scholar]
- [10].Degli-Esposti MA, Leaver AL, Christiansen FT, Witt CS, Abraham LJ, Dawkins RL. Ancestral haplotypes: conserved population MHC haplotypes. Hum. Immunol. 1992;34:242–252. doi: 10.1016/0198-8859(92)90023-g. [DOI] [PubMed] [Google Scholar]
- [11].Yunis EJ, Larsen CE, Fernandez-Vina M, Awdeh ZL, Romero T, Hansen JA, Alper CA. Inheritable variable sizes of DNA stretches in the human MHC: conserved extended haplotypes and their fragments or blocks. Tissue Antigens. 2003;62:1–20. doi: 10.1034/j.1399-0039.2003.00098.x. [DOI] [PubMed] [Google Scholar]
- [12].Alper CA, Larsen CE, Dubey DP, Awdeh ZL, Fici DA, Yunis EJ. The haplotype structure of the human major histocompatibility complex. Hum. Immunol. 2006;67:73–84. doi: 10.1016/j.humimm.2005.11.006. [DOI] [PubMed] [Google Scholar]
- [13].Aly TA, Eller E, Ide A, Gowan K, Babu SR, Erlich HA, Rewers MJ, Eisenbarth GS, Fain PR. Multi-SNP analysis of MHC region: remarkable conservation of HLA-A1-B8-DR3 haplotype. Diabetes. 2006;55:1265–1269. doi: 10.2337/db05-1276. [DOI] [PubMed] [Google Scholar]
- [14].Bilbao JR, Calvo B, Aransay AM, Martin-Pagola A, Perez d. N., Aly TA, Rica I, Vitoria JC, Gaztambide S, Noble J, Fain PR, Awdeh ZL, Alper CA, Castano L. Conserved extended haplotypes discriminate HLA-DR3-homozygous Basque patients with type 1 diabetes mellitus and celiac disease. Genes Immun. 2006;7:550–554. doi: 10.1038/sj.gene.6364328. [DOI] [PubMed] [Google Scholar]
- [15].Romero V, Larsen CE, Duke-Cohan JS, Fox EA, Romero T, Clavijo OP, Fici DA, Husain Z, Almeciga I, Alford DR, Awdeh ZL, Zuniga J, El Dahdah L, Alper CA, Yunis EJ. Genetic fixity in the human major histocompatibility complex and block size diversity in the class I region including HLA-E. BMC Genet. 2007;8:14. doi: 10.1186/1471-2156-8-14. [DOI] [PMC free article] [PubMed] [Google Scholar]
- [16].Aly TA, Baschal EE, Jahromi MM, Fernando MS, Babu SR, Fingerlin TE, Kretowski A, Erlich HA, Fain PR, Rewers MJ, Eisenbarth GS. Analysis of single nucleotide polymorphisms identifies major type 1A diabetes locus telomeric of the major histocompatibility complex. Diabetes. 2008;57:770–776. doi: 10.2337/db07-0900. [DOI] [PubMed] [Google Scholar]
- [17].O’Connell JR, Weeks DE. PedCheck: a program for identification of genotype incompatibilities in linkage analysis. Am. J. Hum. Genet. 1998;63:259–266. doi: 10.1086/301904. [DOI] [PMC free article] [PubMed] [Google Scholar]
- [18].Abecasis GR, Cherny SS, Cookson WO, Cardon LR. Merlin—rapid analysis of dense genetic maps using sparse gene flow trees. Nat. Genet. 2002;30:97–101. doi: 10.1038/ng786. [DOI] [PubMed] [Google Scholar]
- [19].Rubinstein P, Walker M, Carpenter C, Carrier C, Krassner J, Falk C, Ginsberg F. Genetics of HLA-disease associations: the use of the haplotype relative risk (HRR) and the “haplo-delta” (Dh) estimates in juvenile diabetes from three racial groups. Hum. Immunol. 1981;3:384. [Google Scholar]
- [20].Raum D, Awdeh Z, Yunis EJ, Alper CA, Gabbay KH. Extended major histocompatibility complex haplotypes in type I diabetes mellitus. J. Clin. Invest. 1984;74:449–454. doi: 10.1172/JCI111441. [DOI] [PMC free article] [PubMed] [Google Scholar]
- [21].Thomson G. Mapping disease genes: family-based association studies. Am. J. Hum. Genet. 1995;57:487–498. [PMC free article] [PubMed] [Google Scholar]
- [22].Tamura K, Dudley J, Nei M, Kumar S. MEGA4: Molecular Evolutionary Genetics Analysis (MEGA) software version 4.0. Mol. Biol. Evol. 2007;24:1596–1599. doi: 10.1093/molbev/msm092. [DOI] [PubMed] [Google Scholar]
- [23].Saitou N, Nei M. The neighbor-joining method: a new method for reconstructing phylogenetic trees. Mol. Biol. Evol. 1987;4:406–425. doi: 10.1093/oxfordjournals.molbev.a040454. [DOI] [PubMed] [Google Scholar]
- [24].Valdes AM, Erlich HA, Noble JA. Human leukocyte antigen class I B and C loci contribute to Type 1 Diabetes (T1D) susceptibility and age at T1D onset. Hum. Immunol. 2005;66:301–313. doi: 10.1016/j.humimm.2004.12.001. [DOI] [PMC free article] [PubMed] [Google Scholar]
- [25].Nejentsev S, Howson JM, Walker NM, Szeszko J, Field SF, Stevens HE, Reynolds P, Hardy M, King E, Masters J, Hulme J, Maier LM, Smyth D, Bailey R, Cooper JD, Ribas G, Campbell RD, Clayton DG, Todd JA. Localization of type 1 diabetes susceptibility to the MHC class I genes HLA-B and HLA-A. Nature. 2007;450:887–892. doi: 10.1038/nature06406. [DOI] [PMC free article] [PubMed] [Google Scholar]
- [26].Smith WP, Vu Q, Li SS, Hansen JA, Zhao LP, Geraghty DE. Toward understanding MHC disease associations: partial resequencing of 46 distinct HLA haplotypes. Genomics. 2006;87:561–571. doi: 10.1016/j.ygeno.2005.11.020. [DOI] [PubMed] [Google Scholar]
- [27].Awdeh ZL, Alper CA, Eynon E, Alosco SM, Stein R, Yunis EJ. Unrelated individuals matched for MHC extended haplotypes and HLA-identical siblings show comparable responses in mixed lymphocyte culture. Lancet. 1985;2:853–856. doi: 10.1016/s0140-6736(85)90123-0. [DOI] [PubMed] [Google Scholar]
- [28].Fennessy M, Metcalfe K, Hitman GA, Niven M, Biro PA, Tuomilehto J, Tuomilehto-Wolf E. A gene in the HLA class I region contributes to susceptibility to IDDM in the Finnish population. Childhood Diabetes in Finland (DiMe) Study Group. Diabetologia. 1994;37:937–944. doi: 10.1007/BF00400951. [DOI] [PubMed] [Google Scholar]
- [29].Noble JA, Valdes AM, Bugawan TL, Apple RJ, Thomson G, Erlich HA. The HLA class I A locus affects susceptibility to type 1 diabetes. Hum. Immunol. 2002;63:657–664. doi: 10.1016/s0198-8859(02)00421-4. [DOI] [PMC free article] [PubMed] [Google Scholar]
- [30].Sabeti PC, Reich DE, Higgins JM, Levine HZ, Richter DJ, Schaffner SF, Gabriel SB, Platko JV, Patterson NJ, McDonald GJ, Ackerman HC, Campbell SJ, Altshuler D, Cooper R, Kwiatkowski D, Ward R, Lander ES. Detecting recent positive selection in the human genome from haplotype structure. Nature. 2002;419:832–837. doi: 10.1038/nature01140. [DOI] [PubMed] [Google Scholar]
- [31].Walsh EC, Sabeti P, Hutcheson HB, Fry B, Schaffner SF, de Bakker PIW, Varilly P, Palma AA, Roy J, Cooper R, Winkler C, Zeng Y, de The G, Lander ES, O’Brien S, Altshuler D. Searching for signals of evolutionary selection in 168 genes related to immune function. Hum. Genet. 2006;119:92–102. doi: 10.1007/s00439-005-0090-0. [DOI] [PubMed] [Google Scholar]
- [32].Jeffreys AJ, Kauppi L, Neumann R. Intensely punctate meiotic recombination in the class II region of the major histocompatibility complex. Nat. Genet. 2001;29:217–222. doi: 10.1038/ng1001-217. [DOI] [PubMed] [Google Scholar]
- [33].Cullen M, Perfetto SP, Klitz W, Nelson G, Carrington M. High-resolution patterns of meiotic recombination across the human major histocompatibility complex. Am. J. Hum. Genet. 2002;71:759–776. doi: 10.1086/342973. [DOI] [PMC free article] [PubMed] [Google Scholar]
- [34].McQuillan R, Leutenegger AL, Abdel-Rahman R, Franklin CS, Pericic M, Barac-Lauc L, Smolej-Narancic N, Janicijevic B, Polasek O, Tenesa A, Macleod AK, Farrington SM, Rudan P, Hayward C, Vitart V, Rudan I, Wild SH, Dunlop MG, Wright AF, Campbell H, Wilson JF. Runs of homozygosity in European populations. Am. J. Hum. Genet. 2008;83:359–372. doi: 10.1016/j.ajhg.2008.08.007. [DOI] [PMC free article] [PubMed] [Google Scholar]
Associated Data
This section collects any data citations, data availability statements, or supplementary materials included in this article.


