

Abstract
A hierarchical block-matching motion tracking algorithm for strain imaging is presented. Displacements are estimated with improved robustness and precision by utilizing a Bayesian regularization algorithm and an unbiased subsample interpolation technique. A modified least-squares strain estimator is proposed to estimate strain images from a noisy displacement input while addressing the motion discontinuity at the wall-lumen boundary. Methods to track deformation over the cardiac cycle incorporate a dynamic frame skip criterion to process data frames with sufficient deformation to produce high signal-to-noise displacement and strain images. Algorithms to accumulate displacement and/or strain on particles in a region of interest over the cardiac cycle are described. New methods to visualize and characterize the deformation measured with the full 2D strain tensor are presented. Initial results from patients imaged prior to carotid endarterectomy suggest that strain imaging detects conditions that are traditionally considered high risk including soft plaque composition, unstable morphology, abnormal hemodynamics and shear of plaque against tethering tissue can be exacerbated by neoangiogenesis. For example, a maximum absolute principal strain exceeding 0.2 is observed near calcified regions adjacent to turbulent flow, protrusion of the plaque into the arterial lumen and regions of low echogenicity associated with soft plaques. Non-invasive carotid strain imaging is therefore a potentially useful tool for detecting unstable carotid plaque.
Introduction
One of the more common causes of stroke is emboli originating from carotid plaque, accounting for over 50% of these cases (Nikic et al 2006, Rothwell et al 2000). Chronic accumulation of plaque in the region of the carotid bulb, where the common carotid bifurcates into the internal and external carotid arteries, is common. However, not all plaques may present a high risk of rupture and subsequent ischemic events, the so-called vulnerable plaques (Kwee et al 2008). Thus, identification of vulnerable plaque is an important clinical problem because it can differentiate patients into those that are definite candidates for carotid endarterectomy or other interventional treatments, and those for whom interventional treatments may not be beneficial due to increased surgical risk.
A number of imaging techniques and modalities have been researched in attempts to quantify properties associated with vulnerable plaques. For example, high resolution obtained with computed tomography can be used to identify ulcerations on the plaque surface (Walker et al 2002) or quantify total plaque volume, calcified fibrous and lipid or hemorrhagic areas (Ajduk et al 2009, Saba et al 2008). Magnetic resonance imaging (MRI) provides better differentiation of the soft tissue components (Fabiano et al 2008, Sadat et al 2009, Yu et al 2009). High magnitude static magnetic fields and specialized coils can improve resolution of the smaller structures (Balu et al 2009). Furthermore, contrast-enhancing techniques (Patterson et al 2009, Saam et al 2007) can be used to identify ulceration, or targeted contrast agents can be used to localize the presence of plaque inflammation (Lancelot et al 2008, Sirol et al 2005). Specialized pulse sequences have also been used to quantify the deformation in the plaque caused by blood pressure pulsations in MR strain imaging methods (Draney et al 2004, Herold et al 2009, Lin et al 2008). Nuclear imaging (Boersma et al 2005, Chen and Wasserman 2005, Rominger et al 2009) and thermal, catheter-based methods (Casscells et al 1996, Kim et al 2008) have been used to identify inflammation. High resolution optical methods have been used to identify composition (Moreno et al 2002, Nadkarni et al 2007, van Soest et al 2009, Yabushita et al 2002) or plaque strain (Chan et al 2004, Karimi et al 2008, Kirkpatrick et al 2006).
The most common imaging modality used for plaque characterization is diagnostic ultrasound, which has a long clinical history in confirmation of plaque presence and the extent of stenosis. B-mode echogenicity has long been used to infer composition (Gray-Weale et al 1988, Grønholdt et al 1997, Sztajzel et al 2005), although the results are not reliable; so more complicated ultrasound tissue characterization methods have been researched (Bridal et al 1998, Waters et al 2003). Attempts have also been made to image composition with acoustic radiation force impulse (ARFI) imaging techniques (Allen et al 2011). Since they quantify the direct cause of plaque rupture, mechanical deformation, ultrasound strain imaging techniques have been examined with considerable interest. Attempts have been made with intravascular ultrasound (Cespedes et al 2000, de Korte et al 1997, Liang et al 2008) and with non-invasive externally applied transducers (Kanai et al 2003, Maurice et al 2005, Ribbers et al 2007, Schmitt et al 2007, Shi et al 2008).
Even though strain imaging holds much promise in the detection of vulnerable plaque, its success depends on the ability to measure strain accurately, with a large dynamic range, and with minimal noise. Ultrasound strain imaging of carotid plaques presents particular challenges that must be overcome for the method to be practically viable in the identification of high risk status. The plaque is small relative to the resolution of externally applied ultrasound, and the spatial strain patterns are highly heterogeneous. Deformations of the plaque occur in all directions even though displacements along the lateral direction of the transducer are difficult to robustly quantify because of poor resolution in that direction (Larsson et al 2011). Motion induced by the cardiac cycle varies in strain rate over the deformation cycle, and a cumulative quantification of strain over a cycle is desired (Ge et al 2012, McCormick 2011, Shi et al 2008).
In this paper, novel methods to address the challenges in carotid plaque strain imaging are discussed, and results are presented from in vivo case studies. A number of techniques are applied to improve robustness of the strain estimation algorithm in the context of the challenges associated with the employed imaging modality and targeted tissue (McCormick 2011, Varghese 2009, Varghese et al 2001, Ophir et al 1991). A hierarchical motion tracking approach improves robustness and handles the artery walls’ discontinuous motion. A traditional hierarchical algorithm is improved with a search region refinement scheme and scaling of the matching block-matching with strain estimated in prior levels. The improved strain estimation accuracy is complemented by resilience to peak-hopping errors with an identification and replacement strategy. Focus on high quality estimation over the cardiac cycle time course is achieved with a dynamic frame skip and a particle-based strain accumulation method.
Finally, new methods to quantify and visualize the strain tensor that take advantage of at least semi-reliable measurements of all strain tensor components, including lateral and shear components, are presented. Scalar metrics based on the yield criterion traditionally applied to the study of inanimate materials are proposed as an index of plaque vulnerability. Also, a technique to visualize the second-rank tensor with ellipse glyphs (Roe 1993, Sosa-Cabrera et al 2009) is applied.
Hierarchical framework
In this paper a multi-level block-matching algorithm (McCormick 2011) is used for motion tracking of carotid plaque images. In multi-level tracking methods (e.g. Chaturvedi et al 1998, Chen et al 2007, Chen and Varghese 2009, Ma and Varghese 2012, Patil et al 2007, Pellot-Barakat et al 2004, Shi and Varghese 2007, Srinivasan et al 2002, Li and Lee 2002, Yeung et al 1998), displacements tracked at coarser levels are interpolated to initialize the search region location at lower levels. In this work, image sets at every level are created with a scale-space representation of the images (Lindeberg 1994). The scale-space representation is chosen because it has many desirable properties including the non-enhancement property, i.e. local extrema are not enhanced (Lindeberg 1994). This is important because if the local extrema are enhanced, artifactual features may be tracked by the similarity metric used to track local displacements. Each level in the scale space is created by filtering the input radio-frequency (RF) echo-signals with a discrete Gaussian function that has a variance (f/2)2 where f is the decimation factor.
A three-level image pyramid is used for the hierarchical algorithm in this paper. The decimation factor for each level in the pyramid is given in table 1. Since image content is denser in the axial or beam direction, higher decimation is allowed in that direction.
Table 1.
Downsampling scheme used for multi-resolution image registration.
| Level | Axial decimation factor | Lateral decimation factor |
|---|---|---|
| 1 | 3 | 2 |
| 2 | 2 | 1 |
| 3 | 1 | 1 |
Search region refinement
As previously mentioned, restriction of a matching-block’s search region as finer levels in the pyramid are explored can increase the robustness of tracking. For the results presented in this paper, a simple linear function was applied to reduce the search region size from the coarsest level to the finest level. The search region size is expressed as a factor of the matching-block size and is greater than 1. For example, the search region’s radius at the top level is the search region factor times the block radius shown in table 2. No overlap in the block radius was used in the processing. This contrasts with other block-matching implementations where a tight overlap with a neighboring matching-block helps to guide the current search. Since guidance is already provided by higher levels of the pyramid, the computational burden of a small matching-block overlap can be avoided. Additionally, independent matching-blocks are preferable for the regularization method described later. Note that even if the search region factor was specified to be the same at the top level and the bottom level, the search region still shrinks in physical size since the matching-block size is specified in pixels and decimation occurs between levels.
Table 2.
Algorithm processing parameters. The block radius is in pixels and the search region factor determines the search region size, which is rounded to the nearest pixel.
| Level | Block radius | Search region factor |
|---|---|---|
| 1 (Top level) | [15, 28] | [2.2, 1.4] |
| 3 (Bottom level) | [10, 18] | [1.1, 1.1] |
While search region restriction can improve robustness, this is not true if there is poor motion tracking in the upper levels. If inaccurate motion tracking occurs at upper levels, the erroneous displacement will propagate to the finer levels. To counter this phenomenon, erroneous displacements are detected and replaced before using them to initialize the center of the search region at lower levels. Peak-hopping errors present themselves as irrationally high strains because they cause a discontinuity in the estimated displacement field. To prevent the propagation of peak-hopping errors, a strain image is generated at the higher levels. Pixels whose strain magnitude exceeds a threshold of 7.5% are marked for replacement. Displacements are then linearly interpolated across a cluster of errant pixels if the pixels are in the center of the image, or they are extrapolated with the slope of the closest good displacement pixels at the edge of the image. This process is repeated to remove any outliers that remain or were introduced.
Inter-level matching-block scaling
Signal decorrelation within a matching-block is partially caused by the strain within the block (Varghese et al 1996). The decorrelation of the matching-block can be reduced by appropriate scaling, ‘companding’, the matching-block by the local strain (Chaturvedi et al 1998, Varghese and Ophir 1997a). In the hierarchical construct, the strain found at higher levels can be used to stretch or compress the matching-block before performing cross-correlation at lower levels. This is applied to this algorithm by resampling the matching-block with windowed-sinc interpolation after anisotropically scaling the block by a factor:
| (1) |
where the scaling factor is one plus the normal strain in that direction if the strain is small. Improvement of the strain signal-to-noise ratio (SNRe), for a custom-made gelatin–agarose uniform phantom with graphite particles for scattering is demonstrated in figure 1. There is a significant improvement in the SNRe when scaling the matching-block (Varghese and Ophir 1997a). The amount of this improvement increases with strain magnitude, which can be explained by the strain filter concept (Varghese et al 1998, Varghese and Ophir 1997b). The strain filter predicts that a decrease in SNRe at higher strains is caused by decorrelation due to stretching and compression of the signal. This explains why the decrease in the SNRe at 3% strains and higher is also associated with a widening of the gap between signals that have been scaled and those that have not.
Figure 1.

Axial strain SNRe versus strain magnitude when scaling the matching-block according to the strain obtained in the previous level and without scaling. Values are the SNRe calculated over a 31 × 12 mm area surrounding the focal zone in a uniform phantom. Error bars are a single standard error computed for five measurements of the SNRe for each value.
Materials and method
Radio-frequency data are collected for longitudinal views of the carotid with the Siemens Antares clinical ultrasound system (Siemens Ultrasound, Mountain View, CA, USA). Patients are scanned prior to a carotid endarterectomy procedure after receiving informed consent on a protocol approved by the University of Wisconsin-Madison Institutional Review Board (IRB). The Siemens Antares VFX13-5 transducer excited at 11.4 MHz to collect RF at a sampling rate of 40 MHz, depth of 4 cm, and a frame rate of approximately 27 frames s−1. A dynamic frame skip and displacement interpolation algorithm, described in the next sub-sections, is used to generate a sequence of incremental displacement images that are evenly spaced in time.
Regions-of-interest (ROIs) that segment the plaque are created by a radiologist. These ROIs are drawn on a B-mode image generated from the same RF data used to perform motion tracking. B-mode and color flow images taken with clinical imaging features of the scanning system at the time of acquisition are also available to the radiologist to help distinguish atherosclerotic plaque from the lumen and surrounding tissues. Three end-diastolic frames in a dataset are segmented, which delineates two complete cardiac cycles. Contiguous regions are segmented in the image at end-diastole. Often there will be two components corresponding to an anterior and posterior component. However, a highly stenotic plaque may be segmented as a single connected component. Also, due to acoustic shadowing, a plaque may be subdivided into more than two connected components where the echo signal has reasonable amplitudes.
Dynamic frame skip
The SNRe depends on the magnitude of the strain. This was explored theoretically and experimentally by Varghese and Ophir (1997b). If the amount of deformation in the image is too low, electronic and quantization noise prevent determination of the motion in the image with precision (Varghese and Ophir 1997b). If the deformation is too high, the image pair will de-correlate significantly (Varghese and Ophir 1997b). When data are collected in vivo, a series of image frames are collected. To obtain high quality motion tracking, frame pairs should be chosen that have the amount of deformation that will yield the highest quality results. Motion tracking does not need to occur between consecutive frames. The most appropriate frame skip between the pre-deformation image and the post-deformation image should be chosen.
When the mechanical load on the tissues being imaged comes from cardiac pulsations, the strain rate in an image sequence is not constant. A higher strain rate occurs during systole, and a lower strain rate occurs at end diastole. To retain optimal tracking over a sequence of images spanning the cardiac cycle, a dynamic frame skip is applied that uses a short frame skip when the strain rate is high, and a long frame skip with strain rate is slow. The initial value of the frame skip was set to 6, which was dynamically altered based on an absolute ROI axial strain threshold of 0.05 or 5%.
To apply an automatic method that ascertains an ideal frame skip, the optimal deformation must be defined in a quantifiable way. This is application specific. For example, when the objective is to get a strain image of a breast tissue abnormality, the frame average strain may be a good measure. When imaging carotid plaques, we are only interested in the strain inside the plaque (Makris and Nicolaides 2010). There is relatively little deformation in the skin and muscle near the transducer, but the deformation in these areas should not determine the frame skip. Also, there may be apparently high strain in the region of the lumen, but tracking in this area is unreliable. The criterion that determines the frame skip in this paper is based on the axial strain in a sub-region of the image. The top and bottom portions are removed from the ROI because the skin and fat near the transducer are not the target tissue of interest and because attenuation decreases signal quality at depths beyond the vessel. Peak-hopping errors generally are also undesirable, which will present as unrealistically high strains. Peak-hopping is acceptable in the lumen, however; therefore the second frame skip criterion is percent axial strain pixels in the ROI over a threshold.
When it is time to track the next frame pair in a sequence, the previous frame skip is initially attempted. If both criteria are below threshold, the frame skip is increased until they exceed threshold, and the prior tracking result is used. An exception to the prior behavior is a halt to the increase in the frame skip if the magnitude of the strain decreases, which could occur during the transition from systole to diastole or at the dichrotic notch. On the other hand, if either criterion is above the threshold, the frame skip is decreased until they are below threshold. Frame skip calculated for a patient is shown in figure 2.
Figure 2.

Frame skip for tracking of subject 157’s left carotid over the period of a single cardiac cycle. A small frame skip is used during systole when the strain rate is high, and a larger frame skip is used during diastole when the strain rate is small. The maximum frame skip was limited to six frames.
Displacement estimation
Motion tracking is performed with a hierarchical block-matching technique, implemented in C++. A multi-resolution, multi-threaded block-matching framework is implemented on top of the Insight Toolkit (Ibanez et al 2003, Yoo et al 2002). The similarity metric used for comparing a matching-block in the pre-deformation image in its search region in the post-deformation image is normalized cross-correlation. Recursive Bayesian regularization using three iterations (McCormick et al 2011) is used to improve the quality of the tracked displacements at each level with a strain sigma parameter value of 0.07, which is related to the expected amount of strain, for both axial and lateral displacements and strains. Parabolic interpolation is used to find subsample displacements at the upper levels, and windowed-sinc interpolation with numerical optimization (McCormick 2011) is used to find subsample displacements at the final level. A central-difference gradient with an order of accuracy of 4 (McCormick 2011) is used to estimate strains at the higher levels where displacement vector sampling is very coarse. Strains at the higher levels are used to remove peak-hopping pixels and to scale the matching-block in subsequent levels.
Displacements are tracked from a continuous sequence of RF data acquired on the longitudinal views of the carotid as described. Values of the matching-block used in the algorithm are shown in table 2. Upsampling on the input two byte signed integer input RF data is performed with windowed-sinc interpolation by a factor of 2 both in the axial and lateral direction. The size of the matching-block is specified in samples. To ensure the window is centered on a point, the length of the matching-block is specified as a radius so that the length of a window is 2r + 1, where r is the radius.
Strain estimation
Eulerian incremental frame-to-frame strains at the final level are estimated using the modified least-squares estimator (Kallel and Ophir 1997). Prior to strain estimation, the displacements are filtered with a small 3 × 3 median filter to remove outliers. The strain sequence is estimated using a least-squares gradient over a 3 × 3 pixel radius. To get the strain that occurs over a cardiac cycle, the deformations calculated with the dynamic frame skip tracking must be accumulated. An end diastolic state or image frame is taken as the reference state. Since the strains observed in a cardiac cycle are typically large, >0.05, accumulating infinitesimal strain is inappropriate. Since the displacements are calculated incrementally, the reference material is always changing, and a Eulerian–Almansi strain tensor should be accumulated because it consistently specifies strain in terms of the spatial configuration (Haupt 2002).
Two additional factors make calculation of the accumulated strain non-trivial. First, the displacement and strain fields are discretely sampled and saved as digital data. Secondly, the plaque moves in its location with the image over the cardiac cycle. To address these challenges, a particle method is applied to the purpose of finding the accumulated strain. First the plaque ROI is segmented by a radiologist at end-diastole with the medical interaction toolkit (MITK) (Maleike et al 2009). This creates a binary label image. All the points in the binary image labeled as plaque are used to create a quadrilateral mesh. Accumulated strain and accumulated displacement is then calculated over the points in the mesh. For every frame, the mesh is first warped by the incremental displacement by translating coordinates of the points in the mesh. This translation is determined via bilinear interpolation of the incremental displacement vector image. The incremental strain or incremental displacement for each point in the mesh is found with bilinear interpolation and added to the accumulated strain or accumulated displacement for that point (particle). This process is repeated for every frame. Since coordinates of particles in the mesh are recorded as real numbers, this system handles subpixel displacements well. Note that the mesh is warped prior to adding the incremental strain for a given frame because we are using Eulerian–Almansi strain instead of Green–Lagrangian strain.
Calculation of derived quantities
The purpose of non-invasive in vivo characterization of carotid plaque deformation is to generate a quantity that indicates vulnerability to failure or plaque rupture, thrombogenesis and ultimately ischemic burden. A number of quantities are derived from the strain tensor over the cardiac cycle as potential indicators of plaque vulnerability on ROI demarcated on the B-mode image shown in figure 3. A binary connected component image is transformed into a mesh. Strains tensors and displacement vectors are accumulated on particles in the mesh as described above in the section on strain estimation. Eigen analysis is performed on the accumulated strain tensors to calculate the principal strains, described in appendix A. The principal strains are used to evaluate the strain metrics: maximum principal strain, maximum shear strain, total strain energy and distortional energy. The definitions of these strain metrics is discussed in appendix B. To summarize, these metrics define scalars derived from the second-rank tensor that serve as a yield criterion, quantities such that if they exceed a threshold, the material will begin to fail. The maximum principal strain suggests that the tissue can only withstand a certain normal strain. Maximum shear strain assumes the material can only withstand a certain shear strain. For a given strain tensor, there is one direction where the maximum normal strain occurs and the maximum shear strain occurs, and the maximum principal and shear strain give the values of these quantities in that direction. Total strain energy and distortional energy yield criteria imply that failure is an energy-dependent process. Plaque is a complex material that contains cholesterol, fibrous, calcified, smooth muscle and hemorrhagic components connected into an amorphous mass. It is also living tissue that dynamically changes its content and connectedness in response to processes like remodeling and inflammation. Therefore, it is difficult to predict a priori the yield criterion that best describe the failure process.
Figure 3.

Subject 157 ROIs, where the particle strains explored in figures 4–7, are tracked over the cardiac cycle.
Results
Plots of the strain components and strain metrics estimated for subject 157 in the ROI shown in figure 3 are presented in figures 4–7. Twenty randomly selected particles, i.e. mesh points, in the anterior ROI shown in figure 3 are singled out and their accumulated strain values plotted against time. Possibly due to movement in and out of the imaging plane or motion tracking errors, a drift in the accumulated strain is often observed (Shi and Varghese 2007). When there is significant out-of-plane motion, this drift may be explained by the fact that a particle is not accumulating over the same volume of tissue. To compensate for this, the offset at the end of the cycle is linearly removed from every curve. All quantities should start from zero and return to zero if the system is steady state. While it is true that tissue obviously remains intact over the examination, some real drift may exist due to breathing, muscle tone, etc.
Figure 4.

Axial strain over the cardiac cycle for 20 randomly selected particles from the anterior ROI highlighted in figure 3.
Figure 7.

Strain metrics over the cardiac cycle for 20 randomly selected particles from the anterior ROI highlighted in figure 3. (a) Maximum principal strain, (b) maximum shear strain, (c) total strain energy and (d) distortional energy.
Axial strain refers to the normal component of the strain tensor along the axis of the ultrasound beam. In figure 3, the ultrasound axial direction is to some degree aligned with the radial direction of the vessel. As blood pressure increases, compression is expected in the radial direction (Hansen et al 2010), which is consistent with the mostly negative strains observed at systole in figure 4. In contrast, the shear strains shown in figure 5 are primarily positive. The magnitude of the shear strain is higher than the axial or lateral strains in figures 4 or 6. Lateral strains in figure 6 demonstrate systole and diastole clearly as with the other plots, but do not have a consistent sign. Some strains are positive, which indicates tissue stretching. The orientation of the plaque and the mechanical loading it experiences does not consistently align with the lateral transducer direction, which explains this variance. While the common carotid can be aligned orthogonally to the transducer, the internal carotid artery often deviates in a posterior direction as it progresses toward the brain; the magnitude of this directional change is subject specific. This dependence of axial, lateral and shear strains on the orientation of the transducer makes interpretation of their patterns difficult as does their non-scalar dimensionality. These factors favor the use of the ellipses or strain tensor metrics for interpretation of physiological processes.
Figure 5.

Shear strain over the cardiac cycle for 20 randomly selected particles from the anterior ROI highlighted in figure 3.
Figure 6.

Lateral strain over the cardiac cycle for 20 randomly selected particles from the anterior ROI highlighted in figure 3.
Components of the strain tensor can have positive or negative sign, but all strain metrics should be strictly positive. This is true for all the strain metrics in figure 7. If this was not true, strain estimation noise or excessive out-of-plane motion could be suspected. All metrics show a high strain during systole with a slow retraction during diastole. The separation of high strains is accented in the distortional energy plot of figure 7(d)) because of squared terms in its expression. The piecewise linear pattern in all plots is attributed to the dynamic frame skip technique, described in the materials and method section. The linearity validates the incremental displacement interpolation algorithm described in the materials and method section, and the increased duration of the piecewise segments during diastole shows the automatic strain assessment method performed properly. The automatic strain assessment method could be improved by decreasing the frame skip slightly at the end of systole here to capture the dynamics associated with the abrupt cessation of the myocardial deformation.
Over the cardiac cycle, the three components of the strain tensor, the maximum principal strain, maximum shear strain, total strain energy, and distortional energy vary over time and over a contiguous region. For each of these values, three scalar statistics are calculated per cardiac cycle. The mean peak-to-peak value reflects the average strain in a region. Since material failure is likely to occur at a location of high strain, the 90th percentile of the peak-to-peak value is also calculated. A 90th percentile is used instead of the absolute maximum because outliers sometimes arise from part of the ROI crossing into the lumen or movement out-of-plane. Third, the standard deviation of the particle peak-to-peak value is found. This is because strain heterogeneity may mark the presence of highly varying strains beyond the resolution of the system. These three values are found for all strain metrics and strain components. The mean, 90th percentile, and standard deviation of the sum of the magnitude of the strain rate is also computed. The strain rate is considered because it is hypothesized that viscoelastic behavior may also contribute to the fatigue failure process.
Images for four different in vivo plaque case studies that demonstrate different behaviors for the plots are shown in figures 4–7. These results suggest that strain imaging may measure the end effect of many factors that influence plaque vulnerability, i.e. tissue composition (figure 8), morphology (figure 9) and angiogenesis (figure 10). Limitations due to acoustic shadowing is also illustrated in figure 11.
Figure 8.

A hypoechoic atherosclerotic mass, often classified as ‘soft’ plaque, that exhibit high strain throughout the plaque. (a) Accumulated displacement vectors (movement is primarily in superior direction), (b) strain tensor ellipses, (c) maximum absolute principal strain, (d) maximum shear strain, (e) total strain energy, (f) distortional energy. The displacement vector glyphs are scaled by four times their true value.
Figure 9.

Strain pattern in an echogenically homogeneous plaque that varies depending on the geometry of the plaque and its position relative to blood flow. (a) Displacement vectors, (b) strain tensor ellipses, (c) distortional energy, (d) maximum shear strain. The displacement vector glyphs are scaled by four times their true value.
Figure 10.

High strain near the interface of the plaque with the surrounding tissue that occurs with lateral motion of the plaque. (a) Strain tensor ellipses, (b) maximum absolute principal strain, (c) maximum shear strain, (d) axial strain, (e) shear strain and (f) lateral strain.
Figure 11.

Low strain in a calcified plaque, but high strain in other areas. (a) Displacement vectors, (b) strain tensor ellipses, (c) maximum absolute principal strain, (d) maximum shear strain, (e) total strain energy, (f) distortional energy. The displacement vector glyphs are scaled by four times their true value.
Hypoechoic plaque with high strain
Hypoechoic B-mode presentation is generally associated with lipid or hemorrhagic plaque content. It has traditionally been hypothesized that soft plaques may be a sign of vulnerability. In figure 8, a hypoechoic plaque from the right side of subject 154 is shown to have increased strains throughout the plaque. Strain in the posterior plaque segment (found deeper in the image), is higher than the anterior plaque segment. This pattern is common, and could be related to material properties of the tissue surrounding the anterior segment compared to the material properties surrounding the posterior segment, or it could be related to the compression supplied by the transducer (Maurice et al 2008). The mean peak-to-peak maximum absolute principal strain is 0.23 and the 90th percentile is 0.41 in the posterior segment. There is little difference in the distribution of the strain metrics in this case with the possible exception of the total strain energy, which is more reserved in the anterior segment. These strain tensor ellipses allow easy comprehension of the magnitude, orientation and distribution of the strain. The changing orientations of the ellipses explain the contours of low strain metric amplitude in figures 8(c) and (d); low strain metric amplitude occurs with transitions in the orientation of deformations. Displacements illustrated in figure 8(a) are large and predominantly lateral, which underscores the need for good lateral tracking.
Importance of morphology
The dominant focus of various imaging and other diagnostic techniques is identification of plaque composition. While composition may be an important factor in plaque vulnerability, it is not the only factor. In figure 9, a plaque with a relatively homogeneous B-mode echogenicity is shown, which suggests that its composition may be homogeneous. However, since mechanical loading (stress) is applied via blood pressure, a heterogeneous strain distribution results. Strain is highest in the center of the larger anterior plaque region and falls off towards its edges. The area of the posterior plaque segment that protrudes into the lumen experiences much higher strain than other areas. As also indicated by the displacement vectors in figure 9(a), the tissue is consistently sheared from right-to-left in the image, inferior-to-superior in the subject, for both the anterior and posterior ROIs. This strain pattern contrasts with pattern expected with thick-walled cylindrical structures where radial strain is lower in a thick-walled region relative to a thin-walled region. However, because of the non-cylindrical morphology or possible turbulent flow near the stenosis, this pattern is not observed.
Subtle but significant differences in the strain metrics shown in figures 9(c) and (d) are apparent. The squared terms in the distortional energy accentuate the locations of highest strain compared to the maximum shear strain. These images are from the left side of subject 157.
Differences in the strain metrics are also apparent in the supplemental videos of the same dataset (available from stacks.iop.org/PMB/57/7329/mmedia). The videos present the various quantities that result from motion tracking. The displacement vectors confirm that the motion is not simple shear or compression of the plaque, but a more complex pattern due to plaque morphology. When examining the different components of strain, i.e. the axial, lateral and shear strain components, it is observed that the majority of the strain at the center of the plaque is quantified as shear strain with this probe orientation, the strain near the distal base of the plaque is primarily in the axial direction, and there is relatively little lateral strain (note that all color maps have the same scale). The magnitude of all these components is summarized in the strain metric videos, and both the magnitude and relative size of these components are reflected in size and orientation of the tensor glyph video. In these videos, it is readily observed that the shape influences the high magnitude strain in the large central region of the anterior plaque and that the small segment in the posterior segment experiences high strain because it juts into the lumen.
Strain at the plaque–adventitia interface
Recall that angiogenesis has also been proposed in the literature as a possible factor leading to plaque vulnerability (Hermus et al (2010), Hiyama et al (2010), ten Kate et al (2010)). As plaques become larger, the vasa vasorum that provided blood to the artery wall can grow to feed the enlarged tissue. These fissures are expected to cause instability associated with the adventitia-plaque boundary where angiogenesis originates. Figure 9 shows high strains at this location occurring during lateral motion of the plaque that may be associated with this phenomenon. These images are from the left side of subject 156.
Examining the strain tensor ellipses or the strain metric images, we easily locate the areas of high strain. A single component of the strain tensor does not always provide sufficient information. In this case, for example, the high strain is not apparent in the axial or lateral strain images. Note that the ellipses are orientated at an angle of 3π/4 because of the orientation and deformation of the plaque. This off-axis orientation explains why the strain is best reflected in the shear strain component in this case. If the plaque was orientated in a more horizontal direction relative to the transducer, the strain would then arise in the lateral component. Again, note that the area of the anterior plaque that protrudes into the lumen is subject to high strains.
Calcified plaque with shadowing
It is well known that calcified plaques are associated with high acoustic attenuation and that they are extremely stiff. The increased attenuation explains the acoustic shadowing on these images of the left side of subject 158. As the displacement vectors indicate in figure 11(a), this plaque undergoes a torsional motion when subject to the pressure pulse (see supplemental videos, available from stacks.iop.org/PMB/57/7329/mmedia, that show an abrupt change in displacement vector direction and large local strain tensor magnitude). Very little strain occurs in the highly calcified region that causes the shadowing. In other areas of the plaque that appear to have heterogeneous calcification, very high strains occur. Examination of the strain time series suggests that this may result from a combination of heterogeneous calcification, morphology and hemodynamics.
This case also illustrates a limitation of non-invasive externally applied ultrasound imaging. Motion tracking cannot be performed when calcified plaques attenuate the ultrasound beam to undetectable levels. Furthermore, the 2D imaging method can only capture a small subset of the imaging planes available. For a heterogeneous structure like carotid plaques, a critical region may be overlooked. Additionally, not all components of the 3D strain tensor are captured. Strain imaging in the transverse plaque is made more difficult by the motion pattern that occurs in this direction and refraction of the beam by the artery wall (Hansen et al 2009, 2010). When considering these complex physiological conditions that result in heterogeneous strain distributions, it would be reasonable to expect that focal areas with rapidly changing, large strain tensor glyphs, especially those near the lumen or material boundaries, are possible locations of rupture and suggest vulnerability.
Discussion
Carotid plaque characterization using ultrasound strain imaging is important because of its possible role in detecting plaque prone to rupture. The stroke pathogenesis targeted in this work is primarily emboli originating from carotid plaque. This is one of the more common causes of stroke, underlying over 50% of strokes (Nikic et al 2006, Rothwell et al 2000). However, plaque rupture is caused by extrinsic hemodynamic forces (Schroeder and Falk 1996, Wootton and Ku 1999). Computational finite element analysis has shown that peak wall shear stress is roughly proportional to flow rate at the carotid bifurcation in healthy arteries (Younis et al 2003). Cyclic hemodynamic pulse pressure has been associated with carotid plaque ulceration (Lovett et al 2003). Turbulent flow resulting from severe stenosis can increase root mean square pressure fluctuations by 3.6 fold when stenosis increases from 80% to 90% (Loree et al 1991). Hemodynamic forces vary from patient to patient with hypertension, pulsatility, and turbulence influenced by the bifurcation and plaque morphology. While heterogeneous plaque composition has extensively been examined as an identifier of vulnerable plaque, this complex physiological environment results in a heterogeneous strain distribution caused by a combination of factors including plaque composition, blood pressure, vasa vasorum, inflammation and plaque morphology.
Noise due to out-of-plane motion, image decorrelation, discretization, and limited image frequency content make it difficult to robustly quantify plaque strain in vivo. A number of techniques have been described to improve the robustness of the strain images. A Bayesian regularization technique that greatly improves the robustness of the tracked images was utilized in this paper. This regularization technique was parameterized by the amount of expected strain. An unbiased subsample displacement interpolation method that reduces bias errors, especially in the lateral direction, was also utilized. The quality of the strain images were kept high by using a dynamic incremental frame skip, while an algorithm was presented to still obtain the incremental strain at equal time steps. A multi-level motion tracking framework further improved algorithm robustness.
Tracking lower frequency image content with large matching-blocks reduced peak-hopping errors. Search region reduction over levels also decreased peak-hopping errors. Inter-level scaling of the matching-block improved overall tracking quality. In prior strain imaging work, obtaining all components of the strain tensor proved difficult because of the lower resolution in the lateral direction. Because of the algorithmic methods employed, effective quantification of all components of the 2D strain tensor was achieved. It was also shown how the strain tensor can be represented with an elliptical glyph. New quantities derived from the strain tensors that have been used in other contexts as material failure criteria were proposed as indices of plaque vulnerability.
In this study, all the carotid plaque subjects that were evaluated fall into the category, traditionally considered to be clinically significant, based on NASCET criteria (NASCET 1991), i.e. all the subjects examined in this study, have a maximum stenosis of 70% or higher. The irregular transition to and from the maximum stenosis, which is often in the high 90% range, invariably occurs over a short length, from approximately the last 10 mm of the common carotid, through the bulb, and disappearing again within 5 mm of the internal carotid. For these reasons, it is more informative to observe quantities that are coordinate system independent, such as the strain tensor ellipses or the scalar strain metric since simple patterns are not expected in the axial, lateral or shear strain.
Observation of quantities directly dependent on lateral displacement estimates, the lateral strain and shear strain, does serve as a sanity check that these quantities contribute additional value to the analysis as opposed to predominantly noise. Traditionally, ultrasound strain imaging experiences significant challenges in extracting utility from lateral motion estimates because of the lower resolution in the lateral direction. We observe that the methods described in this paper improve the lateral displacement dependent images to a degree that they provide added value. This has important clinical impact because of the nature of the mechanical system at hand, complex morphologies, etc, as previously discussed. While the true underlying in vivo deformations are unknown, observations of the spatial and time-dependent variations of the lateral and shear strains although large relative to the axial strains over a cardiac cycle, may provide useful information for clinical diagnosis. Example observations include figures 3–6 and the supplemental videos clips (available from stacks.iop.org/PMB/57/7329/mmedia) included with the paper.
Four case studies were then examined that demonstrated strain image features and how they correspond to different conditions associated with plaque vulnerability. A hypoechoic plaque, associated with soft, weak materials, exhibited high strain. High strain was also observed in a region where a plaque protruded into the lumen. In the third case, high strain was observed local to a post-stenotic region with turbulent flow. A large amount of longitudinal deformation at the base of a plaque was also observed, which possibly may be attributed to the shape of the plaque or vasa vasorum. Finally, a plaque that had many abrupt transitions between calcified and soft areas presented high strain in these transition regions.
Conclusion
In vivo ultrasonic strain imaging is a promising technique for the identification of carotid plaques likely to rupture and cause subsequent acute stroke or chronic ischemic cognitive decline because it directly quantifies the mechanism of rupture, plaque deformation. However, there are significant challenges to the robust, non-invasive measurement estimation of in vivo plaque strain, especially in the lateral direction. An algorithmic framework for multi-resolution robust estimation of all components of the carotid plaque strain tensor is presented in this paper with features such as search region refinement, matching-block scaling, dynamic frame skip, detection and correction of peak-hopping artifacts, and particle-based accumulation over the cardiac cycle. Scalar metrics derived from the strain tensor are proposed as the basis for an index of plaque vulnerability, and ellipse glyph-based visualization techniques is used for deformation visualization. Case studies on subjects with interesting morphological, composition and hemodynamic characteristics suggest the algorithm may be capable of quantifying vulnerability, but examination of a high volume of patients are required to determine the clinical specificity and sensitivity of the method.
Supplementary Material
Acknowledgments
This work was supported in part by NIH grants R21 EB010098-02, R01 NS064034-01A2 and R01CA112192-S103. Dr McCormick, PhD was also supported by grant nos T90DK070079 and R90DK071515 from the National Institute of Diabetes and Digestive and Kidney Diseases.
Appendix A. Representation of the 2D strain tensor as an ellipse
Since strain is a tensor instead of a scalar, it is not rotation invariant. Consequently, for the same tissue deformation, the axial strain in a certain volume of tissue will change depending on the orientation of the beam axis relative to the tissue. When a tensor is subject to a linear transformation, such as a rotation, the transformed tensor is given by (Lai et al 1993)
| (A.1) |
where Q is the transformation on the tensor T. There is a particular rotation of the strain tensor E that provides a more transparent interpretation of the tensor.
Recall that
| (A.2) |
if E is a tensor, n is a vector, and λ is a scalar, n is called an eigenvector of E, and λ is an eigenvalue of E. Basic linear algebra states that every real, symmetric tensor will have eigenvalues and corresponding eigenvectors that are mutually perpendicular (Lai et al 1993). Since the strain tensor is a real, symmetric tensor, it has eigenvalues and eigenvectors. If unit length eigenvectors are used as the columns of a transformation matrix for the associated tensor, the transformed result will be a diagonal matrix whose entries are the eigenvalues. The eigenvalues of E are called the principal strains of E, and the eigenvectors of E are called the principal directions of E (Lai et al 1993).
Rotating a tensor is equivalent to looking at the tensor in a different coordinate system orientation. With this in mind, the principal directions define the most convenient orientation to view a strain tensor. The principal strains have the largest possible magnitude of normal strain. No shear strains are present.
A strain tensor describes the change in relationship between two small vectors in a body. Second-rank tensors in general are characterized by how they modify these two vectors. The quadric operation of the strain tensor on a differential line segment in a body effectively relates the stretching or compression of that segment. Similar to the second rank diffusion tensor in magnetic resonance imaging (Basser 1994, Pierpaoli and Basser 1996, Roe 1993), the strain tensor can be visualized as an ellipse in 2D or an ellipsoid in 3D (Roe 1993, Sosa-Cabrera et al 2009). This representation is called a Lame ellipsoid (Sosa-Cabrera et al 2009).
Note that this geometrical representation does not always strictly follow from the strain tensor. The diffusion tensor is positive definite (Basser 1994); therefore, its determinant is always positive and its eigenvalues are always positive. This is not true for the strain tensor; the principal strains can be positive (stretching) or negative (compression). In fact, due to the Poisson effect (Srinath 2003), stretching of a material in one direction often causes stresses that drive compressions in the orthogonal directions, and the signs of the principal strains are usually varied. In 2D, if one of the principal strains is negative, the expression is no longer represented by an ellipse but by a hyperbola:
| (A.3) |
In 3D, if one of the principal strains is negative the quadratic expression specifies a hyperboloid of one sheet, and if two of the principal strains are negative, then the quadric surface is a hyperboloid of two sheets (Roe 1993). Unfortunately, hyperboloids are not closed surfaces, and it is difficult to visualize it as a glyph. Therefore, the strain is represented as an ellipse or ellipsoid where the lengths of the principal axes are the absolute value of the principal strains, and the orientation of the ellipse is specified by the principal directions. An interpretation of the ellipse is therefore the stretching or compression that occurs in a given direction. Visualization of the noiseless strain tensor image for a cylindrical inclusion undergoing uniaxial compression is shown in figure A.1.
Figure A.1.
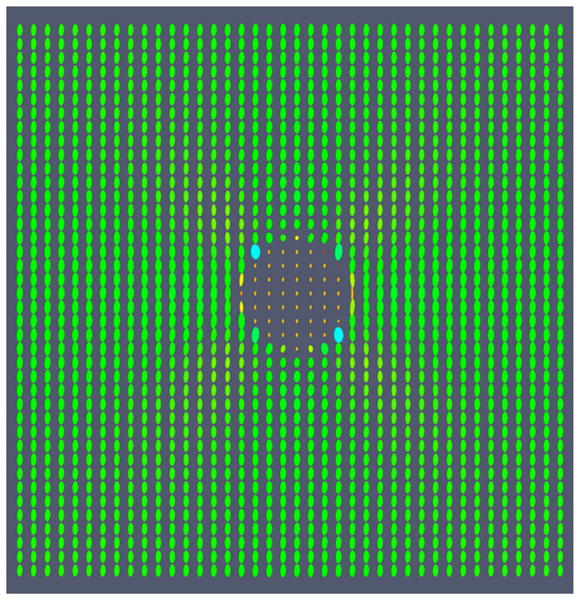
Visualization of the strain tensor field for a cylindrical inclusion undergoing uniaxial compression. The ellipses are colored on a scale according to the magnitude of their major principal axis; the color is not related to the sign of tensor eigenvalues and does not reflect the compressive on tensile status.
Appendix B. Combination of normal and shear strains into a single strain index
It is easier to perform statistical hypothesis testing with a single, scalar strain statistic than with the full second-order tensor. With the appropriate scalar quantity derived from the tensor, comparisons can be made to other metrics that quantify plaque vulnerability, and a number that indexes likeliness of plaque rupture will hopefully be obtained. The three strain tensor components estimated from a 2D image can be combined into a single strain index using metrics developed in the field of material plasticity theory. In material plasticity theory, a yield criterion prescribes the point a deformed material will no longer return to its original state after the load is removed (Srinath 2003). Yield criteria that have been studied for engineering materials include the maximum principal strain, the maximum shear stress (Tresca yield criterion), the total strain energy, or the distortion energy (von Mises yield criterion) (Srinath 2003). These criteria compare a single index to a material-dependent threshold that determines the transition point from elastic (recoverable) to plastic (non-recoverable) deformation. They are most often given in stress form, but here their 2D strain analogs are used with our 2D strain tensor imaging algorithm data. For example the ordered principal strains, λ1 > λ2, strain metrics to examine include the maximum principal strain,
| (B.1) |
the maximum shear strain,
| (B.2) |
total strain energy,
| (B.3) |
and the distortional energy,
| (B.4) |
The latter has been used by Maurice et al (2004) for the examination of carotid plaque. Note that although the modulus, E, is unknown, plaque materials that have a low E generally possess a low ultimate failure strain (Holzapfel et al 2004). Thus, a plaque region with a high energy metric is likely near the failure strain if it has a high modulus and high failure strain or if it has a low modulus and low failure strain. In other words, since E is unknown, the ‘total strain energy’ and ‘distortional energy’ calculated is only proportional to these quantities. However, this may be sufficient because of the material properties of the plaque constituents.
Contributor Information
M McCormick, Email: matt@mmmccormick.com.
T Varghese, Email: tvarghese@wisc.edu.
References
- Ajduk M, Pavic L, Bulimbasic S, Sarlija M, Pavic P, Patrlj L, Brkljacic B. Multidetector-row computed tomography in evaluation of atherosclerotic carotid plaques complicated with intraplaque hemorrhage. Ann Vasc Surg. 2009;23:186–93. doi: 10.1016/j.avsg.2008.05.008. [DOI] [PubMed] [Google Scholar]
- Allen JD, Ham KL, Dumont DM, Sileshi B, Trahey GE, Dahl JJ. The development and potential of acoustic radiation force impulse (ARFI) imaging for carotid artery plaque characterization. Vasc Med. 2011;16:302–11. doi: 10.1177/1358863X11400936. [DOI] [PMC free article] [PubMed] [Google Scholar]
- Balu N, Yarnykh VL, Scholnick J, Chu B, Yuan C, Hayes C. Improvements in carotid plaque imaging using a new eight-element phased array coil at 3T. J Magn Reson Imaging. 2009;30:1209–14. doi: 10.1002/jmri.21890. [DOI] [PMC free article] [PubMed] [Google Scholar]
- Basser P. MR diffusion tensor spectroscopy and imaging. Biophys J. 1994;66:259–67. doi: 10.1016/S0006-3495(94)80775-1. [DOI] [PMC free article] [PubMed] [Google Scholar]
- Boersma HH, Kietselaer BL, Stolk LM, Bennaghmouch A, Hofstra L, Narula J, Heidendal GA, Reutelingsperger CP. Past, present, and future of annexin A5: from protein discovery to clinical applications. J Nucl Med. 2005;46:2035–50. [PubMed] [Google Scholar]
- Bridal SL, Toussaint JF, Raynaud JS, Fornes P, Leroy-Willig A, Berger G. US backscatter and attenuation 30 to 50 MHz and MR T2 at 3 Tesla for differentiation of atherosclerotic artery constituentsin vitro. IEEE Trans Ultrason Ferroelectr Freq Control. 1998;45:1517–25. doi: 10.1109/58.738291. [DOI] [PubMed] [Google Scholar]
- Casscells W, Hathorn B, David M, Krabach T, Vaughn WK, McAllister HA, Bearman G, Willerson JT. Thermal detection of cellular infiltrates in living atherosclerotic plaques: possible implications for plaque rupture and thrombosis. Lancet. 1996;347:1447–51. doi: 10.1016/s0140-6736(96)91684-0. [DOI] [PubMed] [Google Scholar]
- Cespedes EI, de Korte CL, van der Steen AFW. Intraluminal ultrasonic palpation: assessment of local and cross-sectional tissue stiffness. Ultrasound Med Biol. 2000;26:385–96. doi: 10.1016/s0301-5629(99)00169-6. [DOI] [PubMed] [Google Scholar]
- Chan RC, Chau A, Karl W, Nadkarni SK, Khalil A, Iftimia N, Shishkov M, Tearney GJ, Kaazempur-Mofrad MR, Bouma B. OCT-based arterial elastography: robust estimation exploiting tissue biomechanics. Opt Express. 2004;12:4558–72. doi: 10.1364/opex.12.004558. [DOI] [PubMed] [Google Scholar]
- Chaturvedi P, Insana MF, Hall TJ. 2-D companding for noise reduction in strain imaging. IEEE Trans Ultrason Ferroelectr Freq Control. 1998;45:179–91. doi: 10.1109/58.646923. [DOI] [PubMed] [Google Scholar]
- Chen H, Shi H, Varghese T. Improvement of elastographic displacement estimation using a two-step cross-correlation method. Ultrasound Med Biol. 2007;33:48–56. doi: 10.1016/j.ultrasmedbio.2006.07.022. [DOI] [PMC free article] [PubMed] [Google Scholar]
- Chen H, Varghese T. Multi-level hybrid 2-D strain imaging algorithm for ultrasound sector/phased arrays. Med Phys. 2009;36:2098–106. doi: 10.1118/1.3121426. [DOI] [PMC free article] [PubMed] [Google Scholar]
- Chen JW, Wasserman BA. Vulnerable plaque imaging. Neuroimaging Clin N Am. 2005;15:609–21. doi: 10.1016/j.nic.2005.08.005. [DOI] [PubMed] [Google Scholar]
- de Korte CL, Cespedes EI, van der Steen AF, Lancee CT. Intravascular elasticity imaging using ultrasound: feasibility studies in phantoms. Ultrasound Med Biol. 1997;23:735–46. doi: 10.1016/s0301-5629(97)00004-5. [DOI] [PubMed] [Google Scholar]
- Draney MT, Arko FR, Alley MT, Markl M, Herfkens RJ, Pelc NJ, Zarins CK, Taylor CA. Quantification of vessel wall motion and cyclic strain using cine phase contrast MRI: in vivo validation in the porcine aorta. Magn Reson Med. 2004;52:286–95. doi: 10.1002/mrm.20137. [DOI] [PubMed] [Google Scholar]
- Fabiano S, Mancino S, Stefanini M, Chiocchi M, Mauriello A, Spagnoli LG, Simonetti G. High-resolution multicontrast-weighted MR imaging from human carotid endarterectomy specimens to assess carotid plaque components. Eur Radiol. 2008;18:2912–21. doi: 10.1007/s00330-008-1091-x. [DOI] [PubMed] [Google Scholar]
- Ge W, Krueger CG, Weichmann A, Shanmuganayagam D, Varghese T. Displacement and strain estimation for evaluation of arterial wall stiffness using a familial hypercholesterolemia swine model of atherosclerosis. Med Phys. 2012;39:4483–92. doi: 10.1118/1.4722746. [DOI] [PMC free article] [PubMed] [Google Scholar]
- Gray-Weale AC, Graham JC, Burnett JR, Byrne K, Lusby RJ. Carotid artery atheroma: comparison of preoperative B-mode ultrasound appearance with carotid endarterectomy specimen pathology. J Cardiovasc Surg (Torino) 1988;29:676–81. [PubMed] [Google Scholar]
- Grønholdt ML, Wiebe BM, Laursen H, Nielsen TG, Schroeder TV, Sillesen H. Lipid-rich carotid artery plaques appear echolucent on ultrasound B-mode images and may be associated with intraplaque haemorrhage. Eur J Vasc Endovasc Surg. 1997;14:439–45. doi: 10.1016/s1078-5884(97)80121-9. [DOI] [PubMed] [Google Scholar]
- Hansen HH, Lopata RG, de Korte CL. Noninvasive carotid strain imaging using angular compounding at large beam steered angles: validation in vessel phantoms. IEEE Trans Med Imaging. 2009;28:872–80. doi: 10.1109/TMI.2008.2011510. [DOI] [PubMed] [Google Scholar]
- Hansen HH, Lopata RG, Idzenga T, de Korte CL. Full 2D displacement vector and strain tensor estimation for superficial tissue using beam-steered ultrasound imaging. Phys Med Biol. 2010;55:3201–18. doi: 10.1088/0031-9155/55/11/014. [DOI] [PubMed] [Google Scholar]
- Haupt P. Continuum Mechanics and Theory of Materials. New York: Springer; 2002. [Google Scholar]
- Herold V, et al. In vivo comparison of atherosclerotic plaque progression with vessel wall strain and blood flow velocity in apoE(−/−) mice with MR microscopy at 17.6 T. MAGMA. 2009;22:159–66. doi: 10.1007/s10334-008-0160-0. [DOI] [PubMed] [Google Scholar]
- Hermus L, Lefrandt JD, Tio RA, Breek JC, Zeebregts CJ. Carotid plaque formation and serum biomarkers. Atherosclerosis. 2010;213:21–29. doi: 10.1016/j.atherosclerosis.2010.05.013. [DOI] [PubMed] [Google Scholar]
- Hiyama T, Tanaka T, Endo S, Komine K, Kudo T, Kobayashi H, Shiokawa Y. Angiogenesis in atherosclerotic plaque obtained from carotid endarterectomy: association between symptomatology and plaque morphology. Neurol Med Chir. 2010;50:1056–61. doi: 10.2176/nmc.50.1056. [DOI] [PubMed] [Google Scholar]
- Holzapfel GA, Sommer G, Regitnig P. Anisotropic mechanical properties of tissue components in human atherosclerotic plaques. Trans ASME, J Biomech Eng. 2004;126:657–65. doi: 10.1115/1.1800557. [DOI] [PubMed] [Google Scholar]
- Ibanez L, Schroeder W, Ng L, Cates J. The ITK Software Guide. Clifton Park, NY: Kitware Inc; 2003. [Google Scholar]
- Kallel F, Ophir J. A least-squares strain estimator for elastography. Ultrason Imaging. 1997;19:195–208. doi: 10.1177/016173469701900303. [DOI] [PubMed] [Google Scholar]
- Kanai H, Hasegawa H, Ichiki M, Tezuka F, Koiwa Y. Elasticity imaging of atheroma with transcutaneous ultrasound: preliminary study. Circulation. 2003;107:3018–21. doi: 10.1161/01.CIR.0000078633.31922.8A. [DOI] [PubMed] [Google Scholar]
- Karimi R, Zhu T, Bouma BE, Mofrad MR. Estimation of nonlinear mechanical properties of vascular tissues via elastography. Cardiovasc Eng. 2008;8:191–202. doi: 10.1007/s10558-008-9061-0. [DOI] [PMC free article] [PubMed] [Google Scholar]
- Kim K, Huang SW, Hall TL, Witte RS, Chenevert TL, O’Donnell M. Arterial vulnerable plaque characterization using ultrasound-induced thermal strain imaging (TSI) IEEE Trans Biomed Eng. 2008;55:171–80. doi: 10.1109/TBME.2007.900565. [DOI] [PubMed] [Google Scholar]
- Kirkpatrick SJ, Wang RK, Duncan DD. OCT-based elastography for large and small deformations. Opt Express. 2006;14:1585–97. doi: 10.1364/oe.14.011585. [DOI] [PubMed] [Google Scholar]
- Kwee RM, van Oostenbrugge RJ, Hofstra L, Teule GJ, van Engelshoven JM, Mess WH, Kooi ME. Identifying vulnerable carotid plaques by noninvasive imaging. Neurology. 2008;70:2401–9. doi: 10.1212/01.wnl.0000314697.76580.cb. [DOI] [PubMed] [Google Scholar]
- Lai WM, Rubin D, Krempl E. Introduction to Continuum Mechanics. Oxford: Elsevier; 1993. [Google Scholar]
- Lancelot E, et al. Evaluation of matrix metalloproteinases in atherosclerosis using a novel noninvasive imaging approach. Arterioscler Thromb Vasc Biol. 2008;28:425–32. doi: 10.1161/ATVBAHA.107.149666. [DOI] [PubMed] [Google Scholar]
- Larsson M, Kremer F, Claus P, Kuznetsova T, Brodin LA, D’hooge J. Ultrasound-based radial and longitudinal strain estimation of the carotid artery: a feasibility study. IEEE Trans Ultrason Ferroelectr Freq Control. 2011;58:2244–51. doi: 10.1109/TUFFC.2011.2074. [DOI] [PubMed] [Google Scholar]
- Li PC, Lee WN. An efficient speckle tracking algorithm for ultrasonic imaging. Ultrason Imaging. 2002;24:215–28. doi: 10.1177/016173460202400402. [DOI] [PubMed] [Google Scholar]
- Liang Y, Zhu H, Friedman MH. Estimation of the transverse strain tensor in the arterial wall using IVUS image registration. Ultrasound Med Biol. 2008;34:1832–45. doi: 10.1016/j.ultrasmedbio.2008.04.005. [DOI] [PubMed] [Google Scholar]
- Lin AP, Bennett E, Wisk LE, Gharib M, Fraser SE, Wen H. Circumferential strain in the wall of the common carotid artery: comparing displacement-encoded and cine MRI in volunteers. Magn Reson Med. 2008;60:8–13. doi: 10.1002/mrm.21621. [DOI] [PMC free article] [PubMed] [Google Scholar]
- Lindeberg T. Scale-Space Theory in Computer Vision. Stockholm: Kluwer; 1994. [Google Scholar]
- Loree HM, Kamm RD, Atkinson CM, Lee RT. Turbulent pressure-fluctuations on surface of model vascular stenoses. Am J Physiol. 1991;261:H644–50. doi: 10.1152/ajpheart.1991.261.3.H644. [DOI] [PubMed] [Google Scholar]
- Lovett JK, Howard SC, Rothwell PM. Pulse pressure is independently associated with carotid plaque ulceration. J Hypertens. 2003;21:1669–76. doi: 10.1097/00004872-200309000-00016. [DOI] [PubMed] [Google Scholar]
- Ma C, Varghese T. Lagrangian displacement tracking using a polar grid between endocardial and epicardial contours for cardiac strain imaging. Med Phys. 2012;39:1779–92. doi: 10.1118/1.3691905. [DOI] [PMC free article] [PubMed] [Google Scholar]
- Makris GC, Nicolaides AN. Introduction to the biomechanics of carotid plaque pathogenesis and rupture: review of the clinical evidence. Br J Radiol. 2010;83:729–35. doi: 10.1259/bjr/49957752. [DOI] [PMC free article] [PubMed] [Google Scholar]
- Maleike D, Nolden M, Meinzer H, Wolf I. Interactive segmentation framework of the medical imaging interaction toolkit. Comput Methods Programs Biomed. 2009;96:72–83. doi: 10.1016/j.cmpb.2009.04.004. [DOI] [PubMed] [Google Scholar]
- Maurice RL, Daronat M, Ohayon J, Stoyanova E, Foster FS, Cloutier G. Non-invasive high-frequency vascular ultrasound elastography. Phys Med Biol. 2005;50:1611–28. doi: 10.1088/0031-9155/50/7/020. [DOI] [PubMed] [Google Scholar]
- Maurice RL, Ohayon J, Finet G, Cloutier G. Adapting the Lagrangian speckle model estimator for endovascular elastography: theory and validation with simulated radio-frequency data. J Acoust Soc Am. 2004;116:1276–86. doi: 10.1121/1.1771615. [DOI] [PubMed] [Google Scholar]
- Maurice RL, Soulez G, Giroux MF, Cloutier G. Noninvasive vascular elastography for carotid artery characterization on subjects without previous history of atherosclerosis. Med Phys. 2008;35:3436–43. doi: 10.1118/1.2948320. [DOI] [PubMed] [Google Scholar]
- McCormick MM. PhD Thesis. University of Wisconsin-Madison; WI, USA: 2011. Carotid plaque characterization with medical ultrasound. [Google Scholar]
- McCormick MM, Rubert N, Varghese T. Bayesian regularization applied to ultrasound strain imaging. IEEE Trans Biomed Eng. 2011;58:1612–20. doi: 10.1109/TBME.2011.2106500. [DOI] [PMC free article] [PubMed] [Google Scholar]
- Moreno PR, Lodder RA, Purushothaman KR, Charash WE, O’Connor WN, Muller JE. Detection of lipid pool, thin fibrous cap, and inflammatory cells in human aortic atherosclerotic plaques by near-infrared spectroscopy. Circulation. 2002;105:923–7. doi: 10.1161/hc0802.104291. [DOI] [PubMed] [Google Scholar]
- Nadkarni SK, Pierce MC, Park BH, de Boer JF, Whittaker P, Bouma BE, Bressner JE, Halpern EF, Houser SL, Tearney GJ. Measurement of collagen and smooth muscle cell content in atherosclerotic plaques using polarization-sensitive optical coherence tomography. J Am Coll Cardiol. 2007;49:1474–81. doi: 10.1016/j.jacc.2006.11.040. [DOI] [PMC free article] [PubMed] [Google Scholar]
- NASCET Clinical alert: benefit of carotid endarterectomy for patients with high-grade stenosis of the internal carotid artery. Stroke. 1991;22:816–7. doi: 10.1161/01.str.22.6.816. [DOI] [PubMed] [Google Scholar]
- Nikic P, Savic M, Jakovljevic V, Djuric D. Carotid atherosclerosis, coronary atherosclerosis and carotid intima-media thickness in patients with ischemic cerebral disease: Is there any link? Exp Clin Cardol. 2006;11:102–6. [PMC free article] [PubMed] [Google Scholar]
- Ophir J, Cespedes I, Ponnekanti H, Yazdi Y, Li X. Elastography: a quantitative method for imaging the elasticity of biological tissues. Ultrason Imaging. 1991;13:111–34. doi: 10.1177/016173469101300201. [DOI] [PubMed] [Google Scholar]
- Patil AV, Garson CD, Hossack JA. 3D prostate elastography: algorithm, simulations and experiments. Phys Med Biol. 2007;52:3643–63. doi: 10.1088/0031-9155/52/12/019. [DOI] [PubMed] [Google Scholar]
- Patterson AJ, U-King-Im JM, Tang TY, Scoffings DJ, Howarth SP, Graves MJ, Gillard JH. Association between white matter ischemia and carotid plaque morphology as defined by high-resolution in vivo MRI. Eur J Vasc Endovasc Surg. 2009;38:149–54. doi: 10.1016/j.ejvs.2009.04.005. [DOI] [PubMed] [Google Scholar]
- Pellot-Barakat C, Frouin F, Insana MF, Herment A. Ultrasound elastography based on multiscale estimations of regularized displacement fields. IEEE Trans Med Imaging. 2004;23:153–63. doi: 10.1109/TMI.2003.822825. [DOI] [PMC free article] [PubMed] [Google Scholar]
- Pierpaoli C, Basser PJ. Toward a quantitative assessment of diffusion anisotropy. Magn Reson Med. 1996;36:893–906. doi: 10.1002/mrm.1910360612. [DOI] [PubMed] [Google Scholar]
- Roe J. Elementary Geometry. New York: Oxford University Press; 1993. [Google Scholar]
- Ribbers H, Lopata RG, Holewijn S, Pasterkamp G, Blankensteijn JD, de Korte CL. Noninvasive two-dimensional strain imaging of arteries: validation in phantoms and preliminary experience in carotid arteries in vivo Ultrasound. Med Biol. 2007;33:530–40. doi: 10.1016/j.ultrasmedbio.2006.09.009. [DOI] [PubMed] [Google Scholar]
- Rominger A, Saam T, Wolpers S, Cyran CC, Schmidt M, Foerster S, Nikolaou K, Reiser MF, Bartenstein P, Hacker M. 18F-FDG PET/CT identifies patients at risk for future vascular events in an otherwise asymptomatic cohort with neoplastic disease. J Nucl Med. 2009;50:1611–20. doi: 10.2967/jnumed.109.065151. [DOI] [PubMed] [Google Scholar]
- Rothwell PM, Villagra R, Gibson R, Donders RC, Warlow CP. Evidence of a chronic systemic cause of instability of atherosclerotic plaques. Lancet. 2000;355:19–24. doi: 10.1016/s0140-6736(99)04470-0. [DOI] [PubMed] [Google Scholar]
- Saam T, Hatsukami TS, Takaya N, Chu B, Underhill HR, Kerwin WS, Cai J, Ferguson MS, Yuan C. The vulnerable, or high-risk, atherosclerotic plaque: noninvasive MR imaging for characterization and assessment. Radiology. 2007;244:64–77. doi: 10.1148/radiol.2441051769. [DOI] [PubMed] [Google Scholar]
- Saba L, Sanfilippo R, Montisci R, Mallarini G. Agreement between multidetector-row CT angiography and ultrasound echo-color Doppler in the evaluation of carotid artery stenosis. Cerebrovasc Dis. 2008;26:525–32. doi: 10.1159/000160209. [DOI] [PubMed] [Google Scholar]
- Sadat U, Weerakkody RA, Bowden DJ, Young VE, Graves MJ, Li ZY, Tang TY, Gaunt ME, Hayes PD, Gillard JH. Utility of high resolution MR imaging to assess carotid plaque morphology: a comparison of acute symptomatic, recently symptomatic and asymptomatic patients with carotid artery disease. Atherosclerosis. 2009;207:434–9. doi: 10.1016/j.atherosclerosis.2009.05.002. [DOI] [PubMed] [Google Scholar]
- Schmitt C, Soulez G, Maurice RL, Giroux MF, Cloutier G. Noninvasive vascular elastography: toward a complementary characterization tool of atherosclerosis in carotid arteries. Ultrasound Med Biol. 2007;33:1841–58. doi: 10.1016/j.ultrasmedbio.2007.05.020. [DOI] [PubMed] [Google Scholar]
- Schroeder AP, Falk E. Pathophysiology and inflammatory aspects of plaque rupture. Cardiol Clin. 1996;14:211–20. doi: 10.1016/s0733-8651(05)70274-5. [DOI] [PubMed] [Google Scholar]
- Shi H, Mitchell CC, McCormick M, Kliewer MA, Dempsey RJ, Varghese T. Preliminary in vivo atherosclerotic carotid plaque characterization using the accumulated axial strain and relative lateral shift strain indices. Phys Med Biol. 2008;53:6377–94. doi: 10.1088/0031-9155/53/22/008. [DOI] [PMC free article] [PubMed] [Google Scholar]
- Shi H, Varghese T. Two-dimensional multi-level strain estimation for discontinuous tissue. Phys Med Biol. 2007;52:389–401. doi: 10.1088/0031-9155/52/2/006. [DOI] [PubMed] [Google Scholar]
- Sirol M, Fuster V, Badimon JJ, Fallon JT, Moreno PR, Toussaint JF, Fayad ZA. Chronic thrombus detection with in vivo magnetic resonance imaging and a fibrin-targeted contrast agent. Circulation. 2005;112:1594–600. doi: 10.1161/CIRCULATIONAHA.104.522110. [DOI] [PubMed] [Google Scholar]
- Sosa-Cabrera D, Krissian K, Gonzalez-Fernandez J, Gomez-Deniz L, Rovaris E, Castano-Moraga C, Ruiz-Alzola J. Advances in Pattern Recognition: part IV. Berlin: Springer; 2009. Strain tensor elastography: 2D and 3D visualizations Tensors in Image Processing and Computer Vision; pp. 381–403. [Google Scholar]
- Srinath LS. Advanced Mechanics of Solids. New York: McGraw-Hill; 2003. [Google Scholar]
- Srinivasan S, Kallel F, Ophir J. Estimating the elastographic signal-to-noise ratio using correlation coefficients. Ultrasound Med Biol. 2002;28:359–68. doi: 10.1016/s0301-5629(01)00510-5. [DOI] [PubMed] [Google Scholar]
- Sztajzel R, Momjian S, Momjian-Mayor I, Murith N, Djebaili K, Boissard G, Comelli M, Pizolatto G. Stratified gray-scale median analysis and color mapping of the carotid plaque: correlation with endarterectomy specimen histology of 28 patients. Stroke. 2005;36:741–5. doi: 10.1161/01.STR.0000157599.10026.ad. [DOI] [PubMed] [Google Scholar]
- ten Kate GL, Sijbrands EJ, Valkema R, ten Cate FJ, Feinstein SB, van der Steen AF, Daemen MJ, Schinkel AF. Molecular imaging of inflammation and intraplaque vasa vasorum: a step forward to identification of vulnerable plaques? J Nucl Cardiol. 2010;17:897–912. doi: 10.1007/s12350-010-9263-x. [DOI] [PMC free article] [PubMed] [Google Scholar]
- van Soest G, Goderie TP, Gonzalo N, Koljenovic S, van Leenders GL, Regar E, Serruys PW, van der Steen AF. Imaging atherosclerotic plaque composition with intracoronary optical coherence tomography. Neth Heart J. 2009;17:448–50. doi: 10.1007/BF03086301. [DOI] [PMC free article] [PubMed] [Google Scholar]
- Varghese T. Quasi-static ultrasound elastography. Ultrasound Clin. 2009;4:323–38. doi: 10.1016/j.cult.2009.10.009. [DOI] [PMC free article] [PubMed] [Google Scholar]
- Varghese T, Bilgen M, Ophir J. Multiresolution imaging in elastography. IEEE Trans Ultrason Ferroel Freq Cont. 1998;45:65–75. doi: 10.1109/58.646912. [DOI] [PubMed] [Google Scholar]
- Varghese T, Ophir J. Enhancement of echo-signal correlation in elastography using temporal stretching. IEEE Trans Ultrason Ferroelectr Freq Control. 1997a;44:173–80. doi: 10.1109/58.585213. [DOI] [PubMed] [Google Scholar]
- Varghese T, Ophir J. A theoretical framework for performance characterization of elastography: the strain filter. IEEE Trans Ultrason Ferroelectr Freq Control. 1997b;44:164–72. doi: 10.1109/58.585212. [DOI] [PubMed] [Google Scholar]
- Varghese T, Ophir J, Cespedes I. Noise reduction in elastograms using temporal stretching with multicompression averaging. Ultrasound Med Biol. 1996;22:1043–52. doi: 10.1016/s0301-5629(96)00128-7. [DOI] [PubMed] [Google Scholar]
- Varghese T, Ophir J, Konofagou E, Kallel F, Righetti R. Tradeoffs in elastographic imaging. Ultrason Imaging. 2001;23:216–48. doi: 10.1177/016173460102300402. [DOI] [PubMed] [Google Scholar]
- Walker LJ, Ismail A, McMeekin W, Lambert D, Mendelow AD, Birchall D. Computed tomography angiography for the evaluation of carotid atherosclerotic plaque: correlation with histopathology of endarterectomy specimens. Stroke. 2002;33:977–81. doi: 10.1161/01.str.0000013562.73522.82. [DOI] [PubMed] [Google Scholar]
- Waters KR, Bridal SL, Cohen-Bacrie C, Levrier C, Fornès P, Laugier P. Parametric analysis of carotid plaque using a clinical ultrasound imaging system. Ultrasound Med Biol. 2003;29:1521–30. doi: 10.1016/j.ultrasmedbio.2003.08.007. [DOI] [PubMed] [Google Scholar]
- Wootton DM, Ku DN. Fluid mechanics of vascular systems, diseases, and thrombosis. Annu Rev Biomed Eng. 1999;1:299–329. doi: 10.1146/annurev.bioeng.1.1.299. [DOI] [PubMed] [Google Scholar]
- Yabushita H, et al. Characterization of human atherosclerosis by optical coherence tomography. Circulation. 2002;106:1640–5. doi: 10.1161/01.cir.0000029927.92825.f6. [DOI] [PubMed] [Google Scholar]
- Yeung F, Levinson SF, Parker KJ. Multilevel and motion model-based ultrasonic speckle tracking algorithms. Ultrasound Med Biol. 1998;24:427–42. doi: 10.1016/s0301-5629(97)00281-0. [DOI] [PubMed] [Google Scholar]
- Yoo TS, Ackerman MJ, Lorensen WE, Schroeder W, Chalana V, Aylward S, Metaxes D, Whitaker R. Engineering and algorithm design for an image processing API A Technical Report on ITK—The Insight Toolkit. Amsterdam: IOS Press; 2002. [PubMed] [Google Scholar]
- Younis HF, Kaazempur-Mofrad MR, Chung C, Chan RC, Kamm RD. Computational analysis of the effects of exercise on hemodynamics in the carotid bifurcation. Ann Biomed Eng. 2003;31:995–1006. doi: 10.1114/1.1590661. [DOI] [PubMed] [Google Scholar]
- Yu W, Underhill HR, Ferguson MS, Hippe DS, Hatsukami TS, Yuan C, Chu B. The added value of longitudinal black-blood cardiovascular magnetic resonance angiography in the cross sectional identification of carotid atherosclerotic ulceration. J Cardiovasc Magn Reson. 2009;11:1–10. doi: 10.1186/1532-429X-11-31. [DOI] [PMC free article] [PubMed] [Google Scholar]
Associated Data
This section collects any data citations, data availability statements, or supplementary materials included in this article.