

Abstract
The scaffolding protein WAVE-1 (Wiskott-Aldrich syndrome protein family member 1) directs signals from the GTPase Rac through the Arp2/3 complex to facilitate neuronal actin remodeling. The WAVE-associated GTPase activating protein called WRP is implicated in human mental retardation, and WAVE-1 knock-out mice have altered behavior. Neuronal time-lapse imaging, behavioral analyses, and electrophysiological recordings from genetically modified mice were used to show that WAVE-1 signaling complexes control aspects of neuronal morphogenesis and synaptic plasticity. Gene targeting experiments in mice demonstrate that WRP anchoring to WAVE-1 is a homeostatic mechanism that contributes to neuronal development and the fidelity of synaptic connectivity. This implies that signaling through WAVE-1 complexes is essential for neural plasticity and cognitive behavior.
Keywords: WAVE-1, WRP, actin, Arp2/3, dendritic spine, synaptic plasticity
Introduction
The small-molecular-weight GTPases Rho, Rac, and Cdc42 (cell division cycle 42) function as molecular switches to modulate the activity of downstream cellular effectors (Etienne-Manneville and Hall, 2002). Rac signaling is synchronized by the WAVE (Wiskott-Aldrich syndrome protein family)/Scar (suppressor of cAMP receptor) family of scaffolding proteins (Machesky and Insall, 1998). The three WAVE isoforms (WAVE-1, WAVE-2 and WAVE-3) are modular proteins, each with an N-terminal Scar homology domain (SHD), a central proline-rich region, and a C-terminal Verprolin–Cofilin–Acidic (VCA) domain. These protein interaction modules permit assembly of multiprotein complexes. Proteomic and biochemical studies have shown that the SHD domain binds a core unit of four proteins that regulate Rac signaling at sites of actin reorganization (Eden et al., 2002; Innocenti et al., 2004; Steffen et al., 2004). The proline-rich region encompasses several recognition sites for Src homology 3 (SH3) domain-containing proteins including the Ableson tyrosine kinase (Abl) and the WAVE-associated Rac GTPase-activating protein (GAP) called WRP [also MEGAP (mental disorder-associated GAP)/SrGAP3 (SLIT-ROBO Rho GTPase-activating protein 3)] (Westphal et al., 2000; Soderling et al., 2002). The principal function of the VCA domain is to bind the Arp2/3 complex, a group of seven proteins that stimulate branched actin polymerization (Bear et al., 1998; Machesky and Insall, 1998). Arp2/3-mediated formation of a dense branched actin network is critical for membrane protrusion. Structural studies show that WAVE binding induces a conformational change in Arp2/3 to provide a template that nucleates branched actin polymerization (Volkmann et al., 2001; Rodal et al., 2005).
Accumulating evidence implies that WAVE complexes participate in neuronal development. Disruption of the WAVE gene in Drosophila causes morphological defects such as ectopic midline crossing and synapse undergrowth in the larval neuromuscular junction (Schenck et al., 2004). These results suggest that WAVE signaling may regulate axonal outgrowth and synapse development. Imaging studies have shown that mammalian WAVE-1 is present in the leading edges of lamellipodia in neuronal growth cones in which it may play a role in the organization of these structures (Nozumi et al., 2003). WAVE-1 knock-out mice exhibit deficits in sensorimotor function and perform poorly in cognitive tests (Soderling et al., 2003). Interestingly, some of these behavioral phenotypes overlap with the symptoms of a syndromic form of mental retardation in humans called 3p-syndrome (Endris et al., 2002). Positional cloning techniques have shown that disruption of the WRP gene contributes to 3p-syndrome (Endris et al., 2002). We have shown previously that WRP associates with WAVE-1 via a C-terminal SH3 domain and have found two stretches of proline-rich sequences between amino acids 320–332 and 420–433 that participate in these protein–protein interactions (Soderling et al., 2002).
Here, using the WAVE-1 knock-out mice as a model, we find that loss of this scaffolding protein impacts neuronal growth cone dynamics and morphology. Histological examination of the WAVE-1 knock-out mice revealed changes in spine density and electrophysiological analyses demonstrate abnormalities in synaptic plasticity. To establish whether the interaction between WAVE-1 and WRP contributes to the control of complex cognitive processes, we generated mice that express a form of WAVE-1 without the WRP binding sites (mWAVE-1). We find that these mWAVE-1 knock-in animals have reduced spine density and altered synaptic plasticity, in addition to specific deficits in memory retention. These studies show that WRP anchored to WAVE-1 plays a role in the control of cytoskeletal events that underlie normal neuronal development and synaptic plasticity.
Materials and Methods
Gene targeting
A bacterial artificial chromosome containing WAVE-1 (Incyte Genomics, St. Louis, MO) was used to subclone genomic DNA (gDNA) encompassing exons 3–8 by bacterial recombineering as described previously (Liu et al., 2003). A neomycin cassette was inserted within the intron immediately upstream of exon 7, again by bacterial recombineering. One of the homology arms for the neomycin targeting contained the mWAVE-1 mutations, thus simultaneously inserting the neomycin cassette and mutating exon 7. Correctly targeted embryonic stem (ES) cells were identified by PCR using primers within and outside of the gDNA contained in the targeting construct. Carryover of the mWAVE-1 mutations along with the neomycin cassette was confirmed by PCR cloning gDNA from targeted ES cells and sequencing. Chimeric mice were generated at the University of Cincinnati according to established protocols. Chimeric offspring were bred to C57BL/6 mice (The Jackson Laboratory, Bar Harbor, ME), establishing germ-line transmission, and bred further to C57BL/6 mice for colony expansion.
Animals
All mice and rats were housed in the Vollum Institute and Oregon Health and Science University Animal Care Facility, and all procedures were approved by the Institutional Animal Care and Use Committee. Animals used for behavioral analysis (n = 10 for each genotype) were littermates from heterozygous mating pairs that had been backcrossed for two generations. Mice were housed individually during the behavioral testing, and the tests were administered in order of increasing stress levels.
Behavioral tests
The rotorod, anxiety tests, Morris water maze, and novel-object recognition tests were performed as described previously (Benice et al., 2006) and in brief below.
Morris water maze.
Mice were trained with the platform clearly marked by a beacon (days 1 and 2; visible platform) and then trained with the beacon removed (days 3–5; hidden platform), during which the mice had to navigate by using spatial cues found throughout the room. Each day there were two sessions, 3.5 h apart, each consisting of three 60 s trials. Two hours after the second session of hidden platform training, the platform was removed and a probe trial was conducted. Mice were recorded during each trial with a Noldus Instrument Ethovision video tracking system (Noldus Information Technology, Sterling, VA).
Novel object recognition.
For 3 consecutive days, the mice were individually habituated to a square open field (16 × 16 inches; Hamilton-Kinder, Powa, CA) for 5 min. On the fourth day, the mice were first trained in three consecutive 10 min familiarization trails with three plastic toy objects (one in each corner). Each mouse was then tested in (1) one novelty location trial in which one object was moved to a new location, and then in (2) an object novelty recognition trial in which one familiar object was replaced with a novel object. All objects and the arena were thoroughly cleaned with 5% acetic acid between trials to remove odors.
Cultured hippocampal neurons and quantitative image analysis
Hippocampal neurons were prepared by two different methods. For transfection and quantification of spines (see Fig. 5E–H), hippocampal neurons were cultured from postnatal day 1–2 Sprague Dawley rats as described previously (Oh and Derkach, 2005). Transfections were performed on 8 d in vitro (DIV) neurons using Lipofectamine 2000 (Invitrogen, Carlsbad, CA). Four days later, the cells were fixed in 4% paraformaldehyde and 4% sucrose in PBS, pH 7.4, and mounted in Prolong Antifade (Invitrogen).
Figure 5.

Anchored WRP regulates spine density via WAVE-1 and Arp2/3. Hippocampal sections of wild-type (A) and mWAVE knock-in (B) mice after Golgi impregnation show dendritic segments of neurons. Quantitation of spine density (spines/100 μm) from hippocampus (C; area CA1) (*p = 0.0375 using two-tailed unpaired t test) and cortex (D; layer 1) (**p = 0.0015 using two-tailed unpaired t test). E, F, Fluorescence image of a section of dendrite showing the spine density in cultured hippocampal neurons expressing either YFP–actin (E) or WAVE-1 444–559EE and YFP–actin (F). G, Quantification of spine density (spines/100 μm) (**p = 0.0027 using two-tailed unpaired t test). H, Quantification of spine morphology (ratio of spines with heads/filopodial spines) (**p = 0.033 using two-tailed unpaired t test). All data are presented as mean ± SEM. Scale bars, 5 μm.
For all other experiments, primary neuronal cultures were prepared from hippocampi of embryonic day 17.5 (E17.5) mice, as described previously (Banker, 1998). Genotyping of mouse embryos was done as described previously (Soderling et al., 2003). Dissociated neurons were plated onto poly-l-lysine-treated glass coverslips at a density of 25–50 cells/mm2 and cocultured over a monolayer of astrocytes. Cells were maintained in Neurobasal medium (Invitrogen) supplemented with B27 and Glutamax. Plasmid DNA was introduced by electroporation using the Amaxa (Gaithersburg, MD) nucleofection protocol or using Lipofectamine 2000. Neurons were imaged on DIV1–DIV2 for growth cone analysis, on DIV5 for outgrowth measurements, or on DIV21 for visualization of immunostaining in spines. Digital images were collected using high-numerical aperture objectives and a MicroMax 1300YHS CCD camera (Roper Scientific, Tucson, AZ) mounted on a Leica (Bannockburn, IL) DM-RXA microscope or using a Yokogawa CSU-10 Nipkow Spinning Disk confocal head (Solamere Technologies, Salt Lake City, UT) and a Cascade 512B CCD camera (Roper Scientific) mounted on a Nikon (Tokyo, Japan) TE-2000 microscope. Quantitative analysis of total neurite outgrowth (sum of axon and dendrite lengths) and spine density from three independent experiments was performed using NIH Image J software. For morphology measurements in Figure 5H, spine heads were defined as terminal enlargements that were at least twice the width of the spine shaft. Roundness measurements were made using Leica ASMDW software (Leica), and kymograph analysis was done using MetaMorph software (Molecular Devices, Downingtown, PA).
Histology and spine density analysis
Brains from three wild-type and three age-matched WAVE null adult mice were impregnated according to the Golgi procedure (Ramon-Moliner, 1970) using Rapid GolgiStain reagents (FD NeuroTechnologies, Ellicott City, MD), cut at 150 μm with a cryostat, and mounted in Permount (Fisher Scientific, Pittsburgh, PA). Bright-field z-series images of apical dendrites from area CA1 of the hippocampus and layer 1 of the cortex were acquired using a CoolSnap HQ CCD camera (Roper Scientific) mounted on a Leica ASMDW. Representative images displayed are minimum projections from z-series stacks (see Figs. 2L,M, 5A,B).
Figure 2.

WAVE-1 is localized to spines and regulates spine density. A, Composite image of 21 d in vitro cultured wild-type hippocampal neurons immunostained for WAVE-1 (green), F-actin (red), and PSD-95 (blue) subcellular location. B–D, Enlargement of the inset region shown in A. B, WAVE-1 immunostaining; C, Texas Red–phalloidin staining of F-actin; D, PSD-95 immunostaining. Fluorescence image of a section of dendrite showing the subcellular location of WAVE-1 GFP (E) and GFP control (F) in 21 d in vitro cultured wild-type hippocampal neurons. WAVE-1–GFP is found primarily in spine heads and to a lesser extent in the shaft and dendrite, whereas soluble GFP is more evenly distributed in all of the dendritic structures. G–K, Postsynaptic density enrichment from rat brain extracts. Immunoblot detection of WAVE-1 (G), Arp3 (H), ArpC2 (I), PSD-95 (J), and SNAP-25 (K) in extracts and detergent-soluble PSD fractions. WAVE-1, the Arp2/3 complex subunits Arp3 and ArpC2, and PSD-95 are present within the core PSD (sarcosyl) fraction. The presynaptic protein SNAP-25 is present in the synaptic membrane fraction (Syn. mem.). L–O, Golgi-impregnated hippocampal sections show dendritic spines in neurons from wild-type (L) and WAVE-1 (M) null mice. Quantification of spine density (spines/100 μm) in dendritic segments from the hippocampus (N) (area CA1; n = 26; **p = 0.0026 using two-tailed unpaired t test) and cortex (O) (layer 1; n = 30; **p = 0.0027 using two-tailed unpaired t test).
Statistical analyses
Statistical analyses were done using InStat from GraphPad Software (San Diego, CA). Statistical analysis of behavioral data were done using SPSS (SPSS, Chicago, IL). Assumptions of variance and normality were examined in all tests.
Immunocytochemistry
DIV21 neurons were fixed in 4% paraformaldehyde and 4% sucrose in PBS, pH 7.4, for 15 min and permeabilized in 0.2% Triton X-100–PBS for 7 min. Antibodies used for immunofluorescence were affinity-purified V059 (1:250) (Westphal et al., 2000) or VO101 (1:200) (Soderling et al., 2002) for WAVE-1, ArpC2 (1:100; Upstate, Charlottesville, VA), Arp3 (1:100; Upstate), and postsynaptic density 95 (PSD-95) (1:100; Affinity BioReagents, Golden, CO). Tetramethylrhodamine isothiocyanate (TRITC)–phalloidin (1:200; Sigma, St. Louis, MO) was used to visualize filamentous actin (F-actin). For WAVE-1 and ArpC2 immunostaining, cells were subsequently incubated with biotin-conjugated secondary antibodies followed by fluorochrome-conjugated streptavidin (Jackson ImmunoResearch, West Grove, PA). To visualize PSD-95 immunostaining, neurons were incubated with fluorochrome-conjugated secondary antibodies after an overnight incubation in primary antibody. Stained cells were mounted in Prolong Antifade reagent (Invitrogen) and visualized on a Bio-Rad (Hercules, CA) MRC1024 laser-scanning confocal microscope. Representative images are from a single z plane.
Preparation of tissue and cell extracts
Soluble tissue extracts were prepared by dounce homogenization in lysis buffer [25 mm HEPES, 150 mm NaCl, 0.5% Triton X-100, 1 mm EDTA, and Complete protease cocktail (Roche Applied Science, Indianapolis, IN)] and centrifugation at 38,000 × g for 1 h at 4°C. Cell extracts were prepared by washing cells with PBS, followed by scraping adherent cells in 1 ml of lysis buffer, incubating on ice for 15 min, and then centrifuging at 15,000 × g for 30 min. Extracts were prepared from supernatants of each spin.
Transfection of HEK-293 cells
HEK-293 cells at 80% confluency were transfected using Lipofectamine 2000 (Invitrogen) according to the instructions of the manufacturer. Cells were harvested 24 h after transfection.
PSD fractionation and immunoblot detection
PSD fractions were prepared from frozen rat brains as described previously (Cho et al., 1992). Briefly, PSD fractions were separated by SDS-PAGE on a 12% gel and electrotransferred to nitrocellulose membranes (Schleicher & Schuell, Florham, NJ). Antibodies used were WAVE-1 (VO101), Arp3 (Upstate), ArpC2 (Upstate), PSD-95 (Upstate), and synaptosome-associated protein of 25 kDa (SNAP-25) (Clontech, Palo Alto, CA).
WAVE-1 immunoprecipitation and quantitative Western blot analysis
Brain extracts from either wild-type or mWAVE knock-in mice (five of each genotype) were immunoprecipitated overnight with anti-WAVE antibody VO101. Immunoblot detection was done using anti-WRP antibody VO112 or anti-WAVE-1 monoclonal VO84. Multiplexing by infrared-labeled secondary antibodies (Invitrogen) and quantitative detection and analysis was done using the Odyssey imaging system (Li-Cor Biosciences, Lincoln, NE).
Plasmids
For all experiments in neurons, a vector using the chicken β-actin promoter (pBetaActin) was used to drive expression (Kaech et al., 1997). Plasmids encoding WAVE-1 were generated by PCR amplification of DNA and ligation of the restriction digested insert at sites downstream of enhanced green fluorescent protein (GFP) (Clontech). The WAVE-1 444–559(R512K513/EE) actin binding mutant (Westphal et al., 2000) was subcloned into pBetaActin. Previous studies have shown these sequences of WAVE-1 bind the Arp2/3 complex and that coordinated actin binding is required for stimulation of actin polymerization and branching (Rohatgi et al., 1999; Hufner et al., 2001). Thus, sequences that bind Arp2/3, but not actin, act as functional inhibitors of Arp2/3-mediated actin reorganization (Strasser et al., 2004). The coding region of γ-actin was ligated into the pBetaActin vector downstream of enhance yellow fluorescent protein (YFP) (Clontech) and used as a marker for dendritic spines. cDNA constructs for individual members of the WAVE-1 complex were PCR cloned into the Gateway system (Invitrogen) from expressed sequence tags (American Type Culture Collection, Manassas, VA). All constructs were verified by sequencing.
Hippocampal slice production
Adult mice (8–16 weeks old) were anesthetized with pentobarbital (60 mg/kg, i.p.) and decapitated using procedures reviewed and approved by Institutional Animal Care and Use Committee at the Oregon Health and Science University. Brains were removed within 1 min of decapitation and immediately submerged in ice-cold, sucrose-modified artificial CSF (ACSF) for hippocampal dissection and slicing (in mm): 110 sucrose, 60 NaCl, 2.5 KCl, 28 NaHCO3, 1.25 NaH3PO4, 0.5 CaCl2, 7 MgCl2, 5 glucose, and 0.6 sodium ascorbate, pH 7.4 (at 4°C; presaturated by bubbling with 95% O2/5% CO2 at 21–22°C). Hippocampal slices (400 μm, transverse) were prepared using a vibratome and an agar backing (2%), and slices were recovered in warm ACSF (in mm): 125 NaCl, 2.5 KCl, 22.6 NaHCO3, 1.25 NaH3PO4, 2 CaCl2, 1 MgCl2, and 11.1 glucose, pH 7.4 (that was continuously saturated with 95% O2/5% CO2, for 30 min at 37°C). Slices from the dorsal and ventral thirds of the hippocampus were discarded. After recovery, the holding chamber was equilibrated at 21–22°C, and slices were held for 2–8 h before recording.
Electrophysiology
Submerged hippocampal slices were suspended in pairs on a nylon mesh in a small (350–400 μl) recording chamber and perfused with ACSF at a rate of 2.5–3 ml/min. The temperature in the recording chamber was raised and held at 32°C for the duration of the experiment. Synaptic responses were evoked by Schaffer collateral stimulation using a bipolar tungsten electrode (tip spacing, 140 μm; Frederick Haer Company, Bowdoinham, ME) and a 100 μs square wave test pulse (typically 30–40 μA) delivered at 60 s intervals. The stimulation intensity was adjusted to produce a basal field response of 1.2–1.4 mV. Field EPSPs (fEPSPs) were recorded with an ACSF-filled glass micropipettes (2–4 MΩ) placed in the stratum radiatum area of CA1 and connected via head stages to an A-M Systems (Carlsborg, WA) model 1800 amplifier. Signals were digitized at 100 kHz using Molecular Devices (Palo Alto, CA) Digidata 1200 series interface running Clampex 8.0, and the initial slope of the fEPSPs was analyzed with Clampfit 8.0 software. NMDAR fEPSPs were pharmacologically isolated at basal field response intensity by blocking AMPA/kainate receptors with 10 μm CNQX (Tocris Cookson, Ballwin, MO) in the presence of low Mg2+ (0.1 mm) in the recording chamber. The resultant NMDA receptors (NMDARs) fEPSPs were abolished in the presence of 50 μm AP-5 (Tocris Cookson). Early-phase long-term potentiation (LTP) was induced using theta bursts: four pulses per burst (100 Hz), five bursts per train (5 Hz), three trains (beginning 20 s apart). The late-phase LTP (L-LTP) was induced by four spaced applications of the above theta-burst protocol, at 5 min intervals. Long-term depression (LTD) was induced with low-frequency paired-pulse stimulation [900 paired pulses (50 ms interstimulus interval [ISI]) delivered at 1 Hz]. With the exception of the first data point after LTP/LTD induction, 3 min fEPSP averages are shown. The first data points after LTP/LTD induction were taken 20 s after the final stimulus. Slices from each genotype were balanced such that the average time in vitro was equal and the average age of animals were matched.
Results
WAVE-1 regulates neurite outgrowth and growth cone dynamics
The behavioral impairments detected in WAVE-1 null mice likely arise from the perturbation of signaling events that control cellular processes in the brain. Because Rac signaling regulates neurite outgrowth (Ng et al., 2002), we reasoned that interruption of WAVE-1 signaling might alter neuronal growth cone dynamics. In support of this hypothesis, WAVE-1 was detected within the growth cones of early stage (day 2) cultured hippocampal neurons (Fig. 1A). Counterstaining for actin (Fig. 1B) emphasized an accumulation of WAVE-1 signal at the leading edge of lamellipodia and at the tips of filopodia (Fig. 1A–C). This finding confirms previous transfection experiments showing that a pool of WAVE-1–GFP concentrates within the growth cones of a neuroblastoma cell line (Nozumi et al., 2003).
Figure 1.

WAVE-1 participates in growth cone dynamics and neurite outgrowth of cultured hippocampal neurons. A–C, WAVE-1 is found in the growth cones of neonatal mouse cultured hippocampal neurons on day 2 in vitro. A, WAVE-1 immunostaining; B, TRITC–phalloidin-stained F-actin; C, composite of A and B. Hippocampal neurons transfected with GFP from wild-type (D) and WAVE-1 (E) null mice. F, Neurite length (micrometers) was measured on day 5 in vitro, and the neurite outgrowth of wave+/+ (n = 94) and wave−/− (n = 93) neurons was averaged (***p < 0.0001 using two-tailed unpaired t test). Growth cones of wild-type (G) and WAVE-1 (H) null neurons were stained for F-actin with FITC–phalloidin. Insets in G and H are traces of the shape of each growth cone as revealed by fluorescence thresholding. I, Morphology assessment: roundness index was calculated for wave+/+ (n = 34) and wave−/− (n = 30) growth cone shape traces (*p = 0.039 using two-tailed unpaired t test). J, Phase-contrast images of wild-type (top) and WAVE-1 null (bottom) growth cones. Montage shows movement at 10 s intervals. K–N, Kymograph analysis of lamellipodial dynamics from wild-type and WAVE-1 null growth cones. K, Representative image showing three lines of captured pixels from the origin to the periphery of the growth cone. L, Kymograph of lines 1–3 in K showing lamellipodial extension and retraction events. Distance from the origin (y-axis) and time (x-axis) are labeled. The rate of extension and retraction of lamellipodia can be calculated from kymograph data. The extension velocity (M) (wave+/+, n = 118; wave−/−, n = 129) and retraction velocity (N) (wave+/+, n = 106; wave−/−, n = 121) from wild-type and WAVE-1 null growth cones (***p < 0.001 using two-tailed unpaired t test). Data (F, I, M, N) were collected from three independent culture preparations of neurons from each genotype. All data are presented as mean ± SEM.
To test whether WAVE-1 regulates neurite extension, hippocampal neurons from E18 embryos of WAVE-1 null (wave−/−) and wild-type (wave+/+) mice were transfected with GFP. Neurite outgrowth (the sum of axonal and dendrite length) was measured after 5 d in culture, a stage in which the majority of outgrowth is axonal (Fig. 1D,E). The extent of neurite outgrowth was 60.1% less (n = 92) in WAVE-1 knock-out neurons when compared with wild type (Fig. 1F). Analysis of fixed neurons stained for F-actin revealed that wave−/− growth cones appeared more “spiky” and elongated than wild-type growth cones (Fig. 1G,H). These morphological differences were documented using a shape analysis algorithm (Kim and Wu, 1991) in which a perfect circle gives a roundness index of one. Increasingly irregular shapes are scored with higher roundness indices when analyzed with this algorithm (Fig. 1G,H, insets). Accordingly, wild-type growth cones had an average roundness index score of 4.3 ± 0.31 (n = 34), whereas wave−/− growth cones exhibited an average roundness index of 5.3 ± 0.38 (n = 30) (Fig. 1I).
Live-cell imaging of cultured hippocampal neurons provided additional information about growth cone dynamics. In these experiments, the leading edge of the knock-out growth cones rarely extended to the tips of the filopodia, suggesting defects in the lamellipodia (Fig. 1J) (supplemental Movie S1, available at www.jneurosci.org as supplemental material). This was confirmed by kymograph analysis in which lamellipodial movement was measured by extracting a line of pixels along the axis of motility (Fig. 1K, lines 1–3). When lines of pixels from successive frames of a time-lapse sequence are pasted side by side, it generates a record of the dynamic nature of lamellipodial movement (Hinz et al., 1999). Using this approach, we were able to show that wave−/− lamellipodia extended at a rate of 6.85 ± 0.13 μm/min (n = 118) (Fig. 1M). This is significantly faster than the rate of wave+/+ lamellipodial extension (5.48 ± 0.14 μm/min; n = 129) (Fig. 1M). Surprisingly, the retraction velocity of lamellipodia was similar in both genotypes (Fig. 1N). Collectively, all of the data in Figure 1 suggest that the loss of WAVE-1 affects both lamellipodial dynamics and the pattern of growth cone motility in a manner that retards neurite extension in cultured neurons.
WAVE-1 plays a role in the development of dendritic spines
Subsequent to neurite extension is the formation of excitatory synaptic connections, which are dependent on the development of actin-rich dendritic spines (Carlisle and Kennedy, 2005). Immunostaining of WAVE-1 in late-stage (day 21) hippocampal neurons (Fig. 2A,B) and counterstaining with F-actin and the postsynaptic marker PSD-95 (Fig. 2B–D) demonstrated the presence and enrichment of this anchoring protein in dendritic spines. Additional experiments using GFP-tagged WAVE-1 confirmed the concentrated localization and targeting of WAVE-1 to spines (Fig. 2E,F). WAVE-1 did not fill the spine but was localized to subregions within the spine head (Fig. 2E). Additional coexpression experiments were performed with WAVE-1 GFP and tomato fluorescent protein as a marker for dendritic morphology. These studies confirmed that dendritic morphology was normal and that the scaffolding protein was localized to specific regions of the spine head (S. H. Soderling and J. D. Scott, unpublished observation). Parallel immunostaining experiments also detected the ArpC2 subunit of the Arp2/3 complex within dendritic spines (data not shown). Finally, these findings were substantiated with biochemical evidence when each protein was identified in postsynaptic density fractions isolated from rat brain (Fig. 2G–K). Thus, WAVE-1 is targeted to the dendritic spines of mature hippocampal neurons.
The concentration of WAVE-1 in spines suggested that it might regulate spine development or function in vivo. Tissue sections from both the CA1 region of the hippocampus and layer 1 of the cortex of 10-week-old mice were stained using Golgi impregnation. Quantitative image analysis of dendrites revealed a reduction in spine density in the WAVE-1 null samples (hippocampus: wave+/+, 104 ± 5 spines/100 μm; wave−/−, 83 ± 4 spines/100 μm; p < 0.01; cortex: wave+/+, 99 ± 4.5 spines/100 μm; wave−/−, 79.8 ± 4; p < 0.01 spines/100 μm) (Fig. 2L–O).
Loss of WAVE-1 alters synaptic plasticity
Recent evidence suggests that actin remodeling within dendritic spines influences synaptic transmission (Fukazawa et al., 2003; Okamoto et al., 2004). Electrophysiological analysis of hippocampal slices (area CA1) from WAVE-1 null mice detected differences in synaptic transmission. First, the loss of WAVE-1 resulted in a 29% reduction in the maximal fEPSPs (p = 0.0014 at highest stimulus intensity using two-tailed unpaired t test) (Fig. 3A). Second, the early phase of postsynaptic LTP was increased in the WAVE-1 knock-out mice (p < 0.0001 using unpaired two-tailed t test for responses from 0 to 60 min) (Fig. 3B). In contrast, these mice exhibited reduced LTD (p = 0.001 using unpaired two-tailed t test for responses 0–60 min) (Fig. 3C). The increase in LTP magnitude was not restricted to the early-phase LTP. In mice lacking WAVE-1, L-LTP, induced by repeated theta bursts, resulted in a modest increase in potentiation at 150–180 min (p < 0.0001 using unpaired two-tailed t test for responses 150–180 min) (Fig. 3D). NMDAR activity responses were quantified for each genotype because this ion channel contributes to the induction of both LTP and LTD. Interestingly, the NMDAR to AMPA receptor (AMPAR) fEPSP ratio was significantly higher in the absence of WAVE-1 (p = 0.02 by unpaired two-tailed t test) (Fig. 3E). In summary, these data show that loss of WAVE-1 impacts molecular mechanisms of synaptic plasticity that may underlie some of the behavioral abnormalities observed previously in the wave−/− mice (Soderling et al., 2003). However, it was unclear which components of the WAVE-1 signaling complex contributed to these aberrant phenotypes. Certainly, WRP could be a contributing factor because this GAP protein likely promotes tight regulation of actin-remodeling events by directly anchoring to WAVE-1. In addition, haploinsufficiency of WRP has been linked to a form of human mental retardation called 3p-syndrome (Endris et al., 2002).
Figure 3.
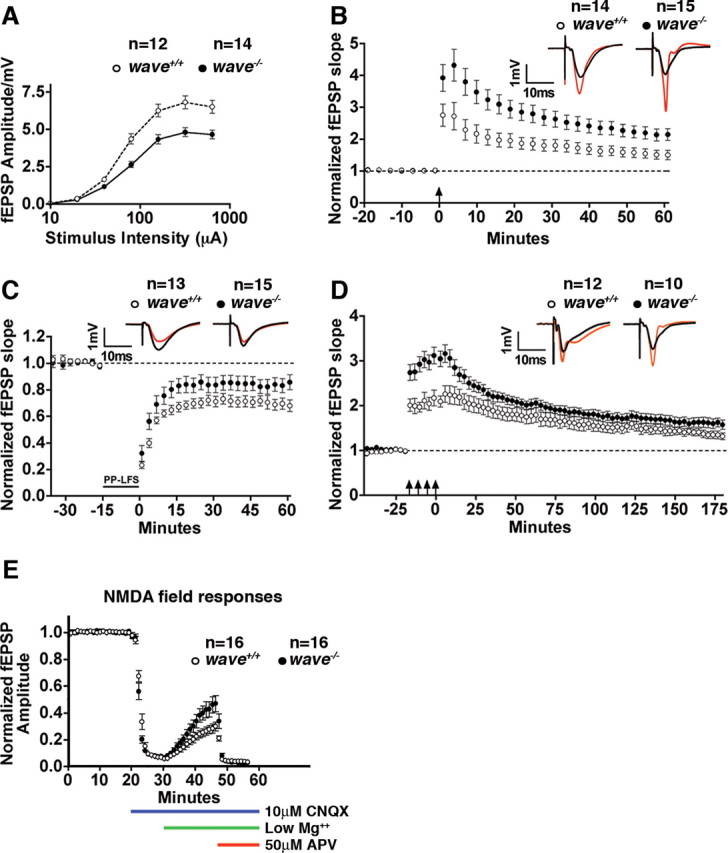
WAVE-1 regulates synaptic plasticity. Electrophysiological analysis of hippocampal slices from wild type (wave+/+) and WAVE-1 null (wave−/−) mice. A, Graph depicting the synaptic input–output relationship (semi-log scale). Data represent mean ± SEM; n values are shown. B, Graph comparing LTP induced by three trains of theta-burst stimulation [arrow; 4 pulses/burst (100 Hz), 5 bursts/train (5 Hz), 3 trains (20 s apart)]. Representative traces before (black) and 60 min after (red) induction of LTP. Data represent mean ± SEM; n values are shown. C, Graph comparing LTD induced by low-frequency paired-pulse stimulation [900 paired pulses (50 ms ISI) delivered at 1 Hz]. Representative traces before (black) and 60 min after (red) induction of LTD. Data represent mean ± SEM; n values are shown. D, Graph comparing L-LTP induced by four epochs of theta-burst trains [arrows; 4 pulses/burst (100Hz), 5 bursts/train (5 Hz), 3 trains (20 s apart), 4 epochs (at 5 min intervals)]. Representative traces before (black) and 180 min after (red) induction of LTP. Data represent mean ± SEM; n values are shown. E, Graph comparing normalized NMDAR field responses induced by Schaffer collateral stimulation at basal intensity in the presence of CNQX/low Mg2+ (see Materials and Methods). Data represent mean ± SEM; n values are shown.
Generation of mutant WAVE-1 mice (wavem/m)
To ascertain whether perturbation of the WAVE–WRP interaction contributes to the pathophysiology of the WAVE-1 null animals, knock-in mice (wavem/m) with reduced WRP binding properties were generated. We have shown previously that the SH3 domain of WRP binds to proline-rich sequences between amino acids 322–332 and 425–431 of WAVE-1 (Soderling et al., 2003). A deleted form of the scaffolding protein (called mWAVE-1) that lacked both of these sites was engineered and expressed in HEK-293 cells (Fig. 4A, bottom, lane 3). This mutant scaffolding protein exhibited a reduced ability to bind WRP as assessed by immunoblot analysis of WAVE immunoprecipitates (Fig. 4A, top, lanes 2 and 3). In contrast, additional immunoblot analysis confirmed that other WAVE binding partners, including HSPC300, Abl interacting protein 1 (Abi-1), Abl, PKA RII, actin, and the Arp2/3 complex, retained their full ability to bind to mWAVE-1 (supplemental Fig. S2, available at www.jneurosci.org as supplemental material). A trace of WRP was consistently coimmunoprecipitated with mWAVE-1 (Fig. 4A, top, lane 3). Thus, we concluded that WRP might have a secondary site of interaction through its association with other members of the signaling complex. Additional coimmunoprecipitation experiments identified Abi-1 as a likely WRP binding partner (supplemental Fig. S3, available at www.jneurosci.org as supplemental material). In summary, the above experiments demonstrate that mWAVE-1 forms a functional signaling complex, yet with substantially reduced levels of WRP.
Figure 4.

wavem/m mice lack WRP binding sites and exhibit reduced WRP association in vivo. A, Western blot analysis of WRP in WAVE-1 immunoprecipitations (IP) from HEK-293 extracts expressing WRP alone, WRP and WAVE-1, or WRP and WAVE-1 lacking amino acids 322–332 and 425–431 (mWAVE). Immunoblots (IB) detecting WRP in WAVE immunoprecipitations (top), WRP in total extracts (middle), and WAVE in total extracts (bottom). B, Schematic of targeting construct used to introduce mWAVE mutations into the WAVE-1 locus. Relative positions of exons are indicated below. Light blue box indicates genomic region used in targeting construct, and white-boxed region represents flanking genomic sequence outside of the targeting construct. Gray box between exon 6 and exon 7 indicates insertion of neomycin resistance, and red box represents exon 7 in which the mutations were introduced. Arrows indicate position of primers used to screen embryonic stem cells for homologous recombination. Sequence above exon 7 represents the sequences deleted. C, D, Chromatogram of sequence data from targeted embryonic stem cells demonstrating the sequence deletions from homologous recombination. Amino acid sequence and residue number are indicated above the nucleotide sequence. E, Agarose gel of embryonic stem cell PCR screen for homologous recombination. Two positive lines, ES #143 and ES #129, are indicated along with a negative control (H2O). F, Wild-type (wave+/+) and knock-in (wavem/m) mice at 14 weeks of age. G, WAVE-1 immunoprecipitations from brain extracts of wild-type versus knock-in mice. Top is an immunoblot of coprecipitated WRP. Bottom is an immunoblot of WAVE-1. H, Quantitation of the amount of WRP coprecipitated with either WAVE or mWAVE from wild-type or knock-in brain extracts. Ratio is the amount of WRP divided by the amount of WAVE present in each immunoprecipitation (n = 5; *p = 0.036 using one-tailed unpaired t test).
A targeting vector that engineered these mutations (deletion of residues 322–332 and 425–431) into exon 7 of the WAVE-1 gene was constructed using the bacterial recombineering method (Fig. 4B) (Liu et al., 2003). ES cells expressing this targeting construct were selected, and PCR screening was used to confirm homologous recombination. Exon 7 from the targeted allele was PCR cloned and sequenced to verify that both mutations were present (Fig. 4C,D). Embryonic stem cell lines positive for these mutations in exon 7 (Fig. 4E) were used to generate mice homozygous for the mutation (wavem/m). The resultant wavem/m mice appeared healthy and were indistinguishable from wild-type (wave+/+) littermates (Fig. 4F). Immunoprecipitation with WAVE-1 antibody showed that the expression levels of the mutant and wild-type proteins were similar in brain extracts (Fig. 4G, bottom). However, the amount of WRP associated with mWAVE-1 was reduced 45.75% (n = 5) when compared with the amount coprecipitating with wild-type WAVE-1 (Fig. 4G, top, H). Consequently, the wavem/m mice provided a model system to test the functional consequences of reduced WRP interaction with the WAVE-1 signaling complex.
Characterization of mWAVE-1 mice
Coronal brain sections from wavem/m mice appeared to be normal with gross structures that were well formed (data not shown). However, given the impairments in spine development observed in the WAVE-1 null mice, we embarked on a morphological analysis of wavem/m neurons. Using Golgi impregnation, we measured spine density in tissue sections from the hippocampus (CA1) and cortex (layer 1) of 10-week-old wavem/m and wave+/+ mice (Fig. 5A,B). The knock-in mice had a significant reduction in spine density in sections from both of these brain regions (hippocampus: wave+/+, 103 ± 5.9 spines/100 μm; wavem/m, 88 ± 4 spines/100 μm; p < 0.05, cortex: wave+/+, 91 ± 4.7 spines/100 μm; wavem/m, 68.4 ± 5 spines/100 μm; p < 0.01) (Fig. 5C,D). Thus, WRP anchoring contributes to WAVE-1-mediated control of neuronal spinogenesis. Based on our results, our working hypothesis was that disruption of WAVE-1 signaling would interrupt the transduction of signals to Arp2/3 in spines. Accordingly, expression of a dominant interfering mutant (WAVE-1 444–559, R512K513/EE) that competes for activation of Arp2/3 (Westphal et al., 2000; Strasser et al., 2004) reduced spine density in cultured neurons by 29% (control, 44.60 ± 3 spines/100 μm; WAVE-1 444–559EE, 32.18 ± 3 spines/100 μm; p < 0.01) (Fig. 5E–G). Because the shape of spines is also dependent on actin remodeling, we also examined their morphology in these experiments. Interestingly, dendritic spines in WAVE-1 444–559EE-transfected neurons also adopted a more filopodial morphology (1.5-fold reduction in head/filopodial ratio; control, 2.52 ± 0.3; WAVE-1 444–559EE, 1.72 ± 0.2; p < 0.01) (Fig. 5H). These experiments imply that WAVE-1 signaling to the actin cytoskeleton regulates aspects of both neuronal spinogenesis and spine morphology.
A subset of the electrophysiological changes in the CA1 region of the hippocampus that we measured in the WAVE-1 null (wave−/−) mice was also detected in the mWAVE mutant mice. In the wavem/m mice, the maximal fEPSP was also reduced, particularly at higher stimulus intensities [p = 0.0184 at highest stimulus intensity (640 mA) using a two-tailed t test] (Fig. 6A). However, early-phase LTP and LTD in mWAVE-1 knock-in mice were normal (Fig. 6B,C). Nonetheless, the wavem/m mice exhibited increased L-LTP in a manner similar to the WAVE-1 null mice (p < 0.0001 using unpaired two-tailed t test for responses 150–180 min) (Fig. 6D). Paired-pulse facilitation was normal in both animal models, which is consistent with the postsynaptic localization of WAVE-1 and suggests that neurotransmitter release probability is not regulated by the signaling scaffold (supplemental Fig. S4, available at www.jneurosci.org as supplemental material). Although WAVE-1 knock-out and mWAVE-1 knock-in mice both exhibit increased LTP, they were not electrophysiologically equivalent. Early-phase LTP and L-LTP were both increased in WAVE-1 null animals, whereas the mWAVE-1 knock-in mice were limited to a specific enhancement of L-LTP. These differences led us to examine whether there were behavioral differences in these two mouse models consistent with these findings.
Figure 6.

Enhanced L-LTP in the wavem/m mice. A–D, Electrophysiological analysis of hippocampal slices from wild-type and mWAVE knock-in mice. A, Graph comparing the synaptic input–output relationship over a range of stimulus intensity (semi-log scale). Data represent mean ± SEM; n values are indicated. B, Graph comparing LTP induced by three trains of theta-burst stimulation [arrow; 4 pulses/burst (100 Hz), 5 bursts/train (5 Hz), 3 trains (20 s apart)]. Representative traces before (black) and 60 min after (red) induction of LTP. Data represent mean ± SEM; n values are indicated. C, Graph comparing LTD induced by low-frequency paired-pulse stimulation [900 paired pulses (50 ms ISI) delivered at 1 Hz]. Representative traces before (black) and 60 min after (red) induction of LTD. Data represent mean ± SEM; n values are indicated. D, Graph comparing L-LTP induced by four epochs of theta-burst trains [arrows; 4 pulses/burst (100Hz), 5 bursts/train (5 Hz), 4 trains (5 min apart)]. Representative traces before (black) and 180 min after (red) induction of LTP. Data represent mean ± SEM; n values are indicated.
wavem/m mice exhibit impairment in memory retention
Behavioral tests were conducted on wavem/m, wavem/+, and wave+/+ mice as described previously (Soderling et al., 2003). All three genotypes tested comparably for measures of sensorimotor function and anxiety (data not shown). However, wavem/m mice were impaired in their memory retention as assessed by the Morris water maze to evaluate hippocampal-dependent spatial learning and memory (Morris et al., 1982). Initially, mice were trained for four sessions (two sessions a day) to swim to a visible platform (cued training). During sessions 5–10, the latency of mice to swim to a submerged hidden platform was measured (acquisition). Mice from each genotype performed equally well in the cued and the acquisition training (Fig. 7A) and had no differences in swim speed (data not shown). Two hours after sessions 6, 8, and 10, the hidden platform was removed and spatial-memory retention (probe trials) was assessed. Wild-type and heterozygous mice preferentially searched in the target quadrant in all probe trials (after sessions 6, 8, and 10) (Fig. 7B–D). In contrast, wavem/m mice failed to spend significantly more time searching in the target versus nontarget quadrants during sessions 6 and 8 of the probe trials (Fig. 7B,C, Day 3 and Day 4 Probe). However, after 1 additional day of training (after 10 sessions), the wavem/m mice were able to distinguish between the target and nontarget quadrants (Fig. 7D). Thus, mice expressing mWAVE have impaired memory retention but with additional training are able to overcome this impairment. An additional probe trial performed 14 d after the last day of hidden platform training assessed the stability of memory retention in these mice. The wavem/m mice lost spatial memory in contrast to the two other genotypes, which retained the ability to identify the target quadrant versus all other quadrants (Fig. 7E,F). These data show that the wavem/m mice not only require more training to retain spatial memory but, once this memory is formed, it is also less stable. The specific impairment of spatial memory retention in the wavem/m mice is consistent with the normal hippocampal early-phase LTP and altered L-LTP observed in these mice.
Figure 7.

Disruption of WRP anchoring to WAVE affects memory retention. A–F, Analysis of spatial learning and memory performance of wild-type (wave+/+), heterozygous (wave+/m), and knock-in (wavem/m) mice in the Morris water maze (n = 10 each genotype; mean ± SEM value is shown). A, Time to swim to the platform (latency) was measured for wild-type (squares), heterozygous (diamonds), and knock-in (circles) mice. The mice were tested in two daily sessions of three trials each. Sessions 1–4 are learning trials for the visible platform, and sessions 5–10 are learning trials for the hidden (submerged) platform. No significant differences were observed in the learning curves. B–F, Memory retention after learning trials was measured in probe trials (platform removed). The percentage of time spent searching in the target quadrant (quadrant containing platform during sessions 5–10) versus nontarget quadrants was measured. **p < 0.01 target versus any other quadrant using one-way ANOVA. Probe trials were conducted 2 h after session 6 on day 3 (B) (wave+/+, p = 0.0012; wave+/m, p = 0.0035), session 8 on day 4 (C) (wave+/+, p < 0.0001; wave+/m, p < 0.0004), and session 10 on day 5 (D) (wave+/+, p < 0.0001; wave+/m, p = 0.0026; wavem/m, p < 0.0001). E, F, A delayed probe trial was conducted 14 d after session 10 to measure long-term memory retention. E, Representative swim-trace patterns for wild-type (wave+/+, left) and knock-in (wavem/m, right) mice in the delayed probe trial. Start position is marked by a black square, and a circle marks target location. F, Quantification of percentage time spent searching in each quadrant during the delayed probe trial (wave+/+, ***p < 0.0001; wave+/m, **p = 0.005). G, Nonspatial learning and memory was measured by novel-object recognition (n = 10 each genotype; mean ± SEM value is shown). Graph shows percentage time spent exploring the novel object for wild-type (wave+/+), heterozygous (wave+/m), and knock-in (wavem/m) mice. *p = 0.036 using one-way ANOVA; Tukey–Kramer, p < 0.05 wild-type versus knock-in.
This memory impairment was not restricted to spatial-based tests. Cognitive impairments in wavem/m mice were also observed in novel-object recognition tests to evaluate hippocampal-independent nonspatial memory. For 3 consecutive days, mice were habituated to an enclosure, and, on the fourth day, they were subjected to three consecutive familiarization trials with three individual objects. After the familiarization trials, the mice were tested for novelty location, in which one familiar object was moved to a new location and novelty recognition in which one familiar object was replaced by a novel object. No differences were observed in the novel location trials (data not shown). wavem/m mice did, however, spend significantly less time exploring the novel object when compared with their wild-type littermates (Fig. 7G). Together, the above results suggest that WAVE-1–WRP interaction is indeed necessary for aspects of both spatial and nonspatial memory.
Discussion
Spatiotemporal control of small-molecular-weight GTPase action involves two classes of effector proteins: guanine nucleotide exchange factors (GEFs) that stimulate their activity and GAPs that suppress G-protein signaling. Biochemical and genomic analyses have identified a plethora of GEF and GAP proteins that service the 20 or so members of the Rho GTPase family (Moon and Zheng, 2003). For example, 70 human Rho GAP proteins terminate Rho GTPase signaling events in a variety of cellular contexts. How specificity is achieved between individual GAPs and GTPases is still unclear. We have shown previously that WRP functions as a WAVE-1-associated Rac GAP that terminates Rac signaling in neurons (Soderling et al., 2002). In this report, we demonstrate that a reduction in the amount of WRP interacting with WAVE-1 affects the dendritic morphology of neurons, their synaptic transmission, and promotes subtle but measurable behavioral changes in the mutant mice. Our biochemical characterization of the wavem/m mice indicates that direct interaction with WAVE-1 accounts for ∼50% of endogenous WRP binding to the complex. Presumably, the remainder of the WAVE-associated WRP is retained via interactions with other WAVE binding partners. For example, a secondary means of WRP recruitment may be through its interaction with the Abl-interacting protein Abi-1. The same may be true for other components of the WAVE complex such as the Abl tyrosine kinase, which binds directly to WAVE-1 through its SH3 domain and can also be indirectly retained through its binding to the Abi proteins (Dai and Pendergast, 1995; Shi et al., 1995; Westphal et al., 2000). Thus, proteins within the WAVE-1 signaling complex use multiple sites of contact, and, at this time, we do not fully understand the role other protein–protein interactions play in recruiting WRP.
WRP is a candidate mental retardation gene that was identified by positional cloning as the only gene disrupted in an individual with a balanced de novo translocation of chromosome t(X;3)(p11.2;p25) (Endris et al., 2002). This patient exhibited the severe mental retardation and locomotor impairments that are associated with 3p-syndrome. Although other genes have also been implicated (Angeloni et al., 1999; Sotgia et al., 1999), 11 patients with 3p-syndrome mental retardation exhibited loss of heterozygosity for WRP. This is supportive of the hypothesis that reduced levels of this Rac-selective GAP protein is causally linked to impaired cognitive performance.
The wavem/m mice were engineered to have reduced levels of WRP associated with WAVE-1. This not only allowed us to focus on the role of a specific protein–protein interaction within the WAVE signaling complex but also provided us with a mouse model in which the reduced subcellular targeting of WRP might mimic a haploinsufficiency of the GAP protein. Behavioral analyses of these mice support this notion. Impairment in hippocampal-dependent memory retention was particularly evident in the probe trial performance of the Morris water maze test (Fig. 7). Cognitive impairment in these knock-in animals could also be seen in their novel-object recognition performance. In contrast, other behaviors such as sensorimotor function were no different from wild-type mice and thus did not contribute to these memory impairments. These impairments were analogous to a subset of the cognitive defects observed previously in the WAVE-1 knock-out animals. Thus, recruitment of WRP to the WAVE-1 complex may be required to regulate certain aspects of memory retention. The additional cognitive defects observed in the WAVE-1 knock-outs may be attributed to targeting of other WAVE-1-associated proteins. Interestingly, one common mechanism that may underlie some forms of mental retardation is the alteration of Rho GTPase signaling (Ramakers, 2002; Newey et al., 2005). This is supported by studies that have identified multiple Rho GTPase signaling genes in both syndromic and nonsyndromic forms of mental retardation. Examples include the Rho GAP oligoprhenin-1, the Rac GEF ARGEF6/cool-2/αpix, and the Rac-activated kinase PAK3 (Allen et al., 1998; Billuart et al., 1998; Kutsche et al., 2000).
Analyses of our genetically modified mice support the notion that WAVE-1 complexes play a role in the development or maintenance of neuronal connectivity. Live-cell imaging approaches demonstrate that the loss of WAVE-1 perturbs growth cone dynamics and alters neurite outgrowth. Paradoxically, an absence of WAVE-1 increases the extension velocity of the lamellipodia, yet the lamellipodia rarely extends to the tips of the filopodia. One potential explanation is that the elongated or spiky morphology of WAVE-1 null growth cones is symptomatic of less stable lamellipodia. This finding is compatible with reports that elevated membrane levels of the mammalian enabled (Mena)/vasodilator-stimulated phosphoprotein (Vasp) proteins enhance the extension velocity of the lamellipodia yet reduce cell migration (Bear et al., 2000). Because Mena and Vasp are potential substrates for the WAVE-1-associated Abl tyrosine kinase and PKA, it is possible that local phosphorylation events could contribute to dynamic changes in the neuronal cytoskeleton (Loureiro et al., 2002). Consequently, one could imagine that actin with less branching may be unable to sustain the integrity of the lamellipodia for long enough to permit normal neurite outgrowth. Other work suggests that WAVE-1 is transported within neurons in a kinesin-1/collapsin response mediator protein 2 (CRMP-2)-dependent manner (Kawano et al., 2005). RNA interference (RNAi) knockdown of WAVE-1 inhibits CRMP-2-stimulated axonal outgrowth and multiple axon formation. This is consistent with our evidence that WAVE-1 regulates growth cone morphology and neurite outgrowth but is at odds with evidence that inhibition of Arp2/3-stimulated neurite outgrowth (Strasser et al., 2004). Analogous RNAi studies in Drosophila show that loss of dWAVE inhibits lamellipodia as well as filopodial formation (Biyasheva et al., 2004). How these different findings fit together is not yet clear. One possibility is that distinct WAVE-1 complexes regulate growth cone morphology and neurite outgrowth. In some cases, these cytoskeletal signaling events may involve mechanisms that are independent of Arp2/3.
Actin reorganization within dendritic spines is a dynamic process. For example, fluorescence recovery after photobleaching experiments have calculated that ∼85% of the actin within dendritic spines turns over every 44 s and that actin dynamics can be regulated by synaptic activity (Star et al., 2002). Therefore, molecules that control actin dynamics have the capacity to profoundly influence spine development as well as synaptic transmission. Our quantitative analyses of Golgi-impregnated tissues reveal a reduction in spine density in neurons from WAVE-1 knock-out and mWAVE knock-in animals. These morphological changes were observed in both the CA1 region of the hippocampus and the outer layer of the cortex. Spinogenesis occurs not only during development but also in adulthood in response to plasticity-inducing stimuli (Moser et al., 1994). Transfection of dominant-negative WAVE-1 444–559, R512K513/EE impairs spine development in vitro, suggesting that this pathway may play a role during development. We also observed an effect on spine morphology in these experiments, supporting the idea that WAVE-1 signaling to Arp2/3 regulates spine head shape. Interestingly, Abi-2 knock-out mice also show reductions in spine density as well deficits in learning and memory (Grove et al., 2004). Because the Abi proteins are ligands for WAVE-1, this suggests that the coordinated binding between these proteins may be critical for spine development. Our results showing that WRP and WAVE-1 coordinately regulate spinogenesis are consistent with recent observations that Cdk5 (cyclin-dependent kinase 5) and PKA signaling also regulate spine morphology via WAVE-1 (Kim et al., 2006).
WAVE-1 null and knock-in mice also show differences in synaptic transmission and plasticity. In both cases, we measured reduced maximal fEPSP in neurons from genetically modified animals when compared with wild-type littermates. This is consistent with the reduced spine density we observe in both models. Furthermore, effective memory storage within a neural network is thought to depend on the bidirectional modulation of synaptic strength (Morris and Willshaw, 1989; Zeng et al., 2001). Our electrophysiological recordings from hippocampal slices show that WAVE-1 knock-out mice exhibit increased LTP and reduced LTD. These deficits in bidirectional synaptic plasticity are in good agreement with our previous characterization of a WAVE-1 null phenotype showing that these animals exhibit impaired behavioral learning and task-associated memory.
Interestingly, WAVE-1 null mice show elevated NMDAR responses relative to AMPAR responses. This apparent increase in the NMDA response implies that there may be an altered composition of synaptic glutamate receptors in WAVE-1 null mice. Indeed, this relative enhancement of NMDAR responsiveness is consistent with a bias toward greater LTP at the expense of LTD. mWAVE-1 knock-in mice are normal for early LTP and LTD but do have abnormal L-LTP, which is consistent with our behavioral data showing a specific impairment in memory retention. This correlation suggests the two are causally linked and strongly argue that WAVE-1 signaling plays a previously unsuspected role in regulating synaptic transmission and plasticity. However, we cannot rule out that additional synaptic abnormalities may exist these animals. Such aberrant signaling events could include reduced GABAergic tone, changes in glutamate receptor attachment to the actin cytoskeleton, ion channel trafficking, or alterations in the basal synaptic distribution. Future experiments will be necessary to test these hypotheses.
In summary, genetic and phenotypic analysis of WAVE-1 knock-out and mWAVE-1 knock-in mice reveal new evidence for the WAVE-1 signaling pathway in regulating neuronal connectivity. Alteration of this pathway impacts the expression of normal behaviors, including learning and memory. We also provide evidence that WAVE-1 signaling regulates growth cone dynamics, neurite outgrowth, and spinogenesis. Furthermore, the WAVE-1 pathway also plays a previously unappreciated role in regulating synaptic plasticity. These results imply that neuronal connectivity, glutamate receptor composition, and synaptic strength are encoded through dynamic actin remodeling that is facilitated by WAVE-1 signaling complexes.
Footnotes
This study was supported by National Institutes of Health Grants DK44239 (J.D.S.), NS17112 (G.B.), AG20904 (J.R.), and NS27037 (T. R. Soderling). Support was also provided by Emergency Medical Foundation Grant AG-NS-0201 (J.R.).
References
- Allen KM, Gleeson JG, Bagrodia S, Partington MW, MacMillan JC, Cerione RA, Mulley JC, Walsh CA. PAK3 mutation in nonsyndromic X-linked mental retardation. Nat Genet. 1998;20:25–30. doi: 10.1038/1675. [DOI] [PubMed] [Google Scholar]
- Angeloni D, Lindor NM, Pack S, Latif F, Wei MH, Lerman MI. CALL gene is haploinsufficient in a 3p- syndrome patient. Am J Med Genet. 1999;86:482–485. doi: 10.1002/(sici)1096-8628(19991029)86:5<482::aid-ajmg15>3.0.co;2-l. [DOI] [PubMed] [Google Scholar]
- Banker GA. Culturing nerve cells. Ed 2. Cambridge, MA: MIT; 1998. [Google Scholar]
- Bear JE, Rawls JF, Saxe CL., III SCAR, a WASP-related protein, isolated as a suppressor of receptor defects in late Dictyostelium development. J Cell Biol. 1998;142:1325–1335. doi: 10.1083/jcb.142.5.1325. [DOI] [PMC free article] [PubMed] [Google Scholar]
- Bear JE, Loureiro JJ, Libova I, Fassler R, Wehland J, Gertler FB. Negative regulation of fibroblast motility by Ena/VASP proteins Cell. 2000;101:717–728. doi: 10.1016/s0092-8674(00)80884-3. [DOI] [PubMed] [Google Scholar]
- Benice TS, Rizk A, Kohama S, Pfankuch T, Raber J. Sex-differences in age-related cognitive decline in C57BL/6J mice associated with increased brain microtubule-associated protein 2 and synaptophysin immunoreactivity. Neuroscience. 2006;137:413–423. doi: 10.1016/j.neuroscience.2005.08.029. [DOI] [PubMed] [Google Scholar]
- Billuart P, Bienvenu T, Ronce N, des Portes V, Vinet MC, Zemni R, Carrie A, Beldjord C, Kahn A, Moraine C, Chelly J. Oligophrenin 1 encodes a rho-GAP protein involved in X-linked mental retardation. Pathol Biol (Paris) 1998;46:678. [PubMed] [Google Scholar]
- Biyasheva A, Svitkina T, Kunda P, Baum B, Borisy G. Cascade pathway of filopodia formation downstream of SCAR. J Cell Sci. 2004;117:837–848. doi: 10.1242/jcs.00921. [DOI] [PubMed] [Google Scholar]
- Carlisle HJ, Kennedy MB. Spine architecture and synaptic plasticity. Trends Neurosci. 2005;28:182–187. doi: 10.1016/j.tins.2005.01.008. [DOI] [PubMed] [Google Scholar]
- Cho KO, Hunt CA, Kennedy MB. The rat brain postsynaptic density fraction contains a homolog of the Drosophila discs-large tumor suppressor protein. Neuron. 1992;9:929–942. doi: 10.1016/0896-6273(92)90245-9. [DOI] [PubMed] [Google Scholar]
- Dai Z, Pendergast AM. Abi-2, a novel SH3-containing protein interacts with the c-Abl tyrosine kinase and modulates c-Abl transforming activity. Genes Dev. 1995;9:2569–2582. doi: 10.1101/gad.9.21.2569. [DOI] [PubMed] [Google Scholar]
- Eden S, Rohatgi R, Podtelejnikov AV, Mann M, Kirschner MW. Mechanism of regulation of WAVE1-induced actin nucleation by Rac1 and Nck. Nature. 2002;418:790–793. doi: 10.1038/nature00859. [DOI] [PubMed] [Google Scholar]
- Endris V, Wogatzky B, Leimer U, Bartsch D, Zatyka M, Latif F, Maher ER, Tariverdian G, Kirsch S, Karch D, Rappold GA. The novel Rho-GTPase activating gene MEGAP/ srGAP3 has a putative role in severe mental retardation. Proc Natl Acad Sci USA. 2002;99:11754–11759. doi: 10.1073/pnas.162241099. [DOI] [PMC free article] [PubMed] [Google Scholar]
- Etienne-Manneville S, Hall A. Rho GTPases in cell biology. Nature. 2002;420:629–635. doi: 10.1038/nature01148. [DOI] [PubMed] [Google Scholar]
- Fukazawa Y, Saitoh Y, Ozawa F, Ohta Y, Mizuno K, Inokuchi K. Hippocampal LTP is accompanied by enhanced F-actin content within the dendritic spine that is essential for late LTP maintenance in vivo. Neuron. 2003;38:447–460. doi: 10.1016/s0896-6273(03)00206-x. [DOI] [PubMed] [Google Scholar]
- Grove M, Demyanenko G, Echarri A, Zipfel PA, Quiroz ME, Rodriguiz RM, Playford M, Martensen SA, Robinson MR, Wetsel WC, Maness PF, Pendergast AM. ABI2-deficient mice exhibit defective cell migration, aberrant dendritic spine morphogenesis, and deficits in learning and memory. Mol Cell Biol. 2004;24:10905–10922. doi: 10.1128/MCB.24.24.10905-10922.2004. [DOI] [PMC free article] [PubMed] [Google Scholar]
- Hinz B, Alt W, Johnen C, Herzog V, Kaiser HW. Quantifying lamella dynamics of cultured cells by SACED, a new computer-assisted motion analysis. Exp Cell Res. 1999;251:234–243. doi: 10.1006/excr.1999.4541. [DOI] [PubMed] [Google Scholar]
- Hufner K, Higgs HN, Pollard TD, Jacobi C, Aepfelbacher M, Linder S. The verprolin-like central (vc) region of Wiskott-Aldrich syndrome protein induces Arp2/3 complex-dependent actin nucleation. J Biol Chem. 2001;276:35761–35767. doi: 10.1074/jbc.M106520200. [DOI] [PubMed] [Google Scholar]
- Innocenti M, Zucconi A, Disanza A, Frittoli E, Areces LB, Steffen A, Stradal TE, Fiore PP, Carlier MF, Scita G. Abi1 is essential for the formation and activation of a WAVE2 signalling complex. Nat Cell Biol. 2004;6:319–327. doi: 10.1038/ncb1105. [DOI] [PubMed] [Google Scholar]
- Kaech S, Fischer M, Doll T, Matus A. Isoform specificity in the relationship of actin to dendritic spines. J Neurosci. 1997;17:9565–9572. doi: 10.1523/JNEUROSCI.17-24-09565.1997. [DOI] [PMC free article] [PubMed] [Google Scholar]
- Kawano Y, Yoshimura T, Tsuboi D, Kawabata S, Kaneko-Kawano T, Shirataki H, Takenawa T, Kaibuchi K. CRMP-2 is involved in kinesin-1-dependent transport of the Sra-1/WAVE1 complex and axon formation. Mol Cell Biol. 2005;25:9920–9935. doi: 10.1128/MCB.25.22.9920-9935.2005. [DOI] [PMC free article] [PubMed] [Google Scholar]
- Kim Y, Sung JY, Ceglia I, Lee KW, Ahn JH, Halford JM, Kim AM, Kwak SP, Park JB, Ho Ryu S, Schenck A, Bardoni B, Scott JD, Nairn AC, Greengard P. Phosphorylation of WAVE1 regulates actin polymerization and dendritic spine morphology. Nature. 2006;442:814–817. doi: 10.1038/nature04976. [DOI] [PubMed] [Google Scholar]
- Kim YT, Wu CF. Distinctions in growth cone morphology and motility between monopolar and multipolar neurons in Drosophila CNS cultures. J Neurobiol. 1991;22:263–275. doi: 10.1002/neu.480220306. [DOI] [PubMed] [Google Scholar]
- Kutsche K, Yntema H, Brandt A, Jantke I, Nothwang HG, Orth U, Boavida MG, David D, Chelly J, Fryns JP, Moraine C, Ropers HH, Hamel BC, van Bokhoven H, Gal A. Mutations in ARHGEF6, encoding a guanine nucleotide exchange factor for Rho GTPases, in patients with X-linked mental retardation. Nat Genet. 2000;26:247–250. doi: 10.1038/80002. [DOI] [PubMed] [Google Scholar]
- Liu P, Jenkins NA, Copeland NG. A highly efficient recombineering-based method for generating conditional knockout mutations. Genome Res. 2003;13:476–484. doi: 10.1101/gr.749203. [DOI] [PMC free article] [PubMed] [Google Scholar]
- Loureiro JJ, Rubinson DA, Bear JE, Baltus GA, Kwiatkowski AV, Gertler FB. Critical roles of phosphorylation and actin binding motifs, but not the central proline-rich region, for Ena/vasodilator-stimulated phosphoprotein (VASP) function during cell migration. Mol Biol Cell. 2002;13:2533–2546. doi: 10.1091/mbc.E01-10-0102. [DOI] [PMC free article] [PubMed] [Google Scholar]
- Machesky LM, Insall RH. Scar1 and the related Wiskott-Aldrich syndrome protein, WASP, regulate the actin cytoskeleton through the Arp2/3 complex. Curr Biol. 1998;8:1347–1356. doi: 10.1016/s0960-9822(98)00015-3. [DOI] [PubMed] [Google Scholar]
- Moon SY, Zheng Y. Rho GTPase-activating proteins in cell regulation. Trends Cell Biol. 2003;13:13–22. doi: 10.1016/s0962-8924(02)00004-1. [DOI] [PubMed] [Google Scholar]
- Morris RG, Willshaw DJ. Memory. Must what goes up come down? Nature. 1989;339:175–176. doi: 10.1038/339175a0. [DOI] [PubMed] [Google Scholar]
- Morris RG, Garrud P, Rawlins JN, O'Keefe J. Place navigation impaired in rats with hippocampal lesions. Nature. 1982;297:681–683. doi: 10.1038/297681a0. [DOI] [PubMed] [Google Scholar]
- Moser MB, Trommald M, Andersen P. An increase in dendritic spine density on hippocampal CA1 pyramidal cells following spatial learning in adult rats suggests the formation of new synapses. Proc Natl Acad Sci USA. 1994;91:12673–12675. doi: 10.1073/pnas.91.26.12673. [DOI] [PMC free article] [PubMed] [Google Scholar]
- Newey SE, Velamoor V, Govek EE, Van Aelst L. Rho GTPases, dendritic structure, and mental retardation. J Neurobiol. 2005;64:58–74. doi: 10.1002/neu.20153. [DOI] [PubMed] [Google Scholar]
- Ng J, Nardine T, Harms M, Tzu J, Goldstein A, Sun Y, Dietzl G, Dickson BJ, Luo L. Rac GTPases control axon growth, guidance and branching. Nature. 2002;416:442–447. doi: 10.1038/416442a. [DOI] [PubMed] [Google Scholar]
- Nozumi M, Nakagawa H, Miki H, Takenawa T, Miyamoto S. Differential localization of WAVE isoforms in filopodia and lamellipodia of the neuronal growth cone. J Cell Sci. 2003;116:239–246. doi: 10.1242/jcs.00233. [DOI] [PubMed] [Google Scholar]
- Oh MC, Derkach VA. Dominant role of the GluR2 subunit in regulation of AMPA receptors by CaMKII. Nat Neurosci. 2005;8:853–854. doi: 10.1038/nn1476. [DOI] [PubMed] [Google Scholar]
- Okamoto K, Nagai T, Miyawaki A, Hayashi Y. Rapid and persistent modulation of actin dynamics regulates postsynaptic reorganization underlying bidirectional plasticity. Nat Neurosci. 2004;7:1104–1112. doi: 10.1038/nn1311. [DOI] [PubMed] [Google Scholar]
- Ramakers GJ. Rho proteins, mental retardation and the cellular basis of cognition. Trends Neurosci. 2002;25:191–199. doi: 10.1016/s0166-2236(00)02118-4. [DOI] [PubMed] [Google Scholar]
- Ramon-Moliner E. New York: Springer; 1970. The Golgi-Cox technique. [Google Scholar]
- Rodal AA, Sokolova O, Robins DB, Daugherty KM, Hippenmeyer S, Riezman H, Grigorieff N, Goode BL. Conformational changes in the Arp2/3 complex leading to actin nucleation. Nat Struct Mol Biol. 2005;12:26–31. doi: 10.1038/nsmb870. [DOI] [PubMed] [Google Scholar]
- Rohatgi R, Ma L, Miki H, Lopez M, Kirchhausen T, Takenawa T, Kirschner MW. The interaction between N-WASP and the Arp2/3 complex links Cdc42-dependent signals to actin assembly. Cell. 1999;97:221–231. doi: 10.1016/s0092-8674(00)80732-1. [DOI] [PubMed] [Google Scholar]
- Schenck A, Qurashi A, Carrera P, Bardoni B, Diebold C, Schejter E, Mandel JL, Giangrande A. WAVE/SCAR, a multifunctional complex coordinating different aspects of neuronal connectivity. Dev Biol. 2004;274:260–270. doi: 10.1016/j.ydbio.2004.07.009. [DOI] [PubMed] [Google Scholar]
- Shi Y, Alin K, Goff SP. Abl-interactor-1, a novel SH3 protein binding to the carboxy-terminal portion of the Abl protein, suppresses v-abl transforming activity. Genes Dev. 1995;9:2583–2597. doi: 10.1101/gad.9.21.2583. [DOI] [PubMed] [Google Scholar]
- Soderling SH, Binns KL, Wayman GA, Davee SM, Ong SH, Pawson T, Scott JD. The WRP component of the WAVE-1 complex attenuates Rac-mediated signalling. Nat Cell Biol. 2002;4:970–975. doi: 10.1038/ncb886. [DOI] [PubMed] [Google Scholar]
- Soderling SH, Langeberg LK, Soderling JA, Davee SM, Simerly R, Raber J, Scott JD. Loss of WAVE-1 causes sensorimotor retardation and reduced learning and memory in mice. Proc Natl Acad Sci USA. 2003;100:1723–1728. doi: 10.1073/pnas.0438033100. [DOI] [PMC free article] [PubMed] [Google Scholar]
- Sotgia F, Minetti C, Lisanti MP. Localization of the human caveolin-3 gene to the D3S18/D3S4163/D3S4539 locus (3p25), in close proximity to the human oxytocin receptor gene. Identification of the caveolin-3 gene as a candidate for deletion in 3p-syndrome. FEBS Lett. 1999;452:177–180. doi: 10.1016/s0014-5793(99)00658-4. [DOI] [PubMed] [Google Scholar]
- Star EN, Kwiatkowski DJ, Murthy VN. Rapid turnover of actin in dendritic spines and its regulation by activity. Nat Neurosci. 2002;5:239–246. doi: 10.1038/nn811. [DOI] [PubMed] [Google Scholar]
- Steffen A, Rottner K, Ehinger J, Innocenti M, Scita G, Wehland J, Stradal TE. Sra-1 and Nap1 link Rac to actin assembly driving lamellipodia formation. EMBO J. 2004;23:749–759. doi: 10.1038/sj.emboj.7600084. [DOI] [PMC free article] [PubMed] [Google Scholar]
- Strasser GA, Rahim NA, VanderWaal KE, Gertler FB, Lanier LM. Arp2/3 is a negative regulator of growth cone translocation. Neuron. 2004;43:81–94. doi: 10.1016/j.neuron.2004.05.015. [DOI] [PubMed] [Google Scholar]
- Volkmann N, Amann KJ, Stoilova-McPhie S, Egile C, Winter DC, Hazelwood L, Heuser JE, Li R, Pollard TD, Hanein D. Structure of Arp2/3 complex in its activated state and in actin filament branch junctions. Science. 2001;293:2456–2459. doi: 10.1126/science.1063025. [DOI] [PubMed] [Google Scholar]
- Westphal RS, Soderling SH, Alto NM, Langeberg LK, Scott JD. Scar/WAVE-1, a Wiskott-Aldrich syndrome protein, assembles an actin- associated multi-kinase scaffold. EMBO J. 2000;19:4589–4600. doi: 10.1093/emboj/19.17.4589. [DOI] [PMC free article] [PubMed] [Google Scholar]
- Zeng H, Chattarji S, Barbarosie M, Rondi-Reig L, Philpot BD, Miyakawa T, Bear MF, Tonegawa S. Forebrain-specific calcineurin knockout selectively impairs bidirectional synaptic plasticity and working/episodic-like memory. Cell. 2001;107:617–629. doi: 10.1016/s0092-8674(01)00585-2. [DOI] [PubMed] [Google Scholar]