Abstract
To investigate perceived differences in the ability of current software to simulate the actual outcome of orthognathic surgery, we chose 10 difficult test cases with vertical discrepancies and “retreated” them using the actual surgical changes. Five programs—Dentofacial Planner Plus, Dolphin Imaging, Orthoplan, Quick Ceph Image, and Vistadent—were evaluated, by using both the default result and a refined result created with each program’s enhancement tools. Three panels (orthodontists, oral-maxillofacial surgeons, and laypersons) judged the default images and the retouched simulations by ranking the simulations in side-by-side comparisons and by rating each simulation relative to the actual outcome on a 6-point scale. For the default and retouched images, Dentofacial Planner Plus was judged the best default simulation 79% and 59% of the time, respectively, and its default images received the best (lowest) mean score (2.46) on the 6-point scale. It also scored best (2.26) when the retouched images were compared, but the scores for Dolphin Imaging (2.83) and Quick Ceph (3.03) improved. Retouching had little impact on the scores for the other programs. Although the results show differences in simulation ability, selecting a software package depends on many factors. Performance and ease of use, cost, compatibility, and other features such as image and practice management tools are all important considerations. Users concerned with operating system compatibility and practice management integration might want to consider Dolphin Imaging and Quick Ceph, the programs comprising the second tier.
To obtain true informed consent in orthognathic surgery, the orthodontist and the oral-maxillofacial surgeon must effectively explain possible treatment outcomes to the patient. It is difficult, if not impossible, to impart the facial appearance changes that will result from orthognathic surgery without visual aids. In the 1970s, clinicians used cut-and-paste profile tracings of patient photographs, which were neither realistic nor accurate. In the 1980s, computer-generated line drawings of the profile based on hard tissue changes became possible; by the mid-1990s, treatment simulation software allowing the incorporation of a patient’s photographic likeness was offered commercially.
At present, several software systems allow clinicians to manipulate digital representations of hard and soft tissue profile tracings and subsequently morph the pretreatment image to produce a treatment simulation. How well these predictions match the actual outcome of treatment has not been carefully evaluated, but anecdotal evidence suggests that the predictions might be less accurate when major vertical changes in jaw positions are planned. Most previous research involving computer simulation has focused on the accuracy of the predicted changes in the soft tissue points, by measuring the differences in soft and hard tissue landmarks on prediction and postsurgical tracings.
The rapid evolution of both hardware and software should be considered when reviewing the literature. In the line-drawings era, Dentofacial Planner (Dentofacial Software, Toronto, Ontario, Canada) was reviewed by several authors who concluded that its predictions of nose and chin position were generally accurate but noted greater variability in lip predictions.1-3 An evaluation of line drawing simulations produced by an early version of Quick Ceph (Quick Ceph Systems, San Diego, Calif) was generally accurate, but, like Dentofacial Planner, the simulation of lower lip changes created difficulty.4
Prescription Planner/Portrait was an early computer program that allowed linking the lateral cephalometric radiograph with the lateral photograph, so that the preoperative lateral photograph could be morphed in response to movement of skeletal structures. In 1995, Sinclair et al5 evaluated this program in 2 ways. First, the linear differences between actual and predicted outcome tracings were measured. As with other programs, the upper lip and chin regions were well predicted, but the lower lip’s predicted position was variable. Second, an orthodontist and an oral surgeon evaluated the perceived quality of side-by-side comparisons of actual and simulated outcomes. Depending on which region of the profile was analyzed, 60% to 83% of the simulations were judged to be very good or excellent and acceptable for treatment planning. All images were judged suitable for presentation to patients.
A similar study of the perceived quality of simulations evaluated an early version of Dentofacial Planner Plus, the profile image program, and used larger panels of 25 laypersons and 25 professionals (17 orthodontists, 8 surgeons).6 Treatment predictions were perceived as clinically acceptable by 95% of the lay panel and 88% of the professional group. All actual outcomes were judged to be more pleasing than the treatment simulation. Schultes et al7 noted that, with this program, the submental area in addition to the lower lip was problematic when predicting change resulting from mandibular advancement, and, recently, investigators in Germany came to the same conclusion.8
Using an early version of Quick Ceph Image, Upton et al9 reported that mean differences in the predicted and actual landmark positions were small and, in the authors’ opinion, clinically insignificant. In 1997, early versions of Quick Ceph Image and Dentofacial Planner Plus were subjected to side-by-side comparison by Aharon et al.10 Both programs appeared to perform well in simulating single-jaw and 2-jaw surgeries. Only the predicted horizontal position of the upper lip (−2.0 mm) differed significantly from the real outcome for Quick Ceph Image, and only the position of soft tissue menton (0.9 mm) and the lower lip (−2.8 mm) were significantly different for Dentofacial Planner Plus. Both programs tended to produce errors in the same anatomic regions, particularly for the lower lip, and both demonstrated a linear decrease in prediction accuracy as the surgical movement increased.
Orthognathic Treatment Planner (GAC International, Birmingham, Ala), a predecessor of GAC’s Visadent program, was evaluated in 1999 by Curtis et al,11 who measured actual versus predicted landmark differences on lateral tracings. Nearly 50% of the predicted soft tissue landmarks varied by more than 1 mm, leading to the conclusion that soft tissue prediction was reasonably accurate. When this program was compared with Prescription Portrait/Planner, performance in simulating mandibular advancement was similar. The simulated position of the upper lip was described as 80% accurate, but the lower lip position was judged to be less than 50% accurate. In a similar study,12 a panel consisting of 2 orthodontists, 2 surgeons, and 2 laypersons evaluated simulations with side-by-side comparisons of predicted and actual outcomes. When particular areas were examined, the results paralleled those from the comparisons of line drawings. The upper lip, chin, and submental areas scored 64 of a possible 100, and the lower lip received an average score of 51.
Our pilot studies with current imaging programs have shown that most now produce reasonable simulations when the surgical movements are moderate and limited to the sagittal plane, and the patients have competent lips with little eversion. The accuracy of the surgery itself rarely is a problem now. For most patients, surgeons can place the jaws quite close to the planned position.13 In the context of clinical usefulness, the extent to which clinicians and patients perceive the simulation to be realistic is more important than the precision of the predicted points on the profile.
Our objectives were to determine the perceived quality of software currently available for treatment simulation of orthognathic surgery, by using a sample of patients with morphology known to produce wide variations in simulation outcome and to study whether differences in perception exist between clinicians (orthodontists and surgeons) and laypersons.
MATERIAL AND METHODS
The 5 programs with the largest US market share were chosen for evaluation (Table I): Dentofacial Planner Plus version 2.5b (DFP) (Dentofacial Software), Dolphin Imaging version 8.0 (DI) (Dolphin Imaging, Chatsworth, Calif), Vistadent AT (GAC) (GAC International) (successor to Prescription Portrait/Planner), OrthoPlan version 3.0.4 (OP) (Practice Works, Atlanta, Ga) (successor to Orthognathic Treatment Planner), and Quick Ceph 2000 (QC) (Quick Ceph Systems). Current software as of October 1, 2002, was used. From a private oral and maxillofacial surgery practice in North Carolina that specializes in orthognathic surgery, records that met these criteria were reviewed: (1) complete records including lateral cephalograms and profile photos taken after orthodontic preparation before surgery and soon after the final orthodontic appliances were removed; (2) photographs with adequate resolution and quality and radiographs allowing identification of all necessary hard and soft tissue landmarks; (3) minimal orthodontic dental movement after surgery; and (4) adequate elapsed time between surgery and final photos (average 11 months).
Table I.
Imaging programs
| Program | Manufacturer/contact information | Recommended operating system |
List price |
|---|---|---|---|
| DFP | Dentofacial Software, Inc. www.dentofacial.com | Windows 98 | * |
| DI | Dolphin Imaging, 9200 Eton Ave, Chatsworth, CA 91311. www.dolphinimaging.com |
Windows 98, 2000, XP | $8495 |
| OP | PracticeWorks (Pacific Coast Software), 1765 The Exchange, Atlanta, GA 30339. www.practiceworks.com |
Windows | $8500† |
| QC | Quick Ceph Systems, 9883 Pacific Heights Blvd, San Diego, CA 92121. www.quickceph.com |
Macintosh | $3499 |
| GAC | GAC International, 2108 Rocky Ridge Rd, Birmingham, AL 35233. www.gactechnocenter.com |
Windows XP Pro | $3995 |
Current price and availability not supplied by company.
Rarely sold stand alone
From approximately 100 patients, 10 were selected by 2 experienced oral-maxillofacial surgeons for their soft tissue morphology to challenge the current prediction software. All had vertical and horizontal skeletal discrepancies. Five had short anterior face height with lip redundancy, and 5 had long anterior face height with lip incompetence. Although their ages at surgery ranged from 14 to 43 years with an average age of 21, most were in their late teens. Those in the long-face group had surgery for superior repositioning of the maxilla, with or without simultaneous mandibular surgery. Those in the short-face group had mandibular advancement with some postsurgical orthodontic leveling of the dental arches. Some patients in each group also had a lower border osteotomy of the mandible to reposition the chin. Neither demographic characteristics nor type of surgical procedure was considered during subject selection. Informed consent and assent were obtained for all subjects with forms approved by the Internal Review Board of the University of North Carolina before any records were subjected to computer simulation.
Before treatment simulation, the skeletal movement from the surgery was determined by using best-fit superimposition of presurgical and postsurgical cephalometric tracings on cranial base structures. The dental movements were established via regional superimposition on the maxilla and mandible. An x-y coordinate system was established by using a horizontal line through sella rotated down 6° from S-N as the x-axis, and a line through sella and perpendicular to the horizontal axis as the y-axis. Horizontal and vertical movements were measured relative to this reference. In the case of genioplasty, surgical movement was determined by best-fit superimposition along the inferior border of the mandible and internal architecture. Dental measurements were reviewed so that if postsurgical orthodontic movement occurred during finishing, it could be included in the computer retreatment.
To standardize the data entry and remove bias due to variations in landmark identification, a presurgery cephalometric tracing was produced for each patient to identify the critical points required by each program. This tracing was used for data entry with each program, so that the cephalometric radiograph could be digitized consistently according to each manufacturer’s instructions. The same presurgical lateral at-rest photograph of each patient was also imported into each of the 5 programs. The photograph and digitized cephalometric tracing were then linked by using the program-specific technique.
Each patient was retreated with all software packages, by using the actual surgical and orthodontic movements. The default algorithms and settings programmed by each manufacturer were used to morph the linked initial photograph/cephalometric tracing and generate a treatment simulation. For all programs, the “best” or “better” morphing option was used if an option was available. Because the manufacturer of QC expressed concern that its “better” option might not perform as well as the standard one, comparison simulations for this program were done by using both options before the “better” one was chosen as in fact superior. The default image produced by each program was then exported or captured for presentation.
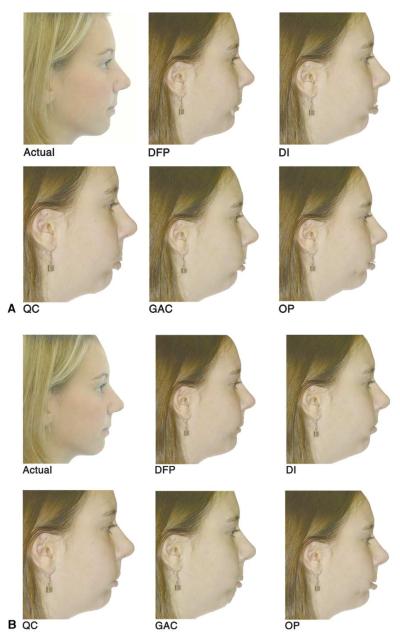
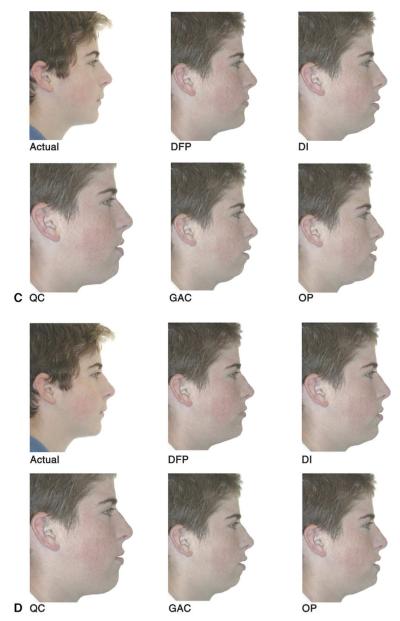
The effectiveness and efficiency of each program’s artistic tools were also evaluated. After capturing or exporting the default image, the operator (J.D.S.) used the built-in image enhancement and soft tissue manipulation tools to refine and retouch the simulations by removing soft tissue “tags,” filling in “windows,” blending blemishes, and rounding sharp angles as shown in Figure 1 (compare A with B, and C with D). Although gross errors were removed, the intent was to only refine the program’s simulation, not to use artistry to arbitrarily improve the simulation’s appearance. A 3-minute time limit for image refinement, found to be the point of diminishing returns, was used. The default and retouched morphed images were cropped with Photoshop photo management software (Adobe, San Jose, Calif) to standardize the image presentation as much as possible. Then, PowerPoint (Microsoft, Redmond, Wash) was used to create a comparison presentation.
Fig 1.
Images were presented in slides like these for ranking order of simulation quality (but prediction images were labeled only A-E when presented to judges and randomly placed on evaluation slide). A (top 2 rows), Actual outcome and default prediction for each program for short-face patient who had surgery to advance her severely deficient mandible; B (bottom 2 rows), retouched predictions for same patient, using program tools and 3-minute time limit; C (next page, top 2 rows), actual outcome and default predictions for long-face patient who had surgery to move maxilla up and mandible back; D (next page, bottom 2 rows), retouched predictions for same patient.
Three groups of panelists (orthodontists, oral-maxillofacial surgeons, and laypersons) were recruited to review the treatment simulations. Eight surgeons (5 in private practice, 3 full-time academics) and 9 orthodontists (8 in private practice and 1 previously in private practice, now full-time academic) participated. The laypersons were adult family members of patients undergoing initial appliance placement in the UNC orthodontic clinic. Family members of patients who had received surgical plans including treatment simulations were excluded, and only 1 family member per patient was asked to participate. Nine laypersons participated. Consent was obtained from all panelists before their participation in the study, according to IRB guidelines of the University of North Carolina.
In the image presentation, the subject’s actual posttreatment outcome and the simulations from the 5 programs were shown on a single slide to allow side-by-side comparison (Fig 1). The upper left image, the actual outcome, was so labeled. The other 5 images, labeled “A” through “E,” were randomly positioned for each slide. Default and retouched images were presented separately, so for each subject, 2 slides were constructed, 1 containing the actual outcome and all default simulation images, and the other containing the actual outcome and all retouched simulation images. They were not identified as default or retouched. Two slides (10% of the total) were randomly repeated to test the panelists’ reliability. The presentation of the 22 slides was randomized.
An optical scan answer sheet and a CD containing the PowerPoint presentations were given to the professional panelists, who viewed them on their own computers. The members of the lay panel viewed the presentations privately on a 27-in monitor in a consultation room in the orthodontic clinic. For each slide, the panelists were asked to rank the simulations in order of decreasing resemblance to the actual outcome. Instructions were printed on the answer sheet and on an instruction slide preceding the presentation.
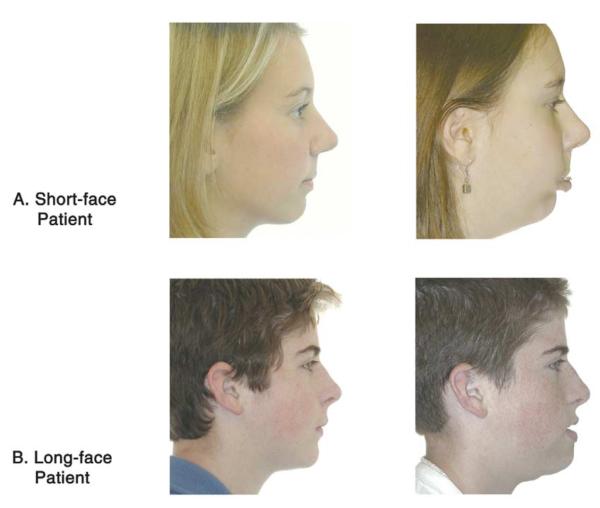
The second part of the presentation was used to individually evaluate the resemblance of each simulation to the actual outcome. Each simulation was presented on a slide also containing the actual posttreatment image (Fig 2), and the panelists were asked to assign a score from 1 (identical) to 6 (no resemblance). Because 2 slides were needed for each of the 10 patients (default, retouched) for each of the 5 programs, 100 slides were necessary. Ten percent were repeated for reliability assessment, bringing the total number of slides to 110.
Fig 2.
Actual posttreatment outcomes and predictions presented for evaluating simulation quality. Instructions stated: “For each slide, compare the predicted outcome on the right with the actual outcome on the left, using the following 6-point scale: 1 = identical; 2 3 4 5 6 = no resemblance.” Both default and retouched simulations for each patient were rated by all observers, with no information about whether the image was retouched. A, Default simulation; B, default simulation.
For both the statistical analyses, the scores on the duplicated slides were almost identical, and the data were judged to be reliable. Multi-level repeated measures analysis of variance was performed with the SAS statistical package (SAS, Cary, NC). Panel, software package, and default or retouched status were considered as within-subject factors, and face type (short or long) as a between-subject factor. All possible interactions including third order were included in the original model. Contrasts between programs using the averaged response across the panels were performed by using multivariate linear combinations. The level of significance was set at 0.05.
RESULTS
DFP was the clear favorite in each observer group (Fig 3). Statistically significant interactions (P < .05) occurred between image status (retouched vs default), program and image status, and program, image status, and face type. This suggests that retouching an image had a substantial effect on the rank order of the simulation when compared with the other programs. Although statistically significant, this effect was not enough to change the rank sequence established by default comparisons.
Fig 3.
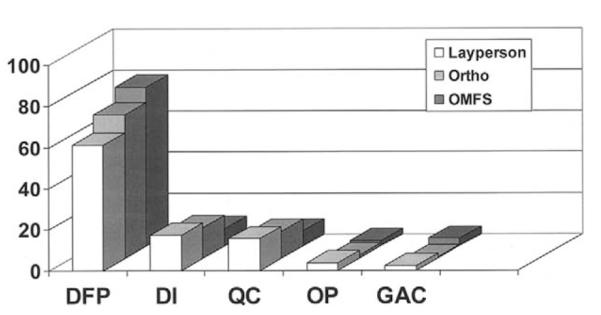
Percentage of times each program was ranked as producing best simulation of actual outcome by 3 groups of observers. Differences between observer groups were not statistically significant, so groups were combined for further analysis. Ortho, Orthodontists; OMFS, oral-maxillofacial surgeons.
On average, the default simulations of DFP were perceived by the panelists to most resemble the actual result 79% of the time. DI and QC comprised the second tier, ranked first 10% and 5% of the time, respectively. GAC and OP formed a distant third tier, ranked first a combined 6% of the time. As Figure 3 shows, rankings by the 3 groups (orthodontists, oral-maxillofacial surgeons, and laypersons) were quite similar. The lay group was slightly less likely to rank DFP first, with the orthodontists in the middle and the surgeons ranking it highest. This pattern was reversed for both QC and DI, but the differences between panels did not approach statistical significance
Retouching the simulations by repositioning soft tissue points and using the image enhancement tools of each program improved the average ranking for DI and QC, while making the ranking slightly worse for the other 3 programs, but did not alter the sequence established by the default simulations (Fig 4).
Fig 4.
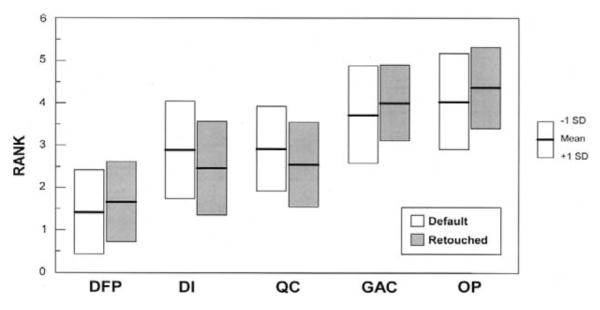
Mean rankings for each program for default and retouched images (on this graph, lower scores are better: 1 = best, 5 = worst). Image enhancement improved rankings for DI and QC and slightly decreased them for other 3 programs.
When the percentage who ranked each program either 1 or 2 is examined (Fig 5), it is clear that the 5 software programs can be placed in 3 tiers. For both default and retouched simulations, DFP has the lowest (best) mean rank and is significantly different from all other programs. DI and QC, statistically equal, comprise the second tier. GAC and OP also show no difference from each other; they form the third tier. The difference between tiers was statistically significant (P <.05).
Fig 5.
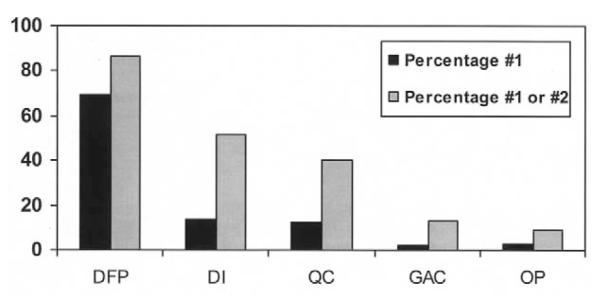
Percentage of times each program was chosen as providing best or second-best simulation by combined observers. Differences between DI and QC and between GAC and OP were not statistically significant; differences between 3 tiers were significant.
The mean simulation quality score for each software package, and the scores for default vs retouched and long-face vs short-face patients, are shown in Table II. The same 3 tiers exist: DFP first, DI and QC in the second tier, and GAC and OP in the third tier. After retouching, the gap between the first and the second tiers narrowed.
Table II.
Simulation quality scores
| Program | Default | Retouched | Long face | Short face |
|---|---|---|---|---|
| DFP | 2.5 ± 1.0 | 2.3 ± 1.0 | 2.4 ± 1.0 | 2.4 ± 1.1 |
| DI | 3.9 ± 1.4 | 2.8 ± 1.1 | 3.1 ± 1.2 | 3.5 ± 1.5 |
| QC | 4.0 ± 1.2 | 3.0 ± 1.2 | 3.7 ± 1.1 | 3.3 ± 1.4 |
| GAC | 4.3 ± 1.3 | 3.9 ± 1.4 | 4.3 ± 1.1 | 3.9 ± 1.5 |
| OP | 4.5 ± 1.2 | 4.4 ± 1.3 | 4.4 ± 1.0 | 4.5 ± 1.5 |
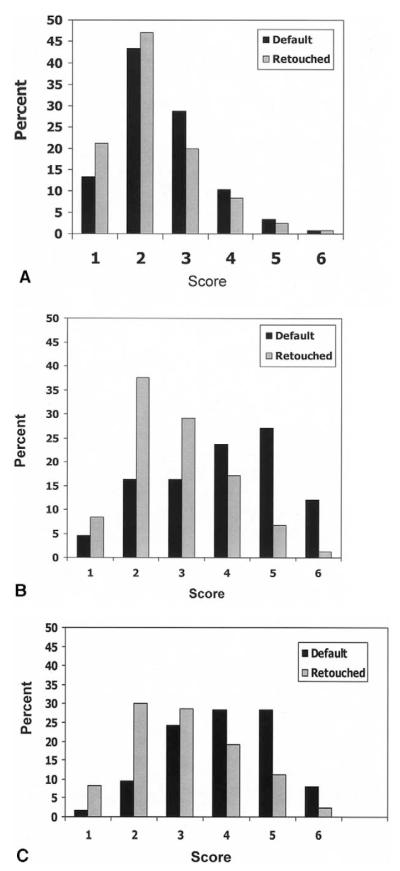
The effect on perceived simulation quality from retouching the images is shown for the top 3 programs in Figure 6. Retouching the images improved the quality for all the programs, ie, the percentages of scores of 1 and 2 increased and the percentage of poorer scores decreased, but retouching made a greater difference for DI and QC than for DFP and the other programs.
Fig 6.
Effect on perceived simulation quality from retouching the images, using image enhancement tools provided with each program. Data are presented as percentage of times simulation was rated as 1 (identical) to 6 (no resemblance). Note that retouching greatly improved scores for DI and QC, not so much for DFP. A, DFP; B, DI; C, QC.
Statistically significant interactions (P <.05) occurred between image status (retouched vs default), face type and program, and image status and group. This suggests that retouching an image had a substantial effect on the perceived resemblance of the simulation to the actual outcome. Table II illustrates the effect of retouching on the scores for each program. Although DI and QC were much more highly regarded after retouching, DFP, OP and GAC were less affected.
When the mean scores by facial type were examined (Table II), an interesting pattern was noted. For retouched simulations, there was a significant interaction between face type and program that did not exist in the default state. DFP, judged to produce the simulations of greatest resemblance to the actual outcome, did so consistently, with no appreciable difference when long-faced and short-faced subjects were compared. The same was true for GAC and OP, with both consistently rated poorly regardless of facial type. DI and QC were variable, with DI handling long-face subjects better and QC more competent with the short-face group. When the subjects were divided into these groups, the panelists still had little effect on the scoring.
For unretouched simulations, there was no significant interaction with face type, but there was a statistically significant difference between the programs.
DISCUSSION
The separation of current prediction imaging programs into 3 tiers, with DFP perceived as the most accurate, reflects fundamental differences among the programs. These include differences in algorithms relating soft to hard tissue movement, linking technique, program versus operator control of simulated lip position, and complexity and efficiency of image refinement tools.
All simulation programs are based on algorithms that relate soft tissue response to skeletal repositioning. Soft tissue response to skeletal movement is simulated by software based on preprogrammed hard-to-soft tissue ratios, and these differ among the programs.
Traditionally, software developers have used linear ratios for soft tissue movement. This approach assumes that the soft tissue response is a fixed percentage of skeletal movement, regardless of skeletal change. With the exception of DFP, all programs in this study incorporate linear ratios that the user can customize. According to presentations by DFP’s developer (Dr Rick Walker), it uses nonlinear ratios with pattern recognition to predict soft tissue response. For example, in actuality with maxillary advancement, the ratio of upper lip advancement to hard tissue movement can be minimal for small movements due to lack of contact between the incisors and the lip. With continued advancement, the ratio of soft tissue movement increases, and then, beyond some point, the lip begins to become taut or thin, and the ratio decreases. The developer stated that his programmed algorithms consider this type of nonlinear response. Furthermore, pattern recognition is used to deal with lip trap, incompetence, and mentalis strain. For this reason, DFP ratios are hard-coded, and there is no option for adjustment.
A second component of the variability among programs is the method and sophistication of radiograph/ photograph linking techniques. Several factors influence linking proficiency including the number of points along the soft tissue profile and the ability to adjust for scale and rotation. Although all the programs attempt to closely match the digitized cephalogram to the lateral photograph, differences exist. DFP, DI, GAC, and QC match a digitized cephalogram to the lateral photo by digitizing common points on each. DFP, DI, and QC then allow the cephalogram to be appropriately manipulated and scaled to size to allow a closer match. GAC does not allow for effective soft tissue correction, leading to artifacts such as tissue tags. Although the linking for DI and QC appears highly effective, DFP could be improved by adding more points along the soft tissue outline to allow better curve fitting.
OP accomplishes linking by digitizing some soft tissue landmarks on the radiograph, but most points, including the lips, are digitized on the photo. Then the 2 are electronically married, eliminating the need to adjust the soft tissue of the photo to match the lateral cephalogram. Upton et al9 reported that the OP method appears to cause some difficulty when head position does not closely match in the photo and the radiograph, and they rejected test cases on this basis. It is obvious that the quality of the link between the cephalogram and the photo significantly impacts the program’s ability to morph soft tissue. Poor linking results in tissue tags, omissions, and sharp angles.
The method of handling the upper and lower lip response, ie, program control versus operator control of lip posture, was probably the major factor in stratifying the simulation software. If the links are performed according to the developer’s guidelines, DFP software consistently produces lip competence and corrects for lip eversion, regardless of the severity of the malocclusion. The lips are brought into an esthetic apposition and posture independent of the magnitude of skeletal movement. A module called the “fixer” can be used for fine adjustment if indicated. DI and QC default settings appear to approach lip apposition with moderation, only partially reducing lip incompetence, but allow the operator easy arbitrary manipulation of lip position. DI goes a step farther by using an “auto lip adjustment” feature. This allows the operator to arbitrarily and simultaneously adjust both lips in a vertical and horizontal plane by moving a slider control. Although the DFP automatic approach to lip management seems arbitrary and potentially susceptible to error, its default performed better than the other programs’ defaults that give the operator less automation and more control.
Finally, the efficiency and effectiveness of image refinement tools affect the operator’s ability to adjust simulations according to personal beliefs of what the soft tissue response will be. DI and QC have highly refined and effective image manipulation tools that allow much greater correction of tissue contours and positions than was illustrated here. DFP’s tools are less sophisticated but still effective because of the limited adjustment needed on default simulations. GAC and OP, the third-tier programs, have limited tools that are cumbersome to use. OP had only the ability to move soft tissue points and then remorph the image.
What do these findings mean to the clinician evaluating the purchase of an imaging program? DFP was clearly the favorite, garnering the most first-place rankings for simulation quality regardless of face type, panelist background, or whether additional time was spent refining images. However, other factors must be considered in judging the utility of treatment simulation software. DFP is not now compatible with operating systems newer than Windows 98. It is a 32-bit DOS program that must be used with a companion Windows program (Showcase) to archive raw images and modify them to be DFP compatible. Due to program design, the DFP image resolution is considerably lower and the color palette limited when compared with the other 4 programs. Because most practice-management systems are based on Windows or Unix, “work-arounds” are needed to integrate DFP with existing office systems. The Showcase program has a feature to embed images in correspondence but has no direct integration with existing management software.
Users concerned with operating system compatibility and practice-management integration should consider the second-tier programs. DI and QC were judged virtually identical in the default and limited refinement simulations. Both have sophisticated refinement tools and the ability to drag and remorph soft tissue points quickly and effectively; this allows much greater arbitrary image improvement than shown here. DI uses discriminant point entry during digitizing and curve fitting by cubic spline functions that place all control points on the actual curve. Adjustments to the contour are made by clicking and dragging these points, with the spline function interpolating the curvature between them.
QC uses a subset of spline functions called Bezier curves. The Bezier functions were originally used in auto design and are the basis of much vector-based software for drawing and illustration. Control points are located both on and off the curve of interest; this might make Bezier functions slightly less intuitive. Additionally, QC requires stream entry of the soft tissue profile during digitizing. Accordingly, the learning curve and ease of use might be determining factors. Because both programs and both curve-fitting methods can produce a smooth transition between subcurves on the facial profile, potential users should try to spend time with each program to see which offers the greatest ease and efficiency.
QC is written for the Apple Macintosh hardware and operating system. In a free-standing or Macintosh-compatible environment, this is of little concern, and the Macintosh platform enables industry-leading resolution for image display. Integration with PC-based management systems, however, requires the extra steps of add-on networking software and image export/import.
Technical support and staff training are also important. Is technical support available 24 hours a day and 7 days a week, or does it consist of leaving a message on voice mail and waiting for a response? To judge the level of technical support, we attempted to contact all vendors. These efforts were successful except for Dentofacial Software; our e-mails and phone calls were unanswered. Although purchase price is always a factor, the end user should consider technical support, the value of time, and the additional resources needed for efficient use in daily practice (Table I). The choice of a program might depend on a combination of simulation quality, ease of integration with existing practice management software, ease of use, and cost.
Software development is continuous, and changes to the programs tested are forthcoming. We used the latest version of all programs as of fall 2002. Changes since then include new linear default ratios for QC. The latest version of DI incorporates a module allowing real-time ratio modification and the ability to save and apply custom ratio sets based on facial type and malocclusion. The developer of DFP has demonstrated a browser-based version that works independently from the operating system and has improved linking, but no release date has been projected. GAC expects to release a new version late in 2003. OP has been purchased by PracticeWorks, and, although outward appearances indicate that current software is very similar to what we evaluated, the manufacturer and the beta users have said that changes are ongoing.
As is the case with computer hardware or digital camera development, there might be no perfect time to purchase the ultimate treatment simulation software. A clinician must evaluate the products available and make a decision based on the factors discussed.
We thank the companies for providing their software, Dr Ceib Phillips for statistical advice and modeling, and Ms Debora Price for data analysis.
Acknowledgments
Supported in part by NIH grant DE-05215 from the National Institute of Dental Research and by the Orthodontic Fund, Dental Foundation of North Carolina.
REFERENCES
- 1.Eales EA, Newton C, Jones ML, Sugar A. The accuracy of computerized prediction of the soft tissue profile: a study of 25 patients treated by means of the Le Fort I osteotomy. Int J Adult Orthod Orthog Surg. 1994;9:141–52. [PubMed] [Google Scholar]
- 2.Konstiantos KA, O’Reilly MT, Close J. The validity of the prediction of soft tissue profile changes after LeFort I osteotomy using the dentofacial planner (computer software) Am J Orthod Dentofacial Orthop. 1994;105:241–9. doi: 10.1016/S0889-5406(94)70117-2. [DOI] [PubMed] [Google Scholar]
- 3.Kolokitha OE, Athanasiou AE, Tuncay OC. Validity of computerized predictions of dentoskeletal and soft tissue profile changes after mandibular setback and maxillary impaction osteotomies. Int J Adult Orthod Orthog Surg. 1996;11:137–54. [PubMed] [Google Scholar]
- 4.Lew KK. The reliability of computerized cephalometric soft tissue prediction following bimaxillary anterior subapical osteotomy. Int J Adult Orthod Orthog Surg. 1992;7:97–101. [PubMed] [Google Scholar]
- 5.Sinclair PM, Kilpelainen P, Phillips C, White RP, Jr, Rogers L, Sarver DL. The accuracy of video imaging in orthognathic surgery. Am J Orthod Dentofacial Orthop. 1995;107:177–85. doi: 10.1016/s0889-5406(95)70134-6. [DOI] [PubMed] [Google Scholar]
- 6.Giangreco TA, Forbes DP, Jacobson RS, Kallal RH, Moretti RJ, Marshall SD. Subjective evaluation of profile prediction using videoimaging. Int J Adult Orthod Orthog Surg. 1995;10:211–27. [PubMed] [Google Scholar]
- 7.Schultes G, Gaggl A, Karcher H. Accuracy of cephalometric and video imaging program Dentofacial Planner Plus in orthognathic surgical planning. Computer Aided Surg. 1998;3:108–14. doi: 10.1002/(SICI)1097-0150(1998)3:3<108::AID-IGS2>3.0.CO;2-T. [DOI] [PubMed] [Google Scholar]
- 8.Csaszar GR, Bruker-Csaszar B, Niederdellmann H. Prediction of soft tissue profiles in orthodontic surgery with the Dentofacial Planner. Int J Adult Orthod Orthog Surg. 1999;14:285–90. [PubMed] [Google Scholar]
- 9.Upton PM, Sadowsky PL, Sarver DM, Heaven TJ. Evaluation of video imaging prediction in combined maxillary and mandibular orthognathic surgery. Am J Orthod Dentofacial Orthop. 1997;112:656–65. doi: 10.1016/s0889-5406(97)70231-2. [DOI] [PubMed] [Google Scholar]
- 10.Aharon PA, Eisig S, Cisneros GJ. Surgical prediction reliability: a comparison of two computer software systems. Int J Adult Orthod Orthog Surg. 1997;12:65–78. [PubMed] [Google Scholar]
- 11.Curtis TJ, Casko JS, Jakobsen JR, Southard TE. Accuracy of a computerized method of predicting soft-tissue changes from orthognathic surgery. J Clin Orthod. 2000;34:524–30. [PubMed] [Google Scholar]
- 12.Syliangco ST, Sameshima GT, Kaminishi RM, Sinclair PM. Predicting soft tissue changes in mandibular advancement surgery: a comparison of two video imaging systems. Angle Orthod. 1997;67:337–46. doi: 10.1043/0003-3219(1997)067<0337:PSTCIM>2.3.CO;2. [DOI] [PubMed] [Google Scholar]
- 13.Jacobson R, Sarver DM. The predictability of maxillary repositioning in LeFort I orthognathic surgery. Am J Orthod Dentofacial Orthop. 2002;122:142–54. doi: 10.1067/mod.2002.125576. [DOI] [PubMed] [Google Scholar]


