Abstract
The X-ray structures of neuronal nitric oxide synthase (nNOS) with Nω-hydroxy-L-arginine (L-NHA) and CO (or NO) bound have been determined at 1.91 to 2.2 Å resolution. Microspectrophotometric techniques confirmed reduced redox state and the status of diatomic ligand complexes during X-ray diffraction data collection. The structure of nNOS-NHA-NO, a close mimic to the dioxygen complex, provides a picture of the potential interactions between the heme-bound diatomic ligand, substrate L-NHA, and the surrounding protein and solvent structure environment. Since the OH group of L-NHA in the X-ray structures deviates from the plane of the guanidinium moiety substantially indicating that the OH-bearing, protonated guanidine Nω nitrogen of L-NHA has substantial sp3 hybridization character. This nitrogen geometry, different from that of the guanidinium Nω nitrogen of L-arginine, allows a hydrogen bond to be donated to the proximal oxygen of the heme-bound dioxygen complex thus preventing cleavage of the O-O bond. Instead, it favors the stabilization of the ferric-hydroperoxy intermediate, Fe3+-OOH-, which serves as the active oxidant in the conversion of L-NHA to NO and citrulline in the second reaction of the NOS.
Nitric oxide (NO) serves as an important signaling molecule and cytotoxic agent in a variety of physiological functions in the nervous, immune, and cardiovascular systems (1, 2). Nitric oxide synthases (NOS) are the enzymes in mammals that produce NO from L-arginine (L-Arg) in a two-step reaction with Nω-hydroxy-L-arginine (NHA) as an intermediate (3). Mammals have three NOS isoforms: neuronal NOS (nNOS), inducible NOS (iNOS), and endothelial NOS (eNOS). All three NOS isoforms share a similar domain architecture (4). The N-terminal module is the catalytic domain with both heme and tetrahydrobiopterin (H4B) binding sites adjacent to each other while the C-terminal region forms the reductase domain that contains FMN, FAD, and NADPH. NADPH provides the reducing equivalents required for catalysis. Electrons are transferred through FAD, FMN, and then to the heme active site which is very similar to the electron flow in mammalian microsomal cytochrome P450s (5). However, electron transfer in NOS is regulated by calmodulin (CaM) which binds between the heme and FMN domains and promotes electron transfer to the heme (6, 7). The structure of the N-terminal domain of NOS is quite distinct from P450 (8, 9), even though, as a heme-thiolate enzyme, NOS does have a characteristic absorption at 444 nm when heme is reduced with CO-bound, which resembles that of a P450 (10-12).
Interactions of diatomic ligands with NOS are vital in understanding the mechanism since O2 and NO are the co-substrate and a product of NOS, respectively, while CO is an inhibitor of NOS activity and also a powerful spectroscopic active site probe. However, the labile nature of these gaseous ligands makes structural studies of enzyme-ligand complexes difficult. The rapid auto-oxidation of NOS-O2 complex has so far prevented us from obtaining a crystal structure of the oxy-complex. Even with the less oxidation sensitive CO- and NO-complexes there often are problems of poor ligand binding or ambiguous initial heme redox states. Previously we have reported ternary complex structures of nNOS or eNOS with L-Arg and CO (or NO) bound (13). In some of the CO complex structures we observed partial density for the ligand, but could not determine whether incomplete ligand occupancy resulted from crystal preparation or the X-ray irradiation. In recent years, microspectrophotometric measurements directly on the crystals used for X-ray data collection have become available at many synchrotron facilities including the Stanford Synchrotron Radiation Lightsource (SSRL). This technique has shown great potential in observing the X-ray induced reductions in redox sensitive cofactors in heme- and flavo-proteins (14). Here we report crystal structures of two ternary complexes, nNOS-NHA-CO and nNOS-NHA-NO, together with single crystal absorption spectra. The structure of nNOS-NHA-NO, a close mimic of nNOS-NHA-O2, provides mechanistic insight into the second step of the NOS enzymatic reaction where the intermediate, L-NHA, is converted to the final products, NO and citrulline.
EXPERIMENTAL PROCEDURES
Protein and crystal preparations
The nNOS heme domain protein used for structural studies was generated from a limited trypsin digest of the full length nNOS as described (15). Crystals of the nNOS heme domain were grown following the conditions reported previously (15). To make crystals of the nNOS-NHA complex 5 mM of L-NHA was added to the protein sample (9.0 mg/ml or 186 μM, 53-fold excess of L-NHA over the protein) prior to the crystallization setup. During the NO (CO) soaks of crystals 1-3 mM L-NHA had also been included in the cryo-protectant solution (13) to prevent the loss of substrate.
Both CO- and NO-complexes of nNOS-NHA crystals were prepared anaerobically. The cryo-protectant solution in a serum vial was degassed by repeating the following procedure twice; bubbling with argon gas through one needle and venting through another for 30 min and then evacuating for a few minutes to remove bubbles from solution. All the following crystal treatments were carried out with this degassed cryo-solution inside a glovebox. A serum vial with 400 μl of degassed cryo-solution (3 mM L-NHA, 10 mM dithionite) was sealed with a rubber septum, brought outside the glovebox in a fume hood, and bubbled with CO for 30 min through a needle and venting with a second needle. Crystals were reduced in the glovebox with 10 mM dithionite and then transferred to the vial containing the CO-saturated cryo-solution. The vial was resealed and brought outside the glovebox, purged in the headspace with CO at a pressure of 10 psi for 10 min with venting, then another 3 min without venting to build up the CO pressure within the vial. Crystals in the CO-saturated cryo-solution in this sealed vial were left at 4° C overnight before being flash-cooled the next day with liquid nitrogen. Crystals treated with CO but without prolonged incubation were found to have poor CO binding.
The NO-saturated cryo-solution was made by purging for 1 min at 10 psi in the headspace of a sealed serum vial containing 800 μl of degassed cryo-protectant solution. The transfer line from the NO tank was flushed with ultra-pure N2 gas prior to NO transfer. The NO gas also passed through two NaOH traps to remove any oxidation contaminants. Inside the glovebox, nNOS crystals were first reduced with 10 mM dithionite and then passed through dithionite-free cryo-solution before being transferred to the NO-saturated cryo-solution. The NO treated crystals (batch 1) were flash cooled as soon as possible within a few minutes outside the glovebox. However, removing excess dithionite from the cryo-solution prior to NO soaks was found to lead to partial heme oxidation (see Results). Another batch of crystals (batch 2) was prepared by the same procedure except that all cryo-solutions contained 10 mM dithionite, including the NO soaks.
Solution UV-visible absorption spectrophotometry
The UV-visible absorption spectra were measured with a CARY 3E spectrophotometer (Varian) at room temperature. A 100 mM Tris buffer, pH 7.8, with 100 mM NaCl, was used for the spectral measurements. The spectral changes of nNOS heme domain upon reduction and binding with CO could be monitored under normal aerobic conditions. However, to avoid the rapid oxidation of NO all the spectral measurements involving NO had to be done under anaerobic conditions with degassed buffer using septum sealed cuvettes prepared inside a glovebox.
Microspectrophotometric measurements
In-situ single crystal UV-visible absorption measurements were made with a modified 4DX microspectrophotometer (www.4dx.se; (16)) attached to a custom made frame installed at beamline 7-1 or 1-5 at SSRL. A deuterium-halogen light source (model DH-2000-BAL, Ocean Optics Inc., www.oceanoptics.com) with output from 215 nm to 2000 nm, was used for illumination of the sample. Light was delivered to the focusing objective using a 50 micron fiber optic cable, resulting in a ~20 micron focus at the sample position. The collecting objective utilized a 450 micron diameter fiber optic cable for transmitting light to the detector. A scientific grade spectrometer (model QE65000, Ocean Optics Inc.) under PC computer control was used to record the absorption spectra. Single crystals 100 - 200 microns in size were found to be optimal for the absorption experiments.
The spectral features obtained from single crystals can be quite different from those in the isotropic solution spectra due to the spatial orientation of the chromophore inside the unit cell and its relationship to the rotating phi axis (17). Nevertheless, orientations for the nNOS crystals could be found in most cases where the spectra largely resembled the solution spectra. These optimal orientations were found by rotating the crystals on the goniometer phi axis. In rare cases the chromophore direction coincides with the phi rotation axis and the spectrum has less features. A baseline spectrum was measured before exposing samples to X-rays. Subsequent measurements were made in the same orientation and at regular intervals during X-ray data collection.
X-ray diffraction data collection, processing and crystal structure refinements
Cryogenic (100 K) X-ray diffraction data were collected at SSRL BL1-5 and BL7-1. Data sets were comprised of 100 degrees of data using 0.5-degree oscillation and 30 and 15 s exposure times per frame on BL1-5 and BL7-1, respectively. Raw data frames were processed with XDS (18). The integrated and scaled reflections were converted to MTZ format in CCP4 suite (19). The structure refinements were carried out with REFMAC (20) in a restrained refinement with TLS (21) protocol. Only two TLS rigid groups, one per chain, were used in the refinement. The final round of refinement was done with PHENIX (22). Model building was performed in either Coot (23) or O (24). The Fe-XO distances and Fe-X-O angles were determined by best fitting to the electron densities with the bond distance and angular restraints in place during refinement. CNS (25) composite omit maps and CCP4 Fo-Fc omit maps were calculated to avoid model bias and to validate the electron density in the active sites. Crystal structures were checked by the Quality Control Check version 2.5 developed by JCSG (http://smb.slac.stanford.edu/jcsg/QC/). The X-ray diffraction data collection and structure refinement statistics are shown in Table 1. The coordinates of the three structures have been deposited with RCSB protein data bank and accession codes are listed in Table 1.
Table 1.
Data collection and refinement statistics
| Data set 1 | nNOS-NHA-CO | nNOS-NHA-NO Batch 1 | nNOS-NHA-NO Batch 2 |
|---|---|---|---|
| PDB code | 3HSN | 3HSO | 3HSP |
| Cell dimensions(Å) (SG: P212121) | a = 52.16 | a = 51.83 | a = 51.82 |
| b = 110.85 | b = 110.44 | b = 110.56 | |
| c = 165.04 | c = 164.64 | c = 164.53 | |
| Data resolution (Å) | 1.91 (2.02-1.91) | 2.02 (2.14-2.02) | 2.20 (2.33-2.20) |
| SSRL beamline | BL1-5 | BL1-5 | BL7-1 |
| Total observations | 255598 | 196444 | 219127 |
| Unique reflections | 73350 | 59511 | 48552 |
| Wilson B factor | 32.4 | 35.6 | 36.1 |
| Rsym 2 | 0.064 (0.496)3 | 0.037 (0.256)3 | 0.085 (0.505)3 |
| <I/σ> | 12.7 (2.1)3 | 21.4 (3.4)3 | 16.9 (3.5)3 |
| Completeness (%) | 97.0 (91.8)3 | 94.2 (91.0)3 | 98.9 (97.6)3 |
| Reflection used in refinement | 73249 | 59468 | 48536 |
| R factor4 | 0.167 | 0.172 | 0.164 |
| R-free5 | 0.210 | 0.224 | 0.217 |
| Total No. atoms | 7559 | 7381 | 7333 |
| No. water molecules | 540 | 441 | 391 |
| RMS deviation bond length(Å) | 0.011 | 0.015 | 0.011 |
| bond angle (°) | 1.3 | 1.4 | 1.4 |
nNOS-NHA-CO, frames 1-200 (30 sec/frame); nNOS-NHA-NO, batch 1, frames 30-200 (30 sec/frame); nNOS-NHA-NO, batch 2, data set 2, frames 1-120 (15 sec/frame), the first 200 frames of data set 1 collected with the crystal were not used in the structure determination.
Rsym = Σ |I - <I> | /Σ I, where I is the observed intensity of a reflection and <I> the averaged intensity of multiple observations of the reflection and its symmetry mates.
The values in parentheses were obtained in the outermost resolution shell.
R factor = Σ∥Fo|-|Fc∥ / Σ|Fo|, Fo and Fc are the observed and calculated structure factors, respectively.
Throughout the refinement R-free was calculated with the 5% of reflections set aside randomly.
RESULTS AND DISCUSSON
Absorption spectral features of the nNOS-NHA-ligand complex in solution
As shown in Fig. 1A the L-NHA bound nNOS heme domain protein in Tris buffer (pH 7.8) exhibits a Soret band at 396 nm indicative of a high-spin state of the heme iron. Once reduced with dithionite, the Soret band shifts to 408 nm and then to 444 nm after the sample is bubbled with CO.
Fig. 1.
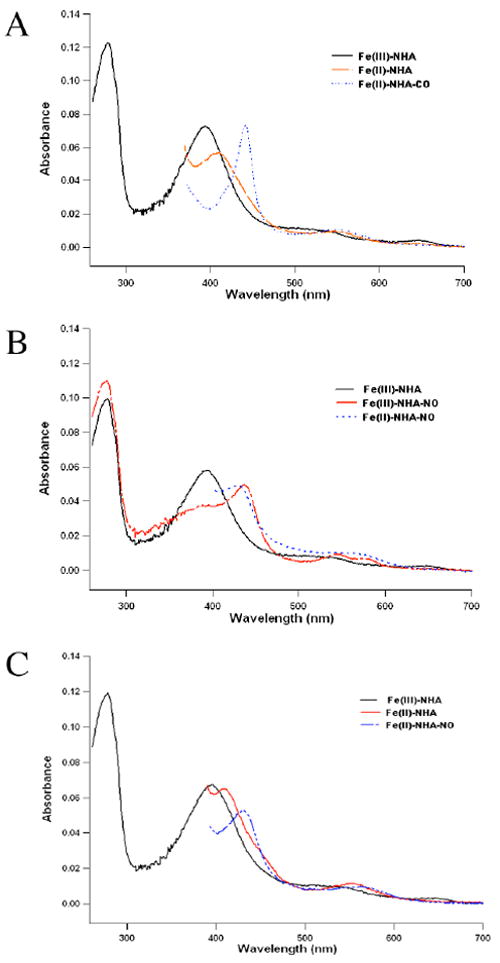
The solution UV-visible absorption spectra of (A) nNOS heme domain with L-NHA bound (black line), reduced with dithionite (red), and then bubbled with CO (blue); (B) nNOS heme domain in complex with L-NHA (black), NO bound to ferric iron (red) and reduced with dithionite to form Fe2+-NO (blue); (C) nNOS/NHA complex (black) was first reduced with dithionite (red) and then bound to NO to form Fe2+-NO (blue).
Nitric oxide (NO) is known to interact with both ferric and ferrous heme showing distinct absorption spectral features. When the nNOS heme domain is directly exposed to NO saturated buffer, the Soret peak is at 437 nm with well resolved β and α bands at 546 and 578 nm, respectively (Fig. 1B). Reduction with dithionite produces a Fe2+-NO complex with a Soret peak slightly blue-shifted to 433 nm, and the α and β bands merged into one peak at 568 nm. The Fe2+-NO complex can also be generated by first reducing the heme to the ferrous state with dithionite (Soret peak at 413 nm) and then exposing the heme to NO (Fig. 1C). The spectral features of both Fe3+-NO and Fe2+-NO shown here are in agreement with those reported in the literature (26).
Spectroscopy of the nNOS crystals with L-NHA and CO bound
We have found that the Soret band is unreliable partly due to the very high extinction coefficient. As a result, analyses of single crystal spectra are confined to the α and β bands. The absorption spectra of single crystals have been monitored at different data collection time points shown in Fig. 2. Spectral features of the crystal prior to X-ray exposure are predominately of the CO-bound complex with a single visible peak at 555 nm, which is agreeable with the spectra taken with the same protein in solution (Fig. 1A). During data collection the 555nm band remains essentially unchanged and only after an hour does the intensity of this band decrease. Therefore, the CO-bound form is the dominant species over the course of data collection.
Fig. 2.
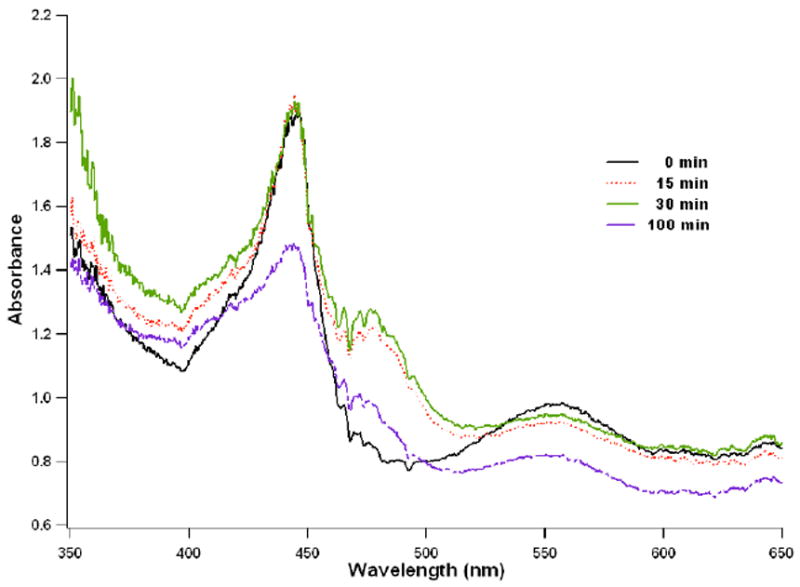
The single crystal absorption spectra taken at various time points during X-ray diffraction data collection of an nNOS-NHA-CO complex crystal. The visible band at 555 nm remained unchanged until toward the end of data collection (100 min). Figures 2 and 3 were prepared with program Igor Pro.
Spectroscopy of the nNOS crystals with L-NHA and NO bound
A batch 1 crystal showed β and α band at 545 and 568 nm, respectively, before exposure to X-rays (Fig. 3A) which is very similar to spectral features for the oxidized Fe3+-NO species in solution (Fig. 1B). These spectral features indicate that although we intended to prepare crystals in a reduced Fe2+-NO complex the crystal apparently contains predominantly the ferric form. It is possible that removing free dithionite from the cryo-solution did not maintain full reduction of heme during the final stage of NO soaking. Interestingly, the split peaks merge into one broad band at 560nm soon after the exposure of the crystal to X-rays indicative of radiation induced heme reduction. After 15 min (30 frames) of data collection the Fe2+-NO is the dominant species owing to reduction of the iron in the X-ray beam.
Fig. 3.
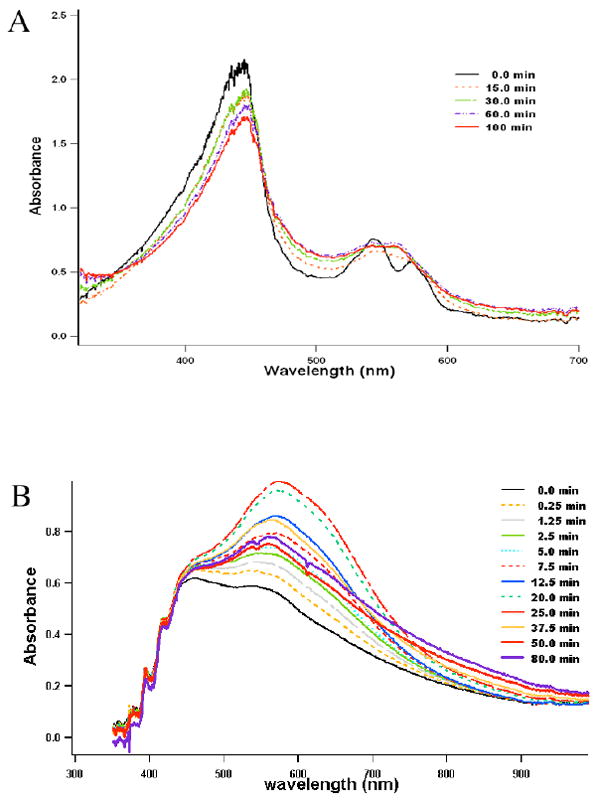
The single crystal absorption spectra taken at various time points during X-ray diffraction data collections with nNOS-NHA-NO complex crystals, (A) A batch 1 crystal at BL1-5. At the beginning of data collection the visible region showed two split bands at 545 and 568 nm. However, the two peaks merged in a broad band after 15 min of X-ray data collection. The band maximum was at ~560 nm after 30 min until the end of data collection (100 min). (B) A batch 2 crystal at BL7-1. Two data sets of 200 and 120 frames (15 sec/frame) were collected with this crystal. The 535 nm band shifted to 574 nm with a pronounced shoulder around 640 nm during the first 100 frames of the first data set, finally settling at 569 nm toward the end of data set (200 frames) and remained unchanged during the second set of data collection (120 frames).
To overcome the problem of heme oxidation, the second batch of crystals were treated with 10 mM dithionite up to the final stage of NO soaks. The spectra taken from the batch 2 crystal showed a single visible band at 570 nm without splitting (Fig. 3B). However, a proper crystal orientation could not be found where the single crystal spectra resembled the solution spectra. In addition, upon X-ray exposure the visible band displayed a strong shoulder in the >600 nm region, which disappeared toward the end of data collection (50 min). Another 120 frames (30 min) of data were collected in order to catch the nNOS-NHA-NO ternary complex which was in a state free of the >600 nm absorption as evidenced by the last two spectral scans before and after this second data collection set (Fig. 3B). The origin of this >600 nm absorption is not clear, but it seems to resemble features reported for solvated electrons induced by X-rays which absorbs at 676 nm (14). Crystals from the same batch had typical and better UV-VIS spectra with a single peak at 570 nm, but had worse diffracting properties and were not used.
Structure of the nNOS-NHA-CO ternary complex
The ternary structure of nNOS with L-NHA and CO bound closely resembles that of the nNOS-Arg-CO complex previously reported (13). The density for CO is intact and continuous from ligand to heme (Fig. 4) indicating a linear binding mode to the heme iron with a Fe-C-O bending angle of ~170° and Fe-CO bond length of 1.7 Å (Table 2). Preparing CO complex crystals has presented challenges, often resulting in partial occupancy or no ligand binding. The overnight incubation of crystals with a CO saturated cryo-solution overcomes the problem as indicated by solid CO-bound spectral features taken from the crystals (Fig. 2) prior to and during data collection. The CO binding geometry derived from the current CO-complex 1.91 Å resolution data with full occupancy, but higher B-factors compared to the corresponding Fe atom also lends support to the CO binding models previously assigned to nNOS-Arg-CO and eNOS-Arg-CO complex structures (13), where the densities were somewhat ambiguous due to incomplete ligand binding.
Fig. 4.
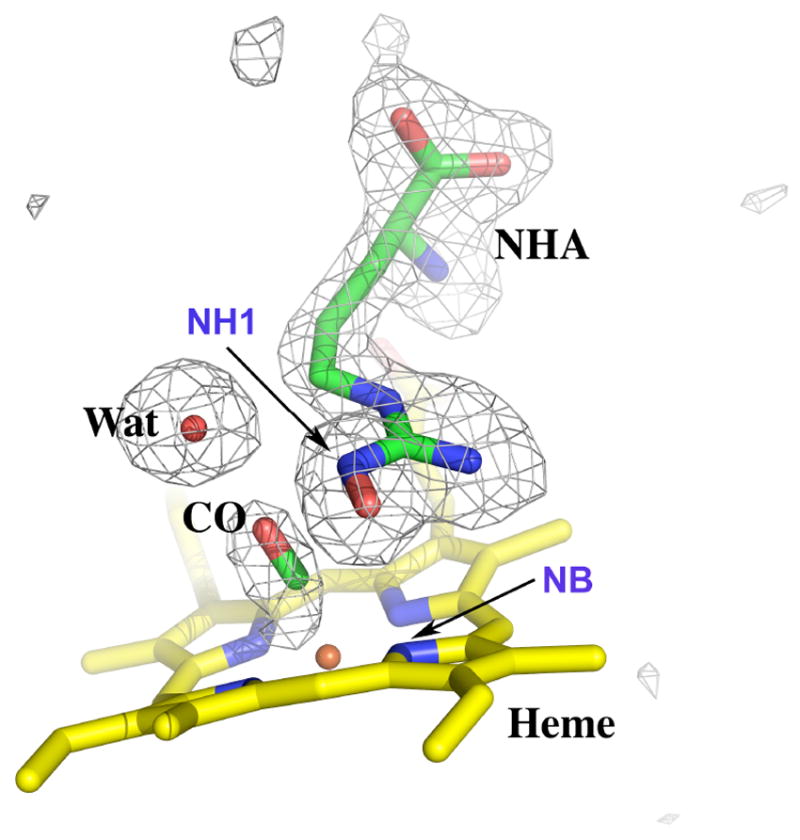
Active site structure of nNOS-NHA-CO ternary complex. The Fo-Fc omit map is plotted at 3.0 σ contour level. Atoms that are relevant to the interatomic distances in Table 2 are labeled. Figures 4 - 6 were prepared with PyMol (http://pymol.sourceforge.net/).
Table 2.
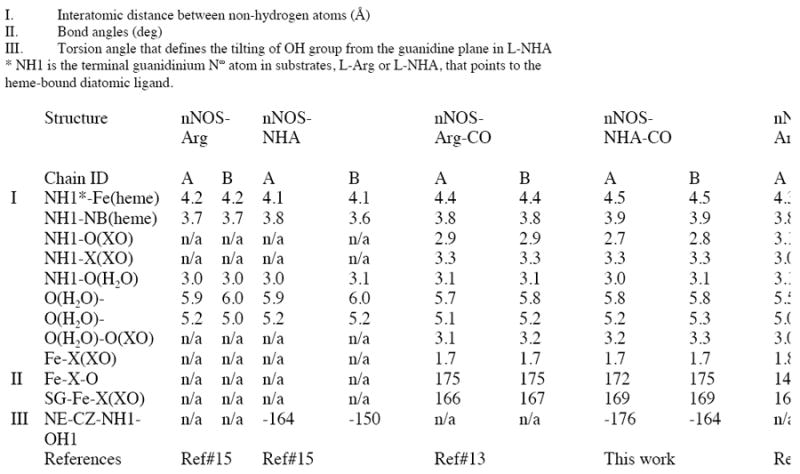
Geometries, interatomic distances, bond angles, and torsion angles, of the nNOS active site
|
The NH1 atom of substrate, L-NHA, moves by ~0.5 Å from the position found in the nNOS-NHA structure (15) in response to CO binding. The direction of motion is farther from the heme and away from the CO ligand which is similar to what was found in the nNOS-Arg-CO complex where L-Arg was also displaced from the heme (13). Such substrate re-positioning upon diatomic ligand binding is apparent by comparing the changes in the distance from the NH1 of the substrate to the heme iron, or that in the shortest distance between the two molecules, NH1 of substrate and NB of heme (Fig. 4, Table 2). The OH-bearing guanidine nitrogen, Nω (i.e. NH1), possesses some sp3 hybridization character owing to its protonation (27). The OH group thus deviates from the guanidine plane by about 4 - 16 degrees (Table 2). The hydrogen bonding network involving substrate, CO, and an ordered water molecule described in nNOS-Arg-CO complex (13) still exists in this structure (Fig. 4).
Structure of the nNOS-NHA-NO ternary complex
Although not relevant to the main theme of this paper, we note changes in the Zn2+-tetrathiolate center. In all NOS isoforms a single Zn2+ ion is coordinated by 2 pairs of symmetry related Cys residues near the bottom of the dimer interface. The electron density maps show that treatment with NO results in a 30 - 50% decrease in Zn2+ occupancy and partial disordering of the Cys-containing loops. The thiolate ligands are known to be susceptible to S-nitrosation when iNOS is treated with NO-donors and there also appears to be some S-nitrosation in vivo (28). It thus seems likely that the large excess of NO used in our studies has resulted in at least some S-nitrosation of one or more Zn2+ ligands resulting in the observed disordering of the Zn2+ region.
With the guidance of single crystal absorption spectra we have chosen the data that only represent Fe2+-NO as the dominant species. For the batch 1 crystal only data frames 30-200 were processed in order to minimize the contribution from the Fe3+-NO species in the early stage of data collection. For the batch 2 crystal, the second data set was used which showed clean Fe2+-NO spectral features with a single visible band at 570 nm without the shoulder at >600 nm. Both data sets provide essentially identical models for the ternary complex with the Fe-NO distance and Fe-N-O bending angle of 1.8 Å and 140 - 150°, respectively (Fig. 5, Table 2). The diatomic ligand bends away from the substrate toward the pyrrole ring D of heme (Fig. 5). This NO bending direction is consistent in both monomers in the two refined structures. In contrast, the NO in nNOS-Arg-NO structure bends toward slightly different directions in the two monomers (13).
Fig. 5.
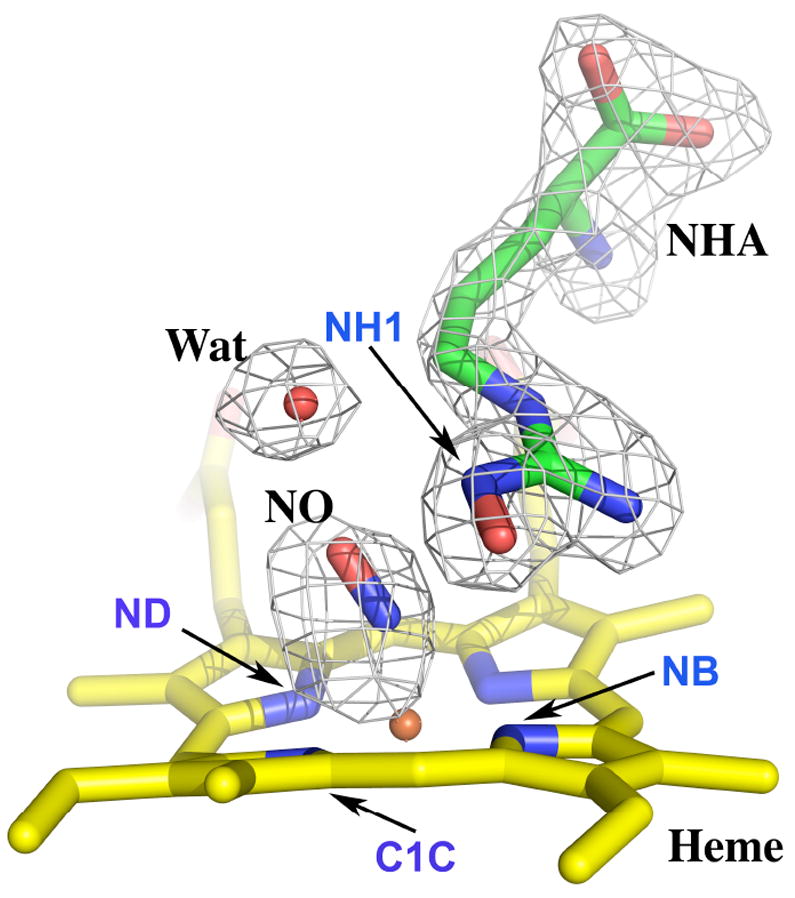
Active site structure of nNOS-NHA-NO ternary complex with Fo-Fc omit map shown at 5.0 σ contour level. Atoms that are relevant to the interatomic distances in Table 2 are labeled.
Compared to the nNOS-NHA structure, the L-NHA guanidine position in the NO-complex moves away from the heme by 0.4 - 0.5 Å, when the heme groups in the two structures are superimposed. This results from the steric repulsion between the heme bound ligand and the substrate. Some variations on how much the OH group is tilted from the guanidine plane, from as small as 5° to as large as 13° (Table 2), are observed in the two nNOS-NHA-NO structures, which is less distorted than that seen in nNOS-NHA where a 15 - 30° tilting was observed (15). The active site water in the structure remains at about the same location when comparing its position seen in nNOS-NHA-NO and nNOS-Arg-NO structures (distance from the O atom of water to the C1C atom of heme in Table 2 and Fig. 5). This is in contrast to what was observed for the bsNOS-NHA-NO structure (29) where the water location was moved away from NO compared to the bsNOS-Arg-NO structure.
The hydrogen bonding network involving L-NHA, NO and the active site water in this structure is similar to what was observed in the nNOS-Arg-NO structure (13) as far as the interatomic distances are concerned (Table 2). However, an important difference between the two substrates, L-Arg vs. L-NHA, is the chemical nature of their terminal guanidinium Nω nitrogen atoms. The sp3 character of Nω in the NH-OH moiety of L-NHA will bring its hydrogen toward the heme-bound NO. This geometry favors a hydrogen bonding interaction from L-NHA to the N atom of NO and presumably the iron-linked O atom of the O2 diatomic ligand. The distance from the hydrogen to the proximal N atom of NO is actually closer than that to the distal O atom (Fig. 6). A similar feature was noted in the bsNOS-NHA-NO structure (29). This difference between L-NHA and L-Arg may also alter how the active site water interacts with each substrate. In the L-Arg complex the active site water serves as a hydrogen bond donor to the NO ligand but a hydrogen bond acceptor from NH1 (Nω) atom of L-Arg. However, in the L-NHA complex the lone-pair of the Nω atom is pointing toward the water which may cause a “flip” of the water orientation so that the water now acts as a hydrogen bond donor to the L-NHA rather than to NO (Fig. 6). These differences have mechanistic implications that are discussed in the next section.
Fig. 6.
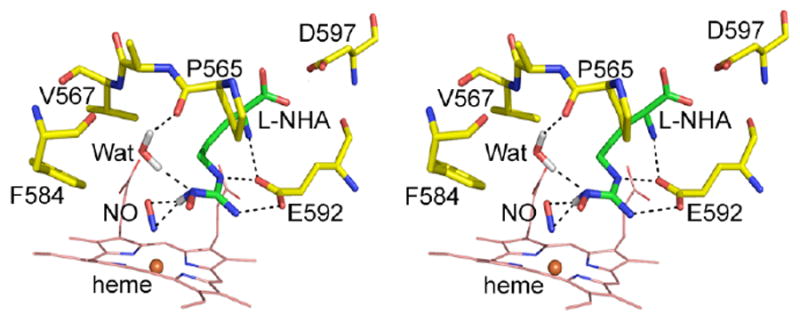
Stereo view of the nNOS hydrogen bonding network (dashed lines) involving the substrate, the diatomic ligand NO and the active site water that serves as a model for the activation of the O2 complex. The hydrogen atoms of the NωH group of L-NHA and water are highlighted in grey illustrating the H-bonding geometry central to the heme-bound dioxygen activation in the second half reaction of NO generation. The location of hydrogen atoms are inferred since these are not directly observed in the electron density maps.
Mechanistic implications
There is general consensus that the first step of NO synthesis in NOS is the hydroxylation of the terminal guanidinium nitrogen of L-Arg following a P450-like monooxygenation reaction mechanism. However, the second step of the reaction mechanism, L-NHA to NO and citrulline, does not have an existing, analogous enzymatic system for comparison. It has been widely accepted that unlike the first step where L-Arg is oxidized to L-NHA, the heme-bound dioxygen does not undergo a heterolytic cleavage of the O-O bond in the oxidation of L-NHA. Before there was any indication that H4B was directly involved, early views favored H atom abstraction from the NH-OH oxygen in L-NHA as the electron source giving an O radical (30-32). ENDOR spectroscopic studies of the L-NHA complex of nNOS indicated that the OH-bearing guanidine Nω atom is close to the heme-bound dioxygen (33). Density functional theory (DFT) calculations proposed that the Nω atom of L-NHA is protonated when bound to NOS (27). Thus, the hydrogen abstraction to dioxygen from NH-OH results in a L-NHA N-radical intermediate (Fig. 7A) rather than an O-radical if hydrogen is abstracted from the OH group. This scenario was supported by the crystal structure of iNOS-NHA complex where the OH-group of L-NHA was found to be too far from the heme iron for hydrogen abstraction (34). A few lines of additional experimental evidences lent support to the N-radical mechanism. Two L-NHA analogues, N-tert-butyloxy-L-arginine and N-(3-methyl-2-butenyl)oxy-L-arginine, were shown to be substrates for NO production, even though both compounds have their OH hydrogen replaced by other substituents (35). Moreover, N-alkyl-N’-hydroxyguanidine compounds were found to be NOS substrates (36, 37). The crystal structure of one of these substrates, N-isopropyl-N’-hydroxyguanidine, revealed an unexpected binding mode in the nNOS active site where the guanidine moiety rotated 120° so that the OH-group was farther away from the heme iron than that in most of the other hydroxyguanidines (15). If L-NHA oxidation proceeds via an H atom abstraction mechanism then the source of the H atom must be the Nω-H Hydrogen atom and not the OH hydrogen atom.
Fig. 7.
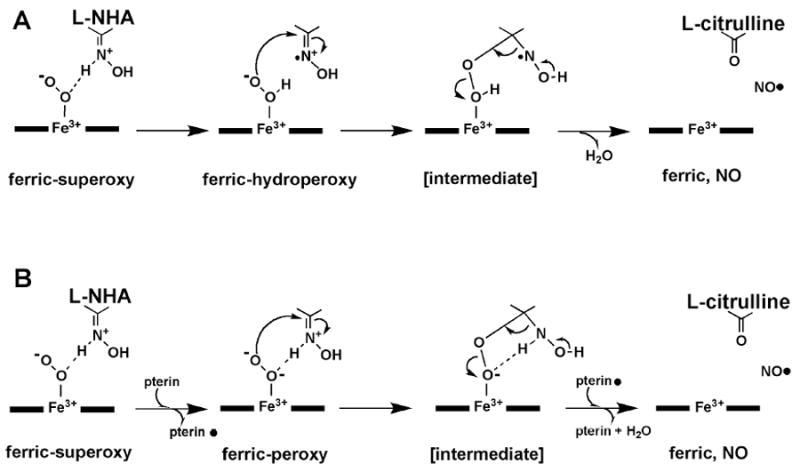
Mechanisms for the oxidation of L-NHA to NO and L-citrulline. (A) The hydrogen atom extraction from L-NHA is the source of electron in the activation of the heme-bound dioxygen (35). (B) The electron required to activate the heme dioxygen complex is derived from the pterin cofactor (38, 40). The pterin radical is re-reduced before the final release of NO.
More recently H4B has been implicated as the source of electron in the second step of the reaction (38). Although a pterin-free NOS can still catalyze the oxidation of arginine to form citrulline, the end product is nitroxide, NO-, instead of NO (39). Also, the oxidation of NADPH and the formation of citrulline are largely uncoupled in a pterin-free system. Therefore, H4B was proposed to be a kinetically competent electron donor to reduce the ferric-superoxy to a peroxy species (Fig. 7B), thus preventing uncoupling. Furthermore, the pterin radical left behind was later reduced by the electron back donation from the transient intermediate formed between the ferric-peroxy and L-NHA, ensuring the release of NO (38).
Regardless of the source of the second electron, the close proximity of heme bound dioxygen and the OH bearing NH group of L-NHA is a crucial feature relevant to another unanswered fundamental question; why does the O-O bond heterolysis not occur in the oxidation of L-NHA. Our present work and structures of other L-NHA-NOS complexes (29) as well as recent resonance Raman data (40, 41) provide important insights into this puzzle.
By comparing crystal structures of bsNOS-Arg-NO and bsNOS-NHA-NO, Pant and Crane (29) proposed two different dioxygen activation schemes for NOS reactions. In the first step, the water-guanidinium (L-Arg) H-bonding network directs protons to the distal O atom of Fe3+-O-O2- species promoting heterolytic O-O bond cleavage to form the active oxy ferryl species, Fe4+-O. In the second step, L-NHA forms a stronger hydrogen bond to the proximal oxygen atom of the ferric-superoxy species, Fe3+-O-O-, thus preventing O-O cleavage and leading to a ferric-hydroperoxy species, Fe3+-O-OH-. Resonance Raman data provide evidence that L-Arg and L-NHA indeed exert different types of interactions with the heme-bound dioxygen. In both murine iNOS (40) and saNOS from Staphylococcus aureus (41), the binding of L-Arg causes a frequency shift of νo-o but not a νFe-o frequency shift. For saNOS, the binding of L-NHA induces a νFe-o frequency shift but not νo-o. The interpretation of these data is that L-Arg and/or the active site water protonates the distal oxygen therefore influencing only the O-O stretching frequency. In contrast, L-NHA can hydrogen bond to the proximal oxygen thus affecting the Fe-O bond strength. Based on these data a mechanism for the second step as shown in Fig. 7B was proposed (40).
Our present work is consistent with the proposed mechanism emphasizing the different chemical nature of the two NOS substrates, L-Arg vs. L-NHA. When the structures of nNOS-NHA-NO and nNOS-Arg-NO are compared, the general arrangement of the hydrogen bonding network, involving the substrate, diatomic ligand, and the active site water, is retained. When the substrate changes from L-Arg to L-NHA the interatomic distances between non-hydrogen atoms in this network, as shown in Table 2, do not vary significantly (within 0.2 - 0.3 Å). Therefore, as we have discussed previously (13), it is the chemistry of the substrate and its relevant geometry, rather than the interatomic distances, that plays an important role in controlling the interaction with the heme-bound dioxygen. The reason why L-NHA makes a tighter hydrogen bond with the proximal O atom of the heme-bound dioxygen stems from the chemical nature of the Nω atom in the NH-OH moiety. DFT calculations (27) indicate that in the protein bound L-NHA this Nω atom is protonated and its positive charge is no longer delocalized in the guanidinium plane. Thus the Nω atom bears a significant sp3 hybridization character. The tilting of the OH group from the guanidinium plane in the NOS-NHA complex structures (15, 34) supports this view. The hydrogen from this Nω atom (sp3 geometry) of L-NHA is significantly tilted from the guanidinium plane, pointing directly towards the heme-bound dioxygen as illustrated in Fig. 6. This is in contrast to the situation with L-Arg where the Nω hydrogen atom (sp2 geometry) makes a hydrogen bond to the water rather than to the dioxygen, owing to a poor hydrogen bonding geometry to the distal oxygen of the ligand.
In this case, the water is in a better position to donate a proton to the distal oxygen of Fe3+-O-O2- species (13). However, the water in the second step may no longer hydrogen bond to the dioxygen owing to its altered orientation induced by the different chemical nature of the Nω atom in L-NHA (Fig. 6).
The structure of the ternary nNOS-NHA-NO complex provides insight into the reaction mechanism of NOS. In short, it is the terminal NωH group from L-Arg or L-NHA, each exhibiting distinct chemical properties and thus different geometries, which controls how the heme-bound dioxygen proceeds along different activation routes for the two steps in the reaction mechanism of NOS. The structures presented here and elsewhere together with spectroscopic and computational results can not distinguish between the substrate radical (Fig. 7A) vs. pterin radical (Fig. 7B) mechanisms. However, it is clear that L-NHA is protonated when bound to NOS and that strong hydrogen bonding between L-NHA and the proximal iron-linked O atom prevents heterolysis, favoring the peroxy intermediate as the oxidant of L-NHA.
Acknowledgments
Portions of this research were carried out at the Stanford Synchrotron Radiation Lightsource, a national user facility operated by Stanford University on behalf of U.S. Department of Energy, Office of Basic Energy Sciences. The SSRL Structural Molecular Biology Program is supported by the Department of Energy, Office of Biological and Environmental Research, and by the National Institute of Health, National Cancer for Research Resources, Biomedical Technology Program, and the National Institute of General Medical Sciences. HL thanks Kelvin Nguyen for his excellent technical assistance.
This work was supported by NIH grants GM57353 (TLP)
Abbreviations
- NO
nitric oxide
- nNOS
neuronal nitric oxide synthase
- iNOS
inducible nitric oxide synthase
- eNOS
endothelial nitric oxide synthase
- CaM
calmodulin
- H4B
5,6,7,8-tetrahydrobiopterin
- L-Arg
L-arginine
- L-NHA
Nω-hydroxy-L-arginine
Footnotes
The PDB accession codes are 3HSN, 3HSO, and 3HSP for the structures of nNOS-NHA-CO, nNOS-NHA-NO batch1, and nNOS-NHA-NO batch2, respectively.
References
- 1.Moncada S, Palmer RM, Higgs EA. Nitric oxide: physiology, pathophysiology, and pharmacology. Pharmacol Rev. 1991;43:109–142. [PubMed] [Google Scholar]
- 2.Kerwin JF, Jr, Lancaster JR, Jr, Feldman PL. Nitric oxide: a new paradigm for second messengers. J Med Chem. 1995;38:4343–4362. doi: 10.1021/jm00022a001. [DOI] [PubMed] [Google Scholar]
- 3.Stuehr DJ, Griffith OW. Mammalian nitric oxide synthases. Adv Enzymol Relat Areas Mol Biol. 1992;65:287–346. doi: 10.1002/9780470123119.ch8. [DOI] [PubMed] [Google Scholar]
- 4.Raman CS, Martasek P, Masters BSS. Structural themes determining function in nitric oxide synthases. In: Kadish KM, Smith KM, Guilard R, editors. The porphyrin handbook. Acadamic Press; San Diego: 2000. pp. 293–339. [Google Scholar]
- 5.Murataliev MB, Feyereisen R, Walker FA. Electron transfer by diflavin reductases. Biochim Biophys Acta. 2004;1698:1–26. doi: 10.1016/j.bbapap.2003.10.003. [DOI] [PubMed] [Google Scholar]
- 6.Abu-Soud HM, Stuehr DJ. Nitric oxide synthases reveal a role for calmodulin in controlling electron transfer. Proc Natl Acad Sci U S A. 1993;90:10769–10772. doi: 10.1073/pnas.90.22.10769. [DOI] [PMC free article] [PubMed] [Google Scholar]
- 7.Matsuoka A, Stuehr DJ, Olson JS, Clark P, Ikeda-Saito M. L-arginine and calmodulin regulation of the heme iron reactivity in neuronal nitric oxide synthase. J Biol Chem. 1994;269:20335–20339. [PubMed] [Google Scholar]
- 8.Crane BR, Arvai AS, Ghosh DK, Wu C, Getzoff ED, Stuehr DJ, Tainer JA. Structure of nitric oxide synthase oxygenase dimer with pterin and substrate. Science. 1998;279:2121–2126. doi: 10.1126/science.279.5359.2121. [DOI] [PubMed] [Google Scholar]
- 9.Raman CS, Li H, Martasek P, Kral V, Masters BS, Poulos TL. Crystal structure of constitutive endothelial nitric oxide synthase: a paradigm for pterin function involving a novel metal center. Cell. 1998;95:939–950. doi: 10.1016/s0092-8674(00)81718-3. [DOI] [PubMed] [Google Scholar]
- 10.McMillan K, Bredt DS, Hirsch DJ, Snyder SH, Clark JE, Masters BS. Cloned, expressed rat cerebellar nitric oxide synthase contains stoichiometric amounts of heme, which binds carbon monoxide. Proc Natl Acad Sci U S A. 1992;89:11141–11145. doi: 10.1073/pnas.89.23.11141. [DOI] [PMC free article] [PubMed] [Google Scholar]
- 11.White KA, Marletta MA. Nitric oxide synthase is a cytochrome P-450 type hemoprotein. Biochemistry. 1992;31:6627–6631. doi: 10.1021/bi00144a001. [DOI] [PubMed] [Google Scholar]
- 12.Stuehr DJ, Ikeda-Saito M. Spectral characterization of brain and macrophage nitric oxide synthases. Cytochrome P-450-like hemeproteins that contain a flavin semiquinone radical. J Biol Chem. 1992;267:20547–20550. [PubMed] [Google Scholar]
- 13.Li H, Igarashi J, Jamal J, Yang W, Poulos TL. Structural studies of constitutive nitric oxide synthases with diatomic ligands bound. J Biol Inorg Chem. 2006;11:753–768. doi: 10.1007/s00775-006-0123-8. [DOI] [PubMed] [Google Scholar]
- 14.Beitlich T, Kuhnel K, Schulze-Briese C, Shoeman RL, Schlichting I. Cryoradiolytic reduction of crystalline heme proteins: analysis by UV-Vis spectroscopy and X-ray crystallography. J Synchrotron Radiat. 2007;14:11–23. doi: 10.1107/S0909049506049806. [DOI] [PubMed] [Google Scholar]
- 15.Li H, Shimizu H, Flinspach M, Jamal J, Yang W, Xian M, Cai T, Wen EZ, Jia Q, Wang PG, Poulos TL. The novel binding mode of N-alkyl-N’-hydroxyguanidine to neuronal nitric oxide synthase provides mechanistic insights into NO biosynthesis. Biochemistry. 2002;41:13868–13875. doi: 10.1021/bi020417c. [DOI] [PubMed] [Google Scholar]
- 16.Hadfield A, Hajdu J. A fast and portable microspectrophometer for protein crystallography. J Appl Cryst. 1993;26:839–842. [Google Scholar]
- 17.Pearson AR, Pahl R, Kovaleva EG, Davidson VL, Wilmot CM. Tracking X-ray-derived redox changes in crystals of a methylamine dehydrogenase/amicyanin complex using single-crystal UV/Vis microspectrophotometry. J Synchrotron Radiat. 2007;14:92–98. doi: 10.1107/S0909049506051259. [DOI] [PubMed] [Google Scholar]
- 18.Kabsch W. Automatic processing of rotation diffraction data from crystals of initially unknown symmetry and cell constants. J Appl Cryst. 1993;26:795–800. [Google Scholar]
- 19.Collaborative, Computational, Project, and Number4. The CCP4 Suite: Programs for Protein Crystallography. Acta Crystallogr. 1994;D50:760–763. doi: 10.1107/S0907444994003112. [DOI] [PubMed] [Google Scholar]
- 20.Murshudov GN, Vagin AA, Dodson EJ. Refinement of Macromolecular Structures by the Maximum-Likelihood Method. Acta Cryst. 1997;D53:240–255. doi: 10.1107/S0907444996012255. [DOI] [PubMed] [Google Scholar]
- 21.Winn MD, Isupov MN, Murshudov GN. Use of TLS parameters to model anisotropic displacements in macromolecular refinement. Acta Cryst. 2001;D57:122–133. doi: 10.1107/s0907444900014736. [DOI] [PubMed] [Google Scholar]
- 22.Adams PD, Grosse-Kunstleve RW, Hung LW, Ioerger TR, McCoy AJ, Moriarty NW, Read RJ, Sacchettini JC, Sauter NK, Terwilliger TC. PHENIX: building new software for automated crystallographic structure determination. Acta Cryst. 2002;D58:1948–1954. doi: 10.1107/s0907444902016657. [DOI] [PubMed] [Google Scholar]
- 23.Emsley P, Cowtan K. Coot: model-building tools for molecular graphics. Acta Cryst. 2004;D60:2126–2132. doi: 10.1107/S0907444904019158. [DOI] [PubMed] [Google Scholar]
- 24.Jones TA, Zou J-Y, Cowan SW, Kjeldgaarrd M. Improved methods for building models in electron density and the location of errors in these models. Acta crystallogr. 1991;A47:110–119. doi: 10.1107/s0108767390010224. [DOI] [PubMed] [Google Scholar]
- 25.Brunger AT, Adams PD, Clore GM, DeLano WL, Gros P, Grosse-Kunstleve RW, Jiang JS, Kuszewski J, Nilges M, Pannu NS, Read RJ, Rice LM, Simonson T, Warren GL. Crystallography & NMR System: A new software suite for macromolecular structure determination. Acta Crystallogr. 1998;D54:905–921. doi: 10.1107/s0907444998003254. [DOI] [PubMed] [Google Scholar]
- 26.Wang J, Rousseau DL, Abu-Soud HM, Stuehr DJ. Heme coordination of NO in NO synthase. Proc Natl Acad Sci U S A. 1994;91:10512–10516. doi: 10.1073/pnas.91.22.10512. [DOI] [PMC free article] [PubMed] [Google Scholar]
- 27.Tantillo DJ, Fukuto JM, Hoffman BM, Silverman RB, Houk KN. Theoretical studies on NG-hydroxy-L-arginine and derived radicals: Implications for the mechanism of nitric oxide synthase. J Am Chem Soc. 2000;122:536–537. [Google Scholar]
- 28.Mitchell DA, Erwin PA, Michel T, Marletta MA. S-Nitrosation and regulation of inducible nitric oxide synthase. Biochemistry. 2005;44:4636–4647. doi: 10.1021/bi0474463. [DOI] [PubMed] [Google Scholar]
- 29.Pant K, Crane BR. Nitrosyl-heme structures of Bacillus subtilis nitric oxide synthase have implications for understanding substrate oxidation. Biochemistry. 2006;45:2537–2544. doi: 10.1021/bi0518848. [DOI] [PubMed] [Google Scholar]
- 30.Marletta MA. Nitric oxide synthase structure and mechanism. J Biol Chem. 1993;268:12231–12234. [PubMed] [Google Scholar]
- 31.Korth HG, Sustmann R, Thater C, Butler AR, Ingold KU. On the mechanism of the nitric oxide synthase-catalyzed conversion of N omega-hydroxyl-L-arginine to citrulline and nitric oxide. J Biol Chem. 1994;269:17776–17779. [PubMed] [Google Scholar]
- 32.Griffith OW, Stuehr DJ. Nitric oxide synthases: properties and catalytic mechanism. Annu Rev Physiol. 1995;57:707–736. doi: 10.1146/annurev.ph.57.030195.003423. [DOI] [PubMed] [Google Scholar]
- 33.Tierney DL, Huang H, Martasek P, Masters BS, Silverman RB, Hoffman BM. ENDOR spectroscopic evidence for the position and structure of NG-hydroxy-L-arginine bound to holo-neuronal nitric oxide synthase. Biochemistry. 1999;38:3704–3710. doi: 10.1021/bi982904r. [DOI] [PubMed] [Google Scholar]
- 34.Crane BR, Arvai AS, Ghosh S, Getzoff ED, Stuehr DJ, Tainer JA. Structures of the N(omega)-hydroxy-L-arginine complex of inducible nitric oxide synthase oxygenase dimer with active and inactive pterins. Biochemistry. 2000;39:4608–4621. doi: 10.1021/bi992409a. [DOI] [PubMed] [Google Scholar]
- 35.Huang H, Hah JM, Silverman RB. Mechanism of nitric oxide synthase. Evidence that direct hydrogen atom abstraction from the O-H bond of NG-hydroxyarginine is not relevant to the mechanism. J Am Chem Soc. 2001;123:2674–2676. doi: 10.1021/ja005900u. [DOI] [PubMed] [Google Scholar]
- 36.Xian M, Fujiwara N, Wen Z, Cai T, Kazuma S, Janczuk AJ, Tang X, Telyatnikov VV, Zhang Y, Chen X, Miyamoto Y, Taniguchi N, Wang PG. Novel substrates for nitric oxide synthases. Bioorg Med Chem. 2002;10:3049–3055. doi: 10.1016/s0968-0896(02)00155-4. [DOI] [PubMed] [Google Scholar]
- 37.Renodon-Corniere A, Dijols S, Perollier C, Lefevre-Groboillot D, Boucher JL, Attias R, Sari MA, Stuehr D, Mansuy D. N-Aryl N’-hydroxyguanidines, a new class of NO-donors after selective oxidation by nitric oxide synthases: structure-activity relationship. J Med Chem. 2002;45:944–954. doi: 10.1021/jm011006h. [DOI] [PubMed] [Google Scholar]
- 38.Wei CC, Wang ZQ, Hemann C, Hille R, Stuehr DJ. A Tetrahydrobiopterin Radical Forms and then Becomes Reduced during N{omega}-Hydroxyarginine Oxidation by Nitric-oxide Synthase. J Biol Chem. 2003;278:46668–46673. doi: 10.1074/jbc.M307682200. [DOI] [PubMed] [Google Scholar]
- 39.Adak S, Wang Q, Stuehr DJ. Arginine conversion to nitroxide by tetrahydrobiopterin-free neuronal nitric-oxide synthase. Implications for mechanism. J Biol Chem. 2000;275:33554–33561. doi: 10.1074/jbc.M004337200. [DOI] [PubMed] [Google Scholar]
- 40.Li D, Kabir M, Stuehr DJ, Rousseau DL, Yeh SR. Substrate-and isoform-specific dioxygen complexes of nitric oxide synthase. J Am Chem Soc. 2007;129:6943–6951. doi: 10.1021/ja070683j. [DOI] [PubMed] [Google Scholar]
- 41.Chartier FJ, Couture M. Substrate-specific interactions with the heme-bound oxygen molecule of nitric-oxide synthase. J Biol Chem. 2007;282:20877–20886. doi: 10.1074/jbc.M701800200. [DOI] [PubMed] [Google Scholar]


