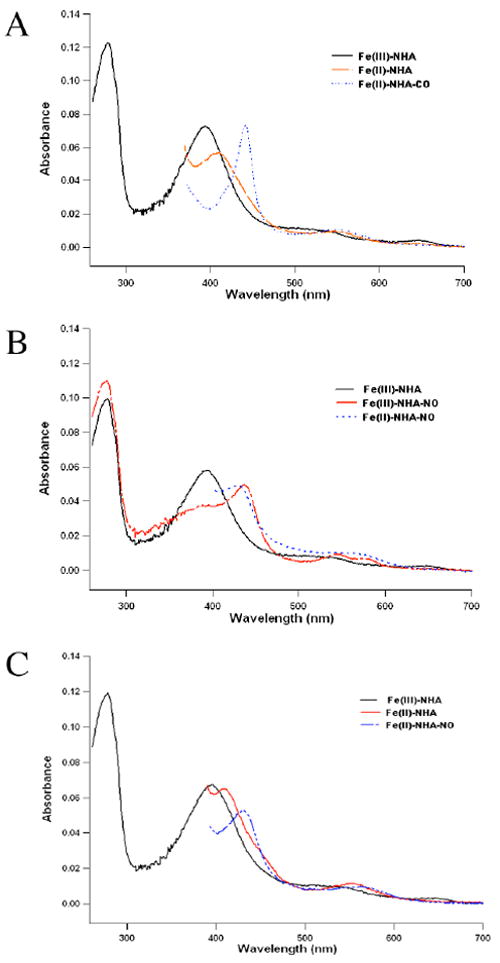
Fig. 1.

The solution UV-visible absorption spectra of (A) nNOS heme domain with L-NHA bound (black line), reduced with dithionite (red), and then bubbled with CO (blue); (B) nNOS heme domain in complex with L-NHA (black), NO bound to ferric iron (red) and reduced with dithionite to form Fe2+-NO (blue); (C) nNOS/NHA complex (black) was first reduced with dithionite (red) and then bound to NO to form Fe2+-NO (blue).
