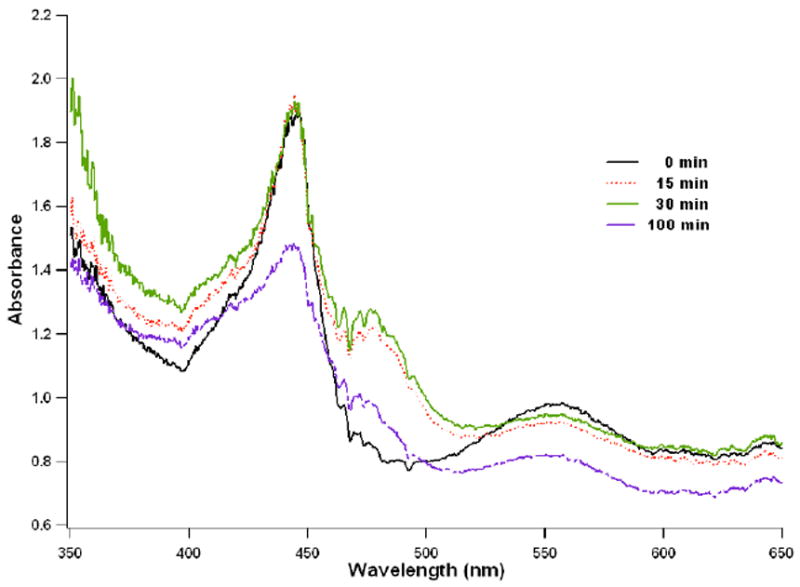
Fig. 2.

The single crystal absorption spectra taken at various time points during X-ray diffraction data collection of an nNOS-NHA-CO complex crystal. The visible band at 555 nm remained unchanged until toward the end of data collection (100 min). Figures 2 and 3 were prepared with program Igor Pro.
