

Abstract
Background
Risperidone is a second-generation antipsychotic agent widely used in the treatment of schizophrenia and other psychotic disorders in adults. Risperidone is probably the most frequently used atypical antipsychotic in the pediatric population.
Objectives
The goals of this study were to estimate the pharmacokinetic parameters of risperidone and its enantiomers in a pediatric population and explore relationships between saliva and plasma concentrations.
Methods
Eligible patients, between 4 and 15 years of age, included those taking a stable dose of oral risperidone ranging from 0.01 to 0.07 mg/kg BID for ≥4 weeks to treat psychiatric or neurodevelopmental conditions. A trough blood level and predose saliva sample were collected at study initiation; the regular risperidone dose was administered; and paired samples of blood and saliva were collected at 1, 2, 4, and 7 hours postdose. Plasma/saliva concentrations of risperidone and enantiomers of its principal active metabolite, 9-hydroxyrisperidone (9-OH-risperidone), were measured using a chiral liquid chromatography–tandem mass spectrometry assay. Standard pharmacokinetic parameters were calculated. Cytochrome P450 2D6 genotypes of *3,*4,*5 deletion and duplication were determined.
Results
The study included 19 patients (age range, 4 years 2 months to 15 years 11 months). Mean (SD) values for Cmax, t1/2, and AUC 0 to 12 hours for risperidone in plasma were 15.9 (22.2) ng/mL, 3.0 (2.3) h, and 92.1 (200.6) ng · h/mL, respectively. Corresponding values in saliva were 12.0 (21.0) ng/mL, 3.4 (3.2) h, and 27.8 (38.7) ng · h/mL, respectively. Mean (SD) plasma enantiomer values for Cmax and AUC calculated up to the last observation were: (+)-9-OH-risperidone, 13.6 (10.0) ng/mL and 73.6 (52.3) ng · h/mL; (−)-9-OH-risperidone, 4.9 (3.1) ng/mL and 29.3 (19.1) ng · h/mL. Corresponding enantiomer values in saliva were: (+)-9-OH-risperidone, 5.2 (8.8) ng/mL and 15.6 (8.9) ng · h/mL; (−)-9-OH-risperidone, 5.0 (7.9) ng/mL and 15.6 (9.1) ng · h/mL, respectively. Large interindividual variability in risperidone and enantiomer concentrations was noted. A highly significant relationship between predose plasma and predose saliva risperidone concentrations was observed. The logarithmic regression model indicated that the log risperidone saliva concentration = −0.100 + 0.594 · log plasma concentration (R2 = 0.93 [Spearman]).
Conclusions
In this preliminary pharmacokinetic study of parameters for risperidone and the enantiomers of 9-OH-risperidone in a pediatric population, mean C max and t1/2 of risperidone were generally similar to those previously described in adults. The highly significant relationship between predose plasma and predose saliva risperidone concentrations suggests that saliva measurements may be a viable alternative to plasma sampling in children.
Keywords: risperidone, children, pharmacokinetics, saliva, plasma, 9-hydroxyrisperidone enantiomers
INTRODUCTION
Risperidone is a second-generation antipsychotic agent widely used in the treatment of schizophrenia and other psychotic disorders in adults, and is preferred over older conventional agents for the management of adult and childhood psychiatric and neurologic conditions.1 Risperidone is probably the most frequently used atypical antipsychotic in the pediatric population.2–6 Controlled clinical trials of risperidone in children with autism and in those with disruptive behavior disorders have shown this medication to be very effective in managing disruptive behavior. 7–9 In 2006, the US Food and Drug Administration approved risperidone for managing behavioral difficulties associated with autism.10
In adult subjects, the metabolism of risperidone and its principal active metabolite, 9-hydroxyrisperidone (9-OH-risperidone), has been well described. Risperidone is rapidly and well absorbed after oral administration and has high bioavailability.11 Metabolism is catalyzed by the liver cytochrome P450 (CYP) system, particularly by CYP2D6 and CYP3A4. 9-OH-risperidone has a similar pharmacologic profile and potency as risperidone11; thus, both compounds together constitute the active moiety. After drug administration, mean Cmax values of risperidone and 9-OH-risperidone are reached at ~1 and 3 hours, respectively.12 For the active moiety, the elimination t1/2 is 20 hours.11 Steady-state concentrations are reached within 1 to 2 days for risperidone, and 5 to 6 days for 9-OH-risperidone. The metabolism of risperidone results in the formation of 2 enantiomers, (+)-9-OH-risperidone and (−)-9-OH-risperidone.13 The enantio-selective hydroxylation is catalyzed by CYP2D6 and CYP3A4, with the CYP3A4 pathway metabolizing at a slower formation rate.13 High interindividual variability in risperidone and 9-OH-risperidone metabolism has been observed.14
Several studies in adult patients with schizophrenia have investigated potential relationships between plasma levels of risperidone and 9-OH-risperidone and their clinical response and adverse effects.15–18 Although results have not been uniform, possible relationships have been identified between active moiety plasma levels and improvement in psychopathology,18 is and between plasma levels and the severity of extrapyramidal symptoms.17,19 Due to interindividual variability, strategic assessment of drug levels may be helpful in determining these relationships in individual patients to optimize treatment.18
We are unaware of any published controlled clinical data in the public domain regarding the pharmacokinetic parameters of risperidone in children. In the current study, we collected plasma samples from children already taking risperidone for a range of conditions, with the goal of gathering basic data to estimate pharmacokinetic parameters for risperidone and its enantiomers in a pediatric population. We also collected salivary samples, in tandem, to determine pharmacokinetic parameters in this sampling source. Salivary sampling may be better accepted for assessment of drug levels than plasma sampling, particularly for pediatric patients. Advantages of salivary measurement include noninvasiveness, sample collection by nonmedical staff, and the fact that such sampling is unlikely to cause distress in contexts in which mental or emotional function is being assessed.20–23 Specifically, we compared drug exposure, as determined by the AUC, the rate of decline in the concentrations of risperidone and its main active metabolite—9-OH-risperidone; (+) and (−) enantiomers—in plasma at timed intervals during a single dosing interval at steady state; determined the concentration ratio of risperidone and the (+)- and (−)-9-OH-risperidone enantiomers in plasma; and determined the strength of any relationship between saliva and plasma concentrations of risperidone and the 9-OH-risperidone enantiomers.
PATIENTS AND METHODS
This study was approved by The Ohio State University Biomedical Human Subjects Institutional Review Board. Subjects were enrolled between June 2001 and May 2003. Informed consent was obtained from the parent or guardian before beginning study procedures, and participant assent was obtained if the individual was free of mental retardation (some patients who had autistic disorder also had mental retardation).
Patients
Eligible patients were male or female, between 4 and 15 years of age, had been taking a stable dose of oral risperidone for ≥4 weeks before entering the trial, and were consuming risperidone BID. Any psychiatric or neurodevelopmental condition was permitted. Patients were healthy on the basis of a pretrial physical examination, medical history, and results of hematology tests. Children with significant medical conditions (eg, heart disease, hypertension, liver or renal failure, pulmonary disease, unstable seizure disorder) were excluded from the study. Disallowed medicines included anti–human immunodeficiency virus medications, azole antifungal medications, calcium channel antagonists, carbamazepine, cimetidine, macrolide antibiotics (erythromycin, clarithromycin), phenytoin, propoxyphene, rifampin, or tramadol.14,24 Females of childbearing potential were not permitted to participate in the study if they had a positive result on a urine pregnancy test. Children experiencing a transitory illness (eg, the common flu) were permitted but were not allowed to participate until the illness had passed.
Trial Design
The study involved 2 visits. Visit 1 consisted of completion of informed consent procedures, with subject assent obtained when possible (some young children and patients with autism were unable to understand the study procedures). A medical history, physical examination, and laboratory screening for kidney or liver disease were completed, and a urine pregnancy test was provided for female subjects of childbearing potential.
In most cases, visit 2 occurred ~1 week after visit 1. On the evening before the second visit, the parents were asked to give the child his or her second daily dose of risperidone at 8:00 pm. Subjects were asked not to eat breakfast on the day of the visit and to arrive at the study center early in the morning. A trough blood level and predose saliva sample were collected at the initiation of the study (~7:45 am), and the regular risperidone dose was administered at ~8:00 am, followed by a measured volume of water (100 mL). Paired samples of blood and saliva were subsequently collected at 9:00 am, 10:00 am, 12:00 pm, and 3:00 pm (ie, at 1, 2, 4, and 7 hours postdose). Given that the patients were at steady state of a BID regimen of risperidone, the 7:45 am trough sample can also be considered a 12-hour postdose sample because it followed the previous evening’s dose by 12 hours. Subjects were given breakfast after the second blood/saliva sample was collected (ie, after 9:00 am). Subjects were paid $20 for each blood/saliva sample obtained and $10 if only one type of sample was obtained.
Sample Collection
The Salivette™ system (Sarstedt, Inc., Newton, North Carolina) was used to collect saliva samples. This involved placing a cotton roll in the patient’s mouth for 3 minutes. Once removed, the cotton roll was immediately placed into a plastic cylinder, which was later centrifuged to extract most of the saliva. Because mucus is trapped by the Salivette roll, the saliva samples were essentially mucus free. Saliva samples were stored at −20°C or lower. An IV line was placed to collect blood samples. Blood samples were centrifuged, and plasma was stored at −20°C or lower. Heparinized saline was added to the IV line after each blood collection to avoid clotting. The IV line stayed in place for the duration of visit 2.
All samples were analyzed at Johnson & Johnson Pharmaceutical Research & Development, Beerse, Belgium.
Determination of Plasma and Saliva Concentrations of Risperidone and 9-Hydroxyrisperidone Enantiomers
Plasma concentrations of risperidone and the 9-OH-risperidone enantiomers were measured using a chiral liquid chromatography–tandem mass spectrometry (LC-MS/MS) assay described elsewhere.25,26 The assay method for the enantiomers has been described recently.26
Briefly, 2.0 mL of 0.1 M-phosphate buffer (pH 6), 100 μL of methanol, containing the stable isotopelabeled internal standards (R215639 and R215640; Janssen Research Foundation, Beerse, Belgium), and 100 μL of methanol were added to each 200-μL plasma sample. The mixture was vortexed and poured over a Varian Bond Elut Certify solid-phase extraction column (10 cc/130 mg SPE; Walnut Creek, California), which was eluted with 3 mL of a methanol/ammonium hydroxide 25% mixture (98:2 v/v). The eluate was evaporated under a nitrogen stream at 65°C and redissolved in 200 μL of heptane–0.01 M of ammonium acetate (50/50 v/v). Fifteen microliters were injected into a LC-MS/MS system, consisting of a Sciex API 3000 system (Applied Biosystems, Foster City, California) operated in multiple reaction monitoring mode. Enantiomeric separation of (+)- and (−)-9-OH-risperidone in plasma and saliva was achieved on a Chiracel OJ column (50 mm × 4.6 mm ID, 10-μm particle size; Daicel, Chiral Technologies, Europe SARL, Illkirch, France) kept at 40°C. The mobile phase consisted of a mixture of 80% hexane (A), 10% ammonium acetate (0.01 M, pH 9) in isopropanol (B), and 10% ammonium acetate (0.01 M, pH 9) in ethanol (C) for 7 minutes, followed by a step gradient at 10/45/45 (A/B/C), at a flow rate of 1.0 mL/min. Mass transitions (m/z) of 411.2 to 191.0 (risperidone), 427.2 to 207.0 (9-OH-risperidone), 415.2 to 193.0 (internal standard [IS] risperidone), and 431.2 to 209.0 (IS 9-OH-risperidone) were selected for ion monitoring. Methanol working solutions containing risperidone and 9-OH-risperidone enantiomers were spiked to blank plasma, resulting in a 0.2- to 100-ng/mL concentration range. The lower limit of quantitation was 0.2 ng/mL for risperidone and the 9-OH-risperidone enantiomers. Imprecision and bias were estimated by analysis of independently prepared quality control samples (spiked at ~3 times the lower limit of quantification, mid-range, and ~75% of the upper limit of quantification). Imprecision and bias were <10% for each analyte, at all concentrations.
The saliva samples were analyzed by the same method after adding 200 μL of blank plasma to 100-μL saliva aliquots, resulting in a 0.4- to 200-ng/mL concentration range.
Pharmacokinetic Analysis
Pharmacokinetic analysis of risperidone steady-state plasma concentration data was conducted using standard noncompartmental methods (WinNonlin Professional, Version 4.0.1; Pharsight Corporation, Mountain View, California). Cmax and Tmax were determined by visual inspection of the plasma concentration–time profiles. The apparent terminal elimination rate constant was estimated for each subject by nonlinear regression analysis. The AUC was determined when possible using the linear trapezoidal method with the “partial area” option of 0 to 12 hours, using each patient’s elimination rate constant estimate, which was based on at least 3 observations. In instances where calculation of the elimination rate was not possible, the AUC was calculated up to the last observation. Oral clearance, volume of distribution, and terminal t1/2 were calculated using standard equations, and individual metabolite concentrations were determined by visual inspection of the plasma concentration–time profiles. The concentration–time profiles of the (+)-9-OH-risperidone and (−)-9-OH-risperidone enantiomers were explored graphically.
Genotyping
Predicted CYP2D6 phenotypes on all patients were based on genotypic determination.27,28 CYP2D6 genotypes of *3,*4,*5 deletion and duplication were determined by TaqMan real-time polymerase chain reaction (PCR), PCR/restriction enzyme digestion, and long-PCR assay. The allelic discrimination TaqMan assay, which includes the amplification primers and hybridization probes, was provided by Applied Biosystems.
Statistical Analysis
All subject and pharmacokinetic data are presented as means and ranges. Associations between saliva and plasma concentrations were assessed by Pearson’s correlation coefficients computed across subjects where appropriate. Descriptive and inferential statistics were analyzed using SPSS version 12.0 for Windows (SPSS Inc., Chicago, Illinois).
RESULTS
The study comprised 19 children and adolescents, ranging in age from 4 years 2 months to 15 years 11 months. Demographic data for individual patients are provided in Table I. The minimum daily dose of risperidone was 0.25 mg BID, and the maximum daily dose was 2.5 mg BID. Four of 19 patients were taking the liquid form of risperidone; the remainder were taking a tablet form. All but 4 patients were taking concomitant medicines, and most were taking at least 2 additional medications (Table I). The most common concomitant medicines were taken to treat attention-deficit/hyperactivity disorder (n = 7). The mean (SD) age of the study population was 10.1 (3.4) years; weight, 42.7 (17.3) kg; height, 140.6 (18.0) cm; body surface area, 1.3 (0.3) m2; and body mass index, 20.8 (4.7) kg/m2.
Table I.
Patient characteristics.
| Age, | Weight, | Height, | Risperidone | Concomitant | ||||
|---|---|---|---|---|---|---|---|---|
| Patient | y, mo | Sex | Race | kg | cm | Diagnosis | Dose | Medicines |
| 1 | 4, 2 | M | B, W | 20.4 | 109.2 | Autism | 0.25 mg BID | Melatonin,* cetirizine* |
| 2 | 4, 2 | M | B, W | 26.3 | 115.6 | Autism | 0.35 mg am, | Melatonin,* cetirizine* |
| 0.375 mg pm | ||||||||
| 3 | 6, 1 | M | W | 28.1 | 127.0 | PDD-NOS | 1.0 mg BID | Acidophilus,* multivitamin* |
| 4 | 6, 6 | F | W | 26.3 | 119.4 | Bipolar disorder, ADHD | 0.5 mg am, | Lithium carbonate, lamotrigine |
| 1.0 mg pm | ||||||||
| 5 | 7, 5 | F | W | 25.4 | 127.0 | Autism | 1.25 mg am, | |
| 1.0 mg pm | ||||||||
| 6 | 7, 11 | M | B, W | 32.7 | 134.6 | ADHD | 0.5 mg BID | Divalproex sodium |
| 7 | 8, 9 | M | W | 39.0 | 133.4 | Tourette’s syndrome | 1.0 mg BID | Divalproex sodium, amphetamine/ dextroamphetamine |
| 8 | 9, 2 | M | W | 31.3 | 132.1 | OCD | 0.25 mg am, | Amphetamine/dextroamphetamine, fluoxetine |
| 0.5 mg pm | ||||||||
| 9 | 9, 6 | F | W | 30.8 | 134.6 | Bipolar disorder | 0.25 mg am, | Fluoxetine, dextroamphetamine |
| 1.0 mg pm | ||||||||
| 10 | 10, 2 | M | W | 59.4 | 142.2 | Autism | 0.5 mg BID | |
| 11 | 10, 9 | M | W | 44.5 | 152.4 | Asperger’s syndrome | 0.5 mg BID | Amphetamine/dextroamphetamine, fluoxetine |
| 12 | 11, 5 | M | W | 35.4 | 139.7 | Bipolar disorder, ADHD | 0.5 mg am, | Amphetamine/dextroamphetamine, lamotrigine, |
| 1.0 mg pm | mirtazapine | |||||||
| 13 | 12, 1 | M | W | 36.1 | 144.2 | Bipolar disorder, ADHD | 1.0 mg BID | |
| 14 | 12, 3 | M | W | 82.0 | 162.6 | Autism | 2.5 mg BID | |
| 15 | 13, 2 | M | W | 54.0 | 157.5 | ADHD | 0.5 mg am, | Phentermine |
| 0.25 mg pm | ||||||||
| 16 | 13, 3 | F | W | 52.1 | 169.6 | Autism | 1.0 mg am, | |
| 1.5 mg pm | Buspirone, loratadine | |||||||
| 17 | 13, 10 | M | W | 58.5 | 153.0 | Bipolar disorder, ADHD | 1.0 mg BID | Topiramate |
| 18 | 14, 8 | F | W | 60.6 | 143.5 | ODD, ADHD | 0.5 mg BID | Methylphenidate,* clonidine, oral contraceptives |
| 19 | 15, 11 | M | W | 67.6 | 175.3 | ADHD, ODD | 1.5 mg BID | Bupropion, methylphenidate, desloratadine |
M = male; B = black; W = white; PDD-NOS = pervasive developmental disorder, not otherwise specified; F = female; ADHD = attention-deficit/hyperactivity disorder; OCD = obsessive-compulsive disorder; ODD = oppositional defiant disorder.
Concomitant medication was not taken on test day.
The mean concentration–time profiles of risperidone and the (+)-9-OH-risperidone and (−)-9-OH-risperidone enantiomer metabolites for plasma and salivary samples for all subjects are shown in Figures 1A and 1B, respectively. The individual concentration–time profiles showed large interindividual variability (data not shown). Pharmacokinetic parameter estimates were summarized for risperidone (Table II) and its enantiomers (Table III) in plasma and saliva during maintenance treatment. The samples of 1 patient taken immediately after dosing were outliers, having very high levels of drug. It is possible that this participant did not drink a measured volume of water after taking the medicine, and this aberration likely indicates the presence of residual drug in the oral cavity. In this patient population, psychiatric or neurodevelopmental disability may hinder the ability to follow protocols; these samples were excluded from the calculation of mean pharmacokinetic parameters.
Figure 1.

Mean (SD) concentration–time profiles of risperidone (Ris) and the (+) and (−) enantiomers of 9-hydroxyrisperidone—(+)-9-OH-Ris and (−)-9-OH-Ris, respectively—for (A) plasma and (B) saliva in the 19 pediatric patients participating in this study. Although there are obvious outliers, data from all patients are included here.
Table II.
Pharmacokinetic parameters of risperidone in plasma and saliva.
| Plasma* | Saliva† | ||
|---|---|---|---|
| Cmax, ng/mL | Cmax, ng/mL‡ | ||
| Mean (SD) | 15.9 (22.2) | Mean (SD) | 12.0 (21.0) |
| Median | 10.8 | Median | 2.6 |
| Range | 2.3–104.0 | Range | 1.3–82.7 |
| Interquartile (Q1–Q3) range | 6.4–16.3 | Interquartile (Q1–Q3) range | 1.6–12.6 |
| Tmax, h | Tmax, h | ||
| Mean (SD) | 1.2 (0.4) | Mean (SD) | 1.6 (1.6) |
| Median | 1.0 | Median | 1.0 |
| Range | 1.0–2.0 | Range | 1.0–7.0 |
| Interquartile (Q1–Q3) range | 1.0–1.0 | Interquartile (Q1–Q3) range | 1.0–1.5 |
| t1/2, h | t1/2, h | ||
| Mean (SD) | 3.0 (2.3) | Mean (SD) | 3.4 (3.2) |
| Median | 1.8 | Median | 2.0 |
| Range | 1.1–7.7 | Range | 0.7–11.6 |
| Interquartile (Q1–Q3) range | 1.6–5.1 | Interquartile (Q1–Q3) range | 1.7–4.7 |
| AUC0–12, ng · h/mL | AUC0–2, ng · h/mL | ||
| Mean (SD) | 92.1 (200.6) | Mean (SD) | 27.8 (38.7) |
| Median | 38.9 | Median | 16.6 |
| Range | 8.9–907.1 | Range | 5.1–134.0 |
| Interquartile (Q1–Q3) range | 16.8–68.8 | Interquartile (Q1–Q3) range | 5.8–27.7 |
| AUC0–2, (ng · h/mL)/dose (mg) | AUC0–2 (ng · h/mL)/dose (mg) | ||
| Mean (SD) | 118.8 (141.1) | Mean (SD) | 36.9 (30.9) |
| Median | 46.7 | Median | 30.9 |
| Range | 8.9–487.3 | Range | 5.2–102.2 |
| Interquartile (Q1–Q3) range | 27.6–137.6 | Interquartile (Q1–Q3) range | 9.1–56.2 |
| Clearance, L/h/kg | Mean reaction time, h | ||
| Mean (SD) | 0.6 (0.6) | Mean (SD) | 4.8 (3.8) |
| Median | 0.5 | Median | 3.3 |
| Range | 0.03–2.2 | Range | 1.3–13.5 |
| Interquartile (Q1–Q3) range | 0.2–1.0 | Interquartile (Q1–Q3) range | 2.5–6.7 |
| Volume, L/kg | |||
| Mean (SD) | 1.6 (1.1) | ||
| Median | 1.6 | ||
| Range | 0.4–4.9 | ||
| Interquartile (Q1–Q3) range | 0.8–2.2 | ||
| Mean reaction time, h | |||
| Mean (SD) | 4.7 (3.3) | ||
| Median | 3.1 | ||
| Range | 2.0–11.3 | ||
| Interquartile (Q1–Q3) range | 2.5–7.9 |
AUC0–2 = AUC 0 to 12 hours.
n = 19.
n = 17 for Cmax and Tmax; n = 10 for all other parameters. For saliva samples taken directly after the morning risperidone dose, 2 samples from 1 patient were clear outliers, having very high levels of drug. These likely reflected that the patient did not drink a measured volume of water after taking medicine and may indicate the residual presence of drug in the oral cavity. In this patient population, psychiatric or neurodevelopmental disability may hinder the ability to follow protocols; these samples were excluded from the calculation of mean pharmacokinetic parameters. Other samples were excluded due to insufficient sample or were not quantifiable.
Excluding outlier; Cmax including the outlier: mean (SD), 51.9 (170.7); range, 1.3–731.0 ng/mL.
Table III.
Pharmacokinetic parameters of the risperidone enantiomers in plasma and saliva.
| Parameter | (+)-9-OH-Risperidone | (−)-9-OH-Risperidone |
|---|---|---|
| Plasma*† | ||
| Cmax, nS/mL | ||
| Mean (SD) | 13.6 (10.0) | 4.9 (3.1) |
| Median | 11.4 | 4.4 |
| Range | 2.4–44.0 | 1.0–12.6 |
| Interquartile (Q1–Q3) range | 6.9–17.8 | 2.7–6.6 |
| Tmax, h | ||
| Mean (SD) | 2.4 (1.1) | 3.7 (3.1) |
| Median | 2.0 | 4.0 |
| Range | 1.0–4.0 | 1.0–12.6 |
| Interquartile (Q1–Q3) range | 2.0–4.0 | 2.0–4.0 |
| t1/2, h | ||
| Mean (SD) | 22.9 (45.8) | 26.0 (20.5) |
| Median | 6.0 | 18.5 |
| Range | 4.8–157.3 | 9.2–63.6 |
| Interquartile (Q1–Q3) range | 5.1–7.7 | 10.9–41.8 |
| AUClast (ng · h/mL)* | ||
| Mean (SD) | 73.6 (52.3) | 29.3 (19.1) |
| Median | 64.7 | 27.2 |
| Range | 14.8–226.6 | 6.2–79.5 |
| Interquartile (Q1–Q3) range | 33.9–94.6 | 15.7–33.9 |
| Predose trough, ng/mL | ||
| Mean (SD) | 6.6 (4.3) | 3.8 (2.4) |
| Median | 6.3 | 3.6 |
| Range | 1.7–18.9 | 0.7–8.8 |
| Interquartile (Q1–Q3) range | 3.3–8.4 | 1.8–5.0 |
| Saliva§ | ||
| Cmax, nS/mL | ||
| Mean (SD) | 5.2 (8.8) | 5.0 (7.9) |
| Median | 2.6 | 3.2 |
| Range | 0.6–40.4 | 0.8–36.4 |
| Interquartile (Q1–Q3) range | 1.8–6.2 | 1.5–5.9 |
| Tmax, h | ||
| Mean (SD) | 2.6 (2.3) | 2.6 (2.6) |
| Median | 2.0 | 2.0 |
| Range | 0.0–7.0 | 0.0–7.0 |
| Interquartile (Q1–Q3) range | 1.0–4.0 | 1.0–4.0 |
| AUClast, ng · h/mL‡ | ||
| Mean (SD) | 15.6 (8.9) | 15.6 (9.1) |
| Median | 14.3 | 13.9 |
| Range | 2.2–36.2 | 2.7–37.3 |
| Interquartile (Q1–Q3) range | 8.9–21.0 | 8.5–20.1 |
| Predose trough, ng/mL | ||
| Mean (SD) | 3.9 (9.2) | 4.1 (8.2) |
| Median | 1.3 | 1.8 |
| Range | 0.6–40.4 | 0.9–76.8 |
| Interquartile (Q1–Q3) range | 1.0–2.3 | 1.0–3.1 |
AUClast = AUC calculated up to the last observation.
n = 19, except for predose trough (n = 18) and half-life (n = 11).
n = 19, except for predose trough (n = 18) and half-life (n = 6).
AUC calculated until the last data point (ie, 7 hours postdose).
n = 19, except for predose trough (n = 18). For saliva samples taken directly after the morning risperidone dose, some were clear outliers, having very high levels of drug. These likely reflected patients who did not drink a measured volume of water after taking their medicine and may indicate the residual presence of drug in the oral cavity. In this patient population, psychiatric or neurodevelopmental disability may hinder the ability to follow protocols; these samples were excluded from the calculation of mean pharmacokinetic parameters.
The mean Cmax and AUC for (+)-9-OH-risperidone were ~2.8- and 2.5-fold higher than for (−)-9-OH-risperidone, respectively, while in saliva the enantiomer concentrations and AUC appeared similar.
One subject (patient 14) was a clear outlier. Based on CYP2D6 genotyping, this patient was found to be a poor metabolizer, whose status as such corresponds well with the observed concentration profile and AUC. When patient 14 was excluded, mean (SD) risperidone concentrations were 10.6 (6.7) ng/mL (Cmax) and 2.9 (3.4) ng/mL (predose trough), respectively.
Relationship Between Risperidone Plasma and Saliva Concentrations
The relationship between risperidone plasma and saliva concentrations is presented in a log-log plot in Figure 2, according to sampling time (predose [0 hour] and 1, 2, 4, and 7 hours postdose, respectively). The logarithmic regression model indicated that the log risperidone saliva concentration = −0.100 + 0.594 · log plasma concentration (R2 = 0.93 [Spearman]).
Figure 2.
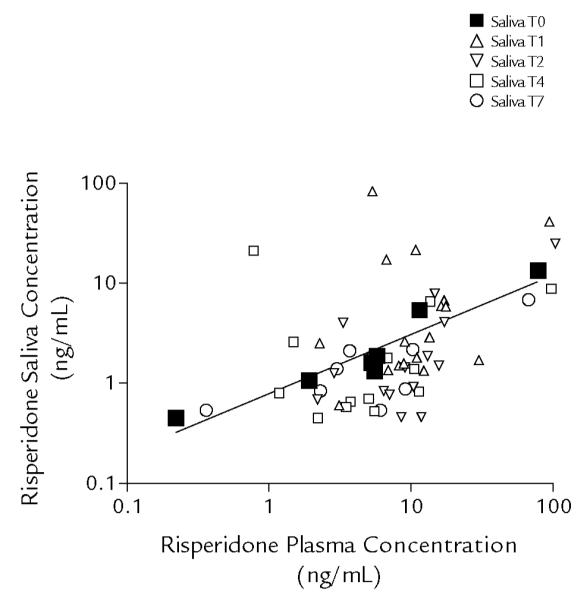
Relationship between risperidone plasma and saliva concentrations. Data are presented according to sampling time (T): predose (0 hour [TO]), and 1, 2, 4, and 7 hours postdose (T1, T2, T4, and T7, respectively). The regression line is based on predose (TO) samples only. The logarithmic regression model indicates that the log risperidone saliva concentration = −0.100 + 0.594 · log plasma concentration (R2 = 0.93 [Spearman]).
DISCUSSION
This study provides preliminary data on the basic pharmacokinetic variables for children and adolescents taking risperidone. To the best of our knowledge, it is the first published study to provide pharmacokinetic parameters for risperidone and 9-OH-risperidone enantiomer metabolites in a pediatric population. The pharmacologic properties of one enantiomer can be very different from the other; however, in vitro and in vivo pharmacologic tests indicate that these 9-OH-risperidone enantiomers are equipotent (data on file, Ortho-McNeil Janssen Scientific Affairs, L.L.C., Titusville, New Jersey). In these pediatric subjects, the Cmax of risperidone was reached in ~1 hour, and the t1/2 was 3 hours. The t1/2 of the active enantiomer metabolites is 22.9 to 26.0 hours (Table III). These parameters are similar to those described in adult subjects.11 In 9 healthy adult volunteers, the peak risperidone plasma level after a 1-mg dose was reached in 1 hour and the t1/2 was 3.2 hours. In the current study, the t1/2 of the active metabolite was ~23 to 26 hours, whereas in adults it was reported to be 20 hours.11 Our pharmacokinetic data suggest that QD dosing could be used with children, as it often is in adult patients; however, this was not the clinical finding for most of the participants in this investigation. Indeed, on presentation, only 1 participant was receiving risperidone QD (patient 18), another 17 patients were taking the medicine BID, and 1 was receiving TID dosing (patient 9). The issue of dosing is clinically important and perhaps should be addressed through empirical trials.
In plasma, the mean Cmax and AUC for (+)-9-OH-risperidone were ~2.8- and 2.5-fold higher, respectively, than for (−)-9-OH-risperidone. Overall, risperidone and enantiomer exposure in saliva was lower. In contrast to plasma, the concentrations and AUC of the 2 enantiomers in saliva were similar. This can be explained by the fact that, in saliva, the drug is not bound to proteins (free drug concentrations). It is important to consider the differential plasma protein binding for (+)-9-OH-risperidone and (−)-9-OH-risperidone of 82% and 65%, respectively.29 This difference in plasma protein binding implies that the free fraction in plasma is 18% for (+)-9-OH-risperidone and 35% for (−)-9-OH-risperidone, and may explain why saliva concentrations of the enantiomers overlap. Furthermore, the lower levels of risperidone and (+)-9-OH-risperidone in saliva may reflect relatively poor penetration of the drug in saliva. Although the administered dose in this group of patients ranged from 0.01 to 0.07 mg/kg BID, differences in the dose could not explain the large variability observed in individual concentration–time profiles, Cmax/Cmin ratios, and AUC.
Some (but not all) studies in adult patients with schizophrenia have noted associations between plasma levels of the active moiety and clinical response, or between plasma levels of the active moiety and the severity of extrapyramidal symptoms.15–18 One small study in 20 pediatric patients with autistic disorder found no significant correlation between improvement in psychopathologic state and plasma level of the active moiety.30 Even so, the potential for such associations suggests the value of drug level assessment in individual patients, particularly in cases where there appear to be significant adverse events with low dosing or a lack of clinical effect with high dosing.
Although these data must be confirmed in a larger population, the significant relationship found between predose plasma and saliva risperidone and active moiety concentrations may provide a way to make approximate estimates of predose plasma risperidone concentrations by assay of readily sampled predose saliva risperidone samples. In general, the children responded quite well to the saliva collections. All children were able to comply with the collection procedures, even very young participants and those with autism, some of whom had significant intellectual disabilities.
In our study of 19 patients, 1 was found to be a poor metabolizer, congruent with a prevalence of 7% in the white population and 1% to 2% of other races.31 Genotyping of patients before starting therapy may be helpful in guiding the rate and magnitude in dosing.
A significant limitation of this study was the relatively small sample size, which reflects the difficulty of obtaining plasma samples in children with psychiatric or neurodevelopmental disorders. Sample size also was compromised due to the procedural complexity, with the potential for outliers and exclusion of samples. Furthermore, one pair of samples indicated high levels of drug, likely due to residual drug in that patient, who, we speculate, did not drink a measured volume of water per protocol. Such samples also were excluded, further limiting the number of data points on which some analyses were based.
CONCLUSIONS
This study establishes preliminary pharmacokinetic parameters for risperidone and its 9-OH-risperidone enantiomers in plasma and salivary samples. Although it must be confirmed in a larger population, the significant relationship between predose plasma and predose saliva risperidone concentrations suggests the viability of salivary sampling for estimating plasma risperidone concentrations.
ACKNOWLEDGMENTS
This study was supported by a contract from the National Institute of Mental Health (N01MHS0011) to Dr. Aman and by the General Clinical Research Center at The Ohio State University, grant M01-RR00034 from the National Center of Research Resources of the National Institutes of Health. Risperidone and 9-OH-risperidone enantiomer assays were generously performed by Ortho-McNeil Janssen Scientific Affairs, L.L.C. Dr. Vinks was supported, in part, by grants 5U10HD037249 and 5R21HD042440 from the National Institute of Child Health and Development.
We thank Nicholas Gerber, MD, The Ohio State University, who contributed to the conceptualization of the design used in this study. We also acknowledge Jill Sanford and Mariana Ovnic for their editorial assistance.
Footnotes
Publisher's Disclaimer: This is a PDF file of an unedited manuscript that has been accepted for publication. As a service to our customers we are providing this early version of the manuscript. The manuscript will undergo copyediting, typesetting, and review of the resulting proof before it is published in its final citable form. Please note that during the production process errors may be discovered which could affect the content, and all legal disclaimers that apply to the journal pertain.
REFERENCES
- 1.Findling RL, McNamara NK, Gracious BL. Antipsychotic agents: Traditional and atypical. In: Martin A, Scahill L, Charney DS, Leckman JF, editors. Pediatric Psychopharmacology: Principles and Practice. Oxford University Press; New York, NY: 2003. pp. 328–340. [Google Scholar]
- 2.Langworthy-Lam KS, Aman MG, Van Bourgondien ME. Prevalence and patterns of use of psychoactive medicines in individuals with autism in the Autism Society of North Carolina. J Child Adolesc Psychopharmacol. 2002;12:311–321. doi: 10.1089/104454602762599853. [DOI] [PubMed] [Google Scholar]
- 3.Aman MG, Lam KS, Collier-Crespin A. Prevalence and patterns of use of psychoactive medicines among individuals with autism in the Autism Society of Ohio. J Autism Dev Disord. 2003;33:527–534. doi: 10.1023/a:1025883612879. [DOI] [PubMed] [Google Scholar]
- 4.Dewa CS, Remington G, Herrmann N, et al. How much are atypical antipsychotic agents being used, and do they reach the populations who need them? A Canadian experience. Clin Ther. 2002;24:1466–1476. doi: 10.1016/s0149-2918(02)80050-9. [DOI] [PubMed] [Google Scholar]
- 5.Patel NC, Sanchez RJ, Johnsrud MT, Crismon ML. Trends in antipsychotic use in a Texas Medicaid population of children and adolescents: 1996 to 2000. J Child Adolesc Psychopharmacol. 2002;12:221–229. doi: 10.1089/104454602760386905. [DOI] [PubMed] [Google Scholar]
- 6.Zito JM, Safer DJ, DosReis S, et al. Psychotropic practice patterns for youth: A 10-year perspective. Arch Pediatr Adolesc Med. 2003;157:17–25. doi: 10.1001/archpedi.157.1.17. [DOI] [PubMed] [Google Scholar]
- 7.Aman MG, De Smedt G, Derivan A, et al. for the Risperidone Disruptive Behavior Study Group Double-blind, placebo-controlled study of risperidone for the treatment of disruptive behaviors in children with sub-average intelligence. Am J Psychiatry. 2002;159:1337–1346. doi: 10.1176/appi.ajp.159.8.1337. [DOI] [PubMed] [Google Scholar]
- 8.Research Units on Pediatric Psychopharmacology Autism Network Risperidone in children with autism and serious behavioral problems. N Engl J Med. 2002;347:314–321. doi: 10.1056/NEJMoa013171. [DOI] [PubMed] [Google Scholar]
- 9.Snyder R, Turgay A, Aman M, et al. for the Risperidone Conduct Study Group Effects of risperidone on conduct and disruptive behavior disorders in children with subaverage IQs. J Am Acad Child Adolesc Psychiatry. 2002;41:1026–1036. doi: 10.1097/00004583-200209000-00002. [DOI] [PubMed] [Google Scholar]
- 10. [Accessed July 23, 2007];FDA approves the first drug to treat irritability associated with autism, Risperdal. Available at: http://www.fda/gov/bbs/topics/NEWS/2006/NEW01485.html.
- 11.Heykants J, Huang ML, Mannens G, et al. The pharmacokinetics of risperidone in humans: A summary. J Clin Psychiatry. 1994;55(Suppl):13–17. [PubMed] [Google Scholar]
- 12.Risperdal [package insert] Ortho-McNeil Janssen Scientific Affairs, LLC; Titusville, NJ: 1993. [Google Scholar]
- 13.Yasui-Furukori N, Hidestrand M, Spina E, et al. Different enantio-selective 9-hydroxylation of risperidone by the two human CYP2D6 and CYP3A4 enzymes. Drug Metab Dispos. 2001;29:1263–1268. [PubMed] [Google Scholar]
- 14.Lane HY, Chang WH. Risperidone-carbamazepine interaction: Is cytochrome P450 3A involved? J Clin Psychiatry. 1998;59:430–431. [PubMed] [Google Scholar]
- 15.Lane HY, Chiu WC, Chou JC, et al. Risperidone in acutely exacerbated schizophrenia: Dosing strategies and plasma levels. J Clin Psychiatry. 2000;61:209–214. doi: 10.4088/jcp.v61n0311. [DOI] [PubMed] [Google Scholar]
- 16.Mauri MC, Laini V, Boscati L, et al. Long-term treatment of chronic schizophrenia with risperidone: A study with plasma levels. Eur Psychiatry. 2001;16:57–63. doi: 10.1016/s0924-9338(00)00536-8. [DOI] [PubMed] [Google Scholar]
- 17.Kakihara S, Yoshimura R, Shinkai K, et al. Prediction of response to risperidone treatment with respect to plasma concentrations of risperidone, catecholamine metabolites, and polymorphism of cytochrome P450 2D6. Int Clin Psychopharmacol. 2005;20:71–78. doi: 10.1097/00004850-200503000-00002. [DOI] [PubMed] [Google Scholar]
- 18.Riedel M, Schwarz MJ, Strassnig M, et al. Risperidone plasma levels, clinical response and side-effects. Eur Arch Psychiatry Clin Neurosci. 2005;255:261–268. doi: 10.1007/s00406-004-0556-4. [DOI] [PubMed] [Google Scholar]
- 19.Yoshimura R, Ueda N, Nakamura J. Possible relationship between combined plasma concentrations of risperidone plus 9-hydroxyrisperidone and extrapyramidal symptoms. Preliminary study. Neuropsychobiology. 2001;44:129–133. doi: 10.1159/000054932. [DOI] [PubMed] [Google Scholar]
- 20.Aman MG, Paxton JW, Werry JS. Fluctuations in steady-state phenytoin concentrations as measured in saliva in children. Pediatr Pharmacol (New York) 1983;3:87–94. [PubMed] [Google Scholar]
- 21.Aman MG, Werry JS, Paxton JW, Turbott SH. Effect of sodium valproate on psychomotor performance in children as a function of dose, fluctuations in concentration, and diagnosis. Epilepsia. 1987;28:115–124. doi: 10.1111/j.1528-1157.1987.tb03636.x. [DOI] [PubMed] [Google Scholar]
- 22.Aman MG, Werry JS, Paxton JW, et al. Effects of carbamazepine on psychomotor performance in children as a function of drug concentration, seizure type, and time of medication. Epilepsia. 1990;31:51–60. doi: 10.1111/j.1528-1157.1990.tb05360.x. [DOI] [PubMed] [Google Scholar]
- 23.Aman MG, Werry JS, Paxton JW, Turbott SH. Effects of phenytoin on cognitive-motor performance in children as a function of drug concentration, seizure type, and time of medication. Epilepsia. 1994;35:172–180. doi: 10.1111/j.1528-1157.1994.tb02929.x. [DOI] [PubMed] [Google Scholar]
- 24.Grant S, Fitton A. Risperidone. A review of its pharmacology and therapeutic potential in the treatment of schizophrenia. Drugs. 1994;48:253–273. doi: 10.2165/00003495-199448020-00009. [DOI] [PubMed] [Google Scholar]
- 25.Remmerie BM, Sips LL, de Vries R, et al. Validated method for the determination of risperidone and 9-hydroxyrisperidone in human plasma by liquid chromatography-tandem mass spectrometry. J Chromatogr B Analyt Technol Biomed Life Sci. 2003;783:461–472. doi: 10.1016/s1570-0232(02)00715-8. [DOI] [PubMed] [Google Scholar]
- 26.Cabovska B, Cox SL, Vinks AA. Determination of risperidone and enantiomers of 9-hydroxyrisperidone in plasma by LC-MS/MS. J Chromatogr B Analyt Tecknol Biomed Life Sci. 2007;852:497–504. doi: 10.1016/j.jchromb.2007.02.007. [DOI] [PMC free article] [PubMed] [Google Scholar]
- 27.Brown MA, Edwards S, Hoyle E, et al. Polymorphisms of the CYP2D6 gene increases susceptibility to ankylosing spondylitis. Hum Mol Genet. 2000;9:1563–1566. doi: 10.1093/hmg/9.11.1563. [DOI] [PubMed] [Google Scholar]
- 28.Lovlie R, Daly AK, Molven A, et al. Ultrarapid metabolizers of debrisoquine: Characterization and PCR-based detection of alleles with duplication of the CYP2D6. FEBS Lett. 1996;392:30–33. doi: 10.1016/0014-5793(96)00779-x. [DOI] [PubMed] [Google Scholar]
- 29.Cleton A, Rossenu S, Vermeulen A, et al. A pharmacokinetic model to document the interconversion between the enantiomers of paliperidone. Clin Pharmacol Ther. 2006;79:P55. [Google Scholar]
- 30.Gagliano A, Germano E, Pustorino G, et al. Risperidone treatment of children with autistic disorder: Effectiveness, tolerability, and pharmacokinetic implications. J Child Adolesc Psychopharmacol. 2004;14:39–47. doi: 10.1089/104454604773840472. [DOI] [PubMed] [Google Scholar]
- 31.de Leon JM, Susce MT, Pan RM, et al. The CYP2D6 poor metabolizer phenotype may be associated with risperidone adverse drug reactions and discontinuation. J Clin Psychiatry. 2005;66:15–27. doi: 10.4088/jcp.v66n0103. [DOI] [PubMed] [Google Scholar]