

Abstract
Sterol regulatory element binding proteins (SREBPs) have evolved as a focal point for linking lipid synthesis with other pathways that regulate cell growth and survival. Here, we have uncovered a polycistrionic micro-RNA locus that is activated directly by SREBP-2. Two of the encoded miRs, miR-182 and miR-96, negatively regulate expression of Fbxw7 and Insig-2 respectively, and both are known to negatively affect nuclear SREBP accumulation. Direct manipulation of this miR pathway alters nuclear SREBP levels and endogenous lipid synthesis. Thus, we have uncovered a new mechanism for regulation of intracellular lipid metabolism mediated by the concerted action of a pair of miRs that are expressed from the same SREBP-2 regulated miR locus and each targets a different protein of the multi-step pathway that regulates SREBP function. These studies reveal a miR “operon” analogous to the classic model for genetic control in bacterial regulatory systems.
Sterols and fatty acids are the two major lipid classes in mammalian cells; both are critical membrane components that are continuously required to maintain cell integrity and support optimal growth. These lipids are also utilized for more specialized roles that rely on their unique physical properties to influence diverse biological processes. Major advances in understanding the regulation of lipid metabolism have occurred over the last several decades that have been fueled by parallel advances in cell, molecular, and genomic sciences that continue to revolutionize biomedical research.The pioneering studies from Brown and Goldstein have provided many of the elegant advances in cell cholesterol regulation including the discovery of a pathway for cholesterol uptake through the LDL receptor that is regulated in balance with an endogenous cholesterol production pathway centered on two endoplasmic reticulum (ER) membrane proteins: HMG CoA reductase and sterol regulatory element binding proteins (SREBPs) (Brown and Goldstein, 2009).
Mammalian SREBPs regulate genes of both cholesterol and fatty acid metabolism and recent studies show they link lipid metabolism to cell growth and survival through direct activation of additional key target genes of other cellular processes (Jeon and Osborne, 2012). Synthesized as ~125 KDa precursors, SREBPS are composed of an amino-terminal transcription factor domain connected to a membrane localization-regulation domain. Two closely-spaced membrane hydrophobic helices tether the precursor SREBP in the ER membrane where it forms a complex with the SREBP cleavage activating protein (SCAP) (Sakai et al., 1997). ER localized SCAP interacts with a third ER membrane protein called Insig and the SCAP-Insig association effectively anchors the precursor SREBP in the ER (Yang et al., 2002). When cellular lipid levels decline, or other conditions arise where increased nuclear SREBP levels are required (Jeon and Osborne, 2012), key signaling pathways decrease the SCAP-Insig interaction and the COPII trafficking system escorts the SCAP-SREBP complex to the golgi apparatus where two resident proteases sequentially cleave the SREBP precursor leaving the membrane anchor linked to the golgi membrane and releasing the mature-soluble SREBP transcription factor that is rapidly targeted to the nucleus (Sun et al., 2007).
Insig proteins also interact directly with the ER membrane-localized HMG CoA reductase enzyme, which catalyzes a key early step in the endogenous synthesis pathway for cholesterol (Sever et al., 2003). Insig directs HMG CoA reductase into a proteosomal degradation pathway so when new cholesterol synthesis is required the Insig-reductase interaction is dis-favored leading to a rapid increase in cholesterol synthesis. Thus, the connection between the rapid regulation of cholesterol biosynthesis through stabilization of HMG CoA reductase with the slowto-develop mechanism through SREBP-dependent activation of gene expression is coordinately integrated through protein-protein interactions with Insigs.
Once in the nucleus, SREBPs activate expression of many key genes for cholesterol synthesis and uptake including those encoding the LDL receptor and HMG CoA reductase. Recent advances in genomic technologies have allowed comprehensive interrogation of transcription factors at a genome-wide level and for SREBPs these studies have definitively shown their direct roles in activating genes of lipid metabolism in concert with a preferred set of generic transcription factor partners (Reed et al., 2008; Seo et al., 2009; Seo et al., 2011). Additionally, these global studies have also provided evidence of a broader role for SREBPs in physiology and metabolism (Seo et al., 2011).
Genome-wide analyses of RNA transcription patterns have uncovered an extensive network of non-coding RNAs including small micro-RNAs or miRs (Bartel, 2004). miRs are processed from longer transcripts into mature ~22–24 nucleotide single-stranded RNAs. They are incorporated into RNA protein complexes and decrease mRNA stability and/or translation efficiency of target genes through base pair interactions between the miR and target mRNA. Recent estimates suggest there are approximately 1000 miRs peppered throughout the mammalian genome, of which approximately half are encoded from their own transcriptional units while the other half are embedded within the non-coding regions of primary host protein coding mRNAs (Small and Olson, 2011). Because the embedded miRNAs are processed from the host primary transcript, expression of the miR is dependent on the same transcriptional regulatory mechanisms that govern expression of the host gene. In contrast, the non- embedded miRNAs are uniquely expressed through regulatory interactions that specifically target their own promoters.
Recent studies have uncovered a pair of miRs, miR-33a and miR-33b, that are encoded within introns of the human SREBP-2 and SREBP-1 genes respectively (Gerin et al., 2010; Horie et al., 2010; Marquart et al., 2010; Najafi-Shoushtari et al., 2010; Rayner et al., 2010). However, only miR-33a is conserved in the mouse genome. These two miRs have identical seed regions and are therefore predicted to inhibit expression from many of the same genes. One conserved miR-33 target is the ABCA1 transporter, which plays an important role in modulating intracellular cholesterol metabolism by effluxing free cholesterol to extracellular cholesterol carriers such as HDL. This pathway plays a key role in regulating reverse cholesterol transport from macrophages and is also part of the interactive mechanism for controlling intracellular cholesterol balance in many other cell types (Fernandez-Hernando and Moore, 2011; Rottiers et al., 2011). Because the SREBP-2 gene is auto-regulated, the increase in miR-33a and SREBP-2 provides two complementary mechanisms whereby increased SREBP-2 transcription increases intracellular cholesterol.
Although the SREBP-2 gene is auto-regulated, the magnitude of auto-induction is relatively mild at 2–3 fold, which is similar to the magnitude for miR-33a induction by sterol depletion in macrophages (Rayner et al., 2010). In contrast, other target genes show much more robust induction by SREBP (Horton et al., 2003; Yokoyama et al., 1993). Because intracellular cholesterol levels are tightly controlled (Goldstein and Brown, 1990), we reasoned that additional miRs might be involved in regulating intracellular cholesterol, possibly more robustly activated by SREBPs than miR33, and with unique target genes involved in the multi-step SREBP regulatory pathway. In the current study, we performed a genome-wide analysis searching for miRs that are differentially expressed in livers of mice fed a normal chow diet supplemented with excess cholesterol vs. a chow diet supplemented with a combination of lovastatin plus ezetimibe (LE). Variations of this dietary regimen have been used for three decades to analyze the hepatic regulatory pathway for cholesterol metabolism (Bennett et al., 2008; Liscum et al., 1983; Seo et al., 2011; Sheng et al., 1995). The LE combination inhibits both endogenous cholesterol synthesis and dietary absorption of cholesterol, and when combined with the cholesterol-supplemented group, the diets represent homeostatic extremes for hepatic cholesterol overload vs. depletion.
We identified 30 differentially expressed miRs, 21 that were expressed at higher levels in the LE supplemented group and 9 that were more abundant in the cholesterol-fed sample. At the extreme, miR-182 was expressed at 80-fold higher levels in the LE vs. cholesterol group. miR-182 along with its two miR siblings, miR-96 and miR-183, are expressed from a unique primary transcript (Xu et al., 2007) at a miR locus on mouse chromosome 6 and we show that the promoter for this locus is a direct target for SREBP activation. We also demonstrate that miR-182 and miR-96 negatively regulate expression of Fbxw7 and Insig-2 respectively; two proteins that are known to negatively influence the levels of nuclear SREBPs. We further show this regulatory pathway is conserved in human cells and direct manipulation of miR-182 and miR-96 expression leads to changes in nuclear SREBPs as well as alterations in endogenous lipid synthesis. Thus, we have uncovered a new mechanism for regulation of intracellular cholesterol metabolism mediated by the concerted action of a pair of miRs. Importantly, both miRs are expressed from the same SREBP-2 regulated miR transcription unit and each miR targets a different protein in the multi-step pathway that regulates SREBP action. Thus, this regulatory system is analogous to the classic operon mechanism for genetic regulation in bacterial systems where gene products that function together in a common biological pathway are coordinately expressed from the same primary transcript and from a single promoter that is regulated by the biological pathway associated with the operon (Jacob and Monod, 1961).
Results
Molecular pathways that maintain hepatic cholesterol balance have been investigated in rodent models by combining dietary manipulations with statin supplementation for over three decades (Bennett et al., 2008; Liscum et al., 1983; Seo et al., 2011; Sheng et al., 1995). As novel methods, reagents, and molecular pathways have been developed or uncovered, the same basic dietary programs have been very useful in applying new principles to further understand the regulatory mechanism for cholesterol metabolism. For example, we recently uncovered an unexpected connection between autophagy and cholesterol regulation by combining a ChIP-seq approach for the genome-wide localization of SREBP-2 in hepatic chromatin from mice fed a chow diet supplemented with the combination of lovastatin and ezetimibe (LE) to inhibit hepatic cholesterol synthesis and limit dietary absorption of cholesterol (Seo et al., 2011). In the current studies, we have used this dietary comparison to analyze differences in expression for the individual members of the small microRNA family of non-coding transcripts.
Identification of 30 cholesterol regulated microRNAs in mouse liver
We fed mice a regular chow diet supplemented with either excess cholesterol (Ch) or the LE mixture and compared the expression of hepatic miRNAs from each group using a mouse Tiling low-density PCR array (TLDA). A heat-map representation for the data is presented in Fig. S1 along with control measurements showing the LE diet-induced expression of HMG CoA reductase mRNA and protein, as well as the mature-nuclear form of SREBP-2. The heat map emphasizes there is a range in expression for individual miRs with some that are highly induced by the LE diet and some that were expressed at higher levels in the cholesterol supplemented samples. In analyzing the data further, we focused on miRNAs that were expressed with a Ct value of ≤ 35, with a differential expression of 2-fold or greater relative to the two treatment groups at p ≤ 0.05 (Table 1). There were 30 miRs that met these stringent criteria and they range from miR-182 that was expressed at 80 fold higher levels in the LE treated livers to miR-455, which was expressed at 25 fold higher levels in the cholesterol fed group. The primers included with the TLDA kit do not accurately measure expression of miR-33a, which is encoded within the SREBP-2 host gene and is known to be auto-regulated. However, this analysis did identify the complementary strand miR, miR33*, as being increased 2–3 fold by LE supplementation.
Table 1. Hepatic microRNA differential expression profiles from mice fed normal chow diet supplemented with a mixture of lovastatin plus ezetimibe (LE) vs. cholesterol (Ch).
microRNA expression profiling for total RNAs pooled from 6 C57BL/6 mouse livers for each feeding condition was analyzed by TLDA profiling as described in Methods. MicroRNA expression is displayed as fold change from the LE versus Ch. Only those miRNAs that were differentially expressed by > 2 fold with a p<0.05 with a Ct value < 35 are shown. See also Figure S1
|
Jeon/Esquejo et al 2011 Table 1 | |
|---|---|
| miRNA | Fold change (LE/Ch) |
| 182 | 81.6 |
| 470* | 28.3 |
| 34b-3p | 17.7 |
| 741 | 12.5 |
| 877 | 7.2 |
| 20b | 6.2 |
| 297a* | 5.7 |
| 19a | 4.3 |
| 875–5p | 3.6 |
| 33* | 3.2 |
| 188–5p | 3.2 |
| 467a* | 3.0 |
| 195 | 2.9 |
| 877* | 2.9 |
| 126–5p | 2.8 |
| 130b | 2.7 |
| 101a | 2.3 |
| 339–3p | 2.1 |
| 301b | 2.1 |
| 331–3p | 2.1 |
| 135a* | 2.1 |
| 185 | 2.1 |
| 676 | 0.5 |
| 15a | .28 |
| 339–5p | .255 |
| 425 | .23 |
| 221 | .20 |
| 215 | 0.19 |
| 210 | 0.1 |
| 455 | 0.04 |
miRNA-182 is expressed from a miRNA island-locus on mouse chromosome 6 that also encodes miR-96 and miR-183. Interestingly, all three are transcribed from a single promoter (Chien et al., 2011) and are part of the same primary transcript (Xu et al., 2007) (Fig. 1, bottom). It was previously shown that expression of this miR locus is activated during T-helper cell clonal expansion (Stittrich et al., 2010) and during light-dark transition in the retina (Krol et al., 2010). Interestingly, in both cases, miR-182 was more robustly expressed than the other two coexpressed miRs, which is similar to our results. To begin to evaluate the potential role for these miRs in regulating hepatic cholesterol metabolism, we analyzed expression of each one separately by specific qPCR analyses and all three miR siblings were robustly induced by LE treatment (Fig. 1A). We also measured miR-33 directly and confirmed that it was also induced by LE feeding as expected. In evaluating the TLDA data, the Ct values for miR-96 and miR-183 were below the 35-cycle cutoff in the cholesterol-fed sample, and did not meet the stringent criteria we used to prepare the list in Table 1. Expression of these three miRs was also robustly increased in livers of transgenic mice over-expressing SREBP-1a or SREBP-2, but not by SREBP-1c (Fig. S2). These results suggest that the miR locus may be directly activated by SREBPs.
Figure 1. The miR-96/182/183 locus is directly regulated by SREBP-2.

A). qPCR analysis of miR-96/182/183 in RNA from mice fed chow (N), chow supplemented with cholesterol (Ch), or chow supplemented with lovastatin plus ezetimibe (LE). Samples were normalized to sno202 RNA samples analyzed in parallel. Data are plotted relative to normalized values from chow group set at 1.0. B) ChIP analysis for SREBP-2 binding in hepatic chromatin from cholesterol (Ch) vs. lovastatin/ezetimibe (LE) supplemented mice. The three regions in the miR - 96/182/183 locus that were analyzed for SREBP-2 association are shown by the location of forward (F) and reverse (R) primer pairs 1, 2, or 3 used for the qPCR analysis as indicated. The thick gray box denotes the putative promoter region for the locus interrogated by primer pair 1 as discussed in the text. Data are represented as mean +/− SEM. See also Figure S2.
miR 96/182/183 locus is regulated by SREBP-2
Based on the data above, we reasoned the promoter driving expression of the miR locus might be directly regulated by SREBP-2. Computational methods have been used to predict putative miRNA promoters throughout the human genome by combining sequence analysis with epigenetic signatures, and mapping of short promoter-proximal RNA transcripts (Chien et al., 2011). This analysis predicted a putative promoter for the human miR-96/182/183 cluster. A sequence alignment with the corresponding region of the mouse genome revealed a high level of conservation between the two species (Fig. S3A). It is noteworthy that there are conserved putative binding sites for SREBPs as well as for other more generic transcription factors like Sp-1, NF-Y and CREB/ATF that have been shown to interact with SREBPs for efficient promoter activation (Osborne and Espenshade, 2009). Additionally, expression of these human miRs were increased similarly to miR-33a in RNA isolated from two different human hepatoma cells infected with an adenovirus expressing the mature form of SREBP-2 (Fig. S3B). Thus, the human miR-96/182/183 locus is also likely regulated directly by SREBPs.
This putative promoter region is schematically represented as a grey box in the diagram at the bottom of Fig. 1. To determine whether the predicted SREBP sites are functional, we first performed a ChIP study to evaluate SREBP-2 binding in chromatin prepared from the LE vs. cholesterol samples. The results in Fig. 1B demonstrate SREBP-2 binds to this predicted promoter region in the LE chromatin (detected by primer pair 1F/1R in Fig. 1B), but not to the coding regions of the miR locus which were analyzed as negative controls.
A cartoon-diagram of the promoter region from Fig. S3 is presented at the top of Fig. 2 highlighting the E-box sites, which are classic recognition elements for bHLH proteins such as SREBPs, along with the predicted binding sites for the more generic transcription factors Sp1 and NF-Y and that are preferentially co-enriched in SREBP target promoters (Seo et al., 2011). Next, we fused the putative promoter DNA from the mouse genome to luciferase and showed that luciferase expression was enhanced in a dose-dependent fashion by co-transfection of an expression vector encoding the nuclear-targeted SREBP-2 protein (Fig. 2, bottom). When the two predicted SREBP binding E-box elements were mutated, SREBP-2 activation was significantly reduced. Taken together with the ChIP studies, these results provide compelling evidence that expression of the miR-96/182/183 locus is directly regulated by SREBP-2.
Figure 2. SREBP-2 activates miR-96/182/183 promoter.
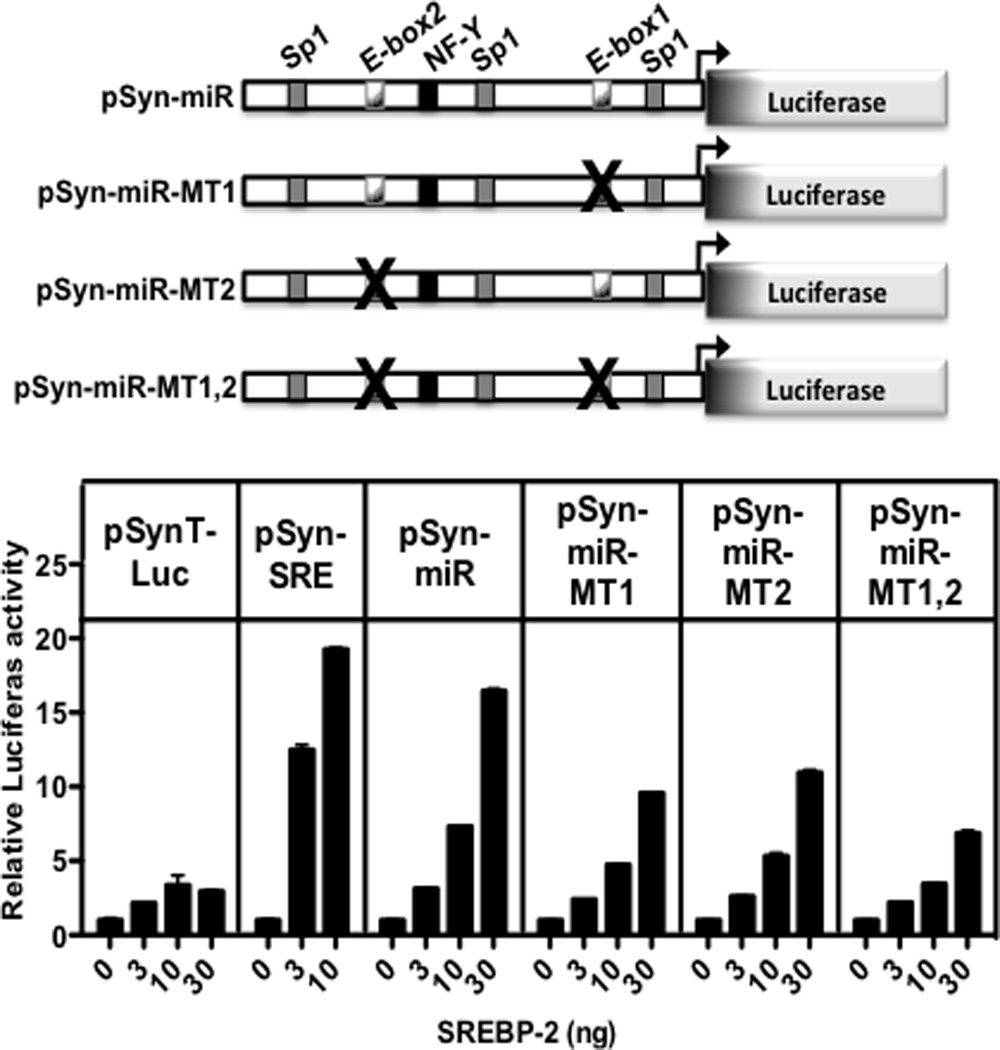
The putative promoter region shown in gray at the bottom of Fig. 1 was cloned upstream of luciferase in the control luciferase reporter as shown and described in Materials and Methods. Key putative transcription factor binding sites that are conserved between mouse and human (Fig. S3) are noted on the diagram of the sequence. (Top) There are two E-box motifs that are putative SREBP response elements and point mutations were engineered into each separately or in combination as noted by the “X”. (Bottom) Wild-type and the indicated mutant promoters were transfected into HEK-293T cells along with increasing amounts of an SREBP-2 expression vector as described in Materials and Methods. The negative and positive control promoters analyzed in parallel are shown as pSynTLuc and pSynSRELuc and are described elsewhere (Dooley et al., 1998). Luciferase activities were normalized to β-galactosidase that was expressed from an internal control co-transfected CMV- β-gal plasmid. Data are represented as mean +/− SEM. See also Figure S3.
miRs 96 and 182 decrease expression of Insig-2 and Fbxw7, two proteins that negatively regulate nuclear levels of SREBP-2
miRs regulate gene expression through putative base-pair interactions with target mRNAs as part of the RNA-induced silencing complex (RISC) and reduce expression of the encoded proteins by inhibiting translation and/or increasing mRNA degradation (Bartel, 2004). We hypothesized that because the miR 96/182/183 locus is directly activated by SREBP-2, these miRs might target proteins involved in the SREBP regulatory pathway. Thus, the Targetscan program was used to identify putative target mRNAs for miR-96, −182, and −183 and this list was cross-matched for proteins that are known to be involved in the complex sterol-regulated SREBP proteolytic maturation pathway that is partially diagrammed in Fig. 3A. A list of the highest scoring putative gene targets predicted by the target scan program for miR-182 and miR-96 are shown in Table S1 and S2 respectively. This analysis predicted genes encoding Insig-2 and Fbxw7 are putative targets of miR-96 and miR-182, respectively, across several mammalian species (Fig. 3 and Fig. S4). In fact, there are two putative miR-182 sites within the Fbxw7 3’UTR. Insig-2 is key for retaining the SCAP-SREBP-precursor complex in the ER (Yabe et al., 2002) (Fig 3A) and Fbxw7 is the E3 ubiquitin ligase that targets nuclear SREBPs for proteasomal degradation (Sundqvist et al., 2005) (Fig. 3A). Because Insigs and Fbxw7 both limit accumulation of nuclear SREBPs, elevated expression of miRs that target these proteins would be predicted to increase nuclear SREBP-2, which is a signature hepatic response of the LE dietary supplementation. To test this prediction, we first measured Insig-2 and Fbxw7 mRNA and protein levels in extracts from cholesterol or LE treated mice. The results demonstrate Insig-2 and Fbxw7 protein levels were both significantly lower in the LE vs. cholesterol-fed samples (Fig. 3B). Interestingly, this was accompanied by a decrease in Insig-2 mRNA, but Fbxw7 mRNA was not significantly altered. These results are consistent with miR-96 and miR-182 targeting Insig-2 and Fbxw7, respectively.
Figure 3. miRs 96 and 182 target key proteins of the SREBP maturation pathway.

(A) A cartoon depicting key molecules and trafficking of the SREBP maturation pathway is presented along with the putative target genes for miR-96 and miR-182 as Insig and Fbxw7, respectively. (B) Immunoblotting and qPCR analyses for Insig-2 and Fbxw7 in extracts from livers of cholesterol (Ch) and lovastatin/ezetimibe (LE) treated mice. Data are represented as mean +/−SEM. See also Figure S4 and Tables S1 and S2.
Additional studies were focused on Fbxw7 because the Ct value for miR-182 suggested it was more highly expressed following LE treatment relative to miRs-96 and −183 in the liver. We reasoned that if miR-182 repression of Fbxw7 was crucial for increasing SREBP-2 levels in response to LE feeding, addition of cholesterol following LE induction would coordinately suppress SREBP-2 and miR-182 while reciprocally increasing expression of Fbxw7 back to the level observed in control animals. The results in Fig. 4A and B show that the increase in expression of both SREBP-2 and miR-182 in response to LE supplementation was significantly suppressed after one day of cholesterol supplementation. Additionally, the low levels of Fbxw7 protein observed following LE supplementation increased steadily as miR-182 levels declined over the course of three days of cholesterol feeding. We also measured expression of SREBP-2 mRNA along with its embedded microRNA, miR-33a. As predicted, expression of SREBP-2 and miR-33a were induced similarly by LE and suppressed in parallel by cholesterol addition (Fig. S5).
Figure 4. Coordinate and reciprocal regulation of nSREBP-2 with miR-182 or Fbxw7 respectively.

A-B). Mice were fed chow (N) supplemented with cholesterol (Ch), LE, or LE followed by cholesterol for 1–3 days as indicated. Equal amounts of protein from two separate mice were analyzed for nSREBP-2, Fbxw7, and control proteins as indicated by immunoblotting (A) and results were quantified and plotted as relative expression (B) along with the relative expression of miR-182 analyzed by qPCR. (C) Hepatic protein from three individual mice were analyzed as in (A). Where indicated, a control anti-miR (A-miR-Con) or an antimiR designed to target miR-182 (A-mir-182) were injected (30 mg/kg) on days 3, 4, and 5 of LE diet supplementation and mice were sacrificed on day 7. Data are represented ad mean +/− SEM. See also Figure S5.
To directly determine whether the increase in miR-182 following LE treatment contributes to the increased nuclear accumulation of SREBP-2, we treated mice with LE and injected them with an anti-miR designed to pair with and inactivate miR-182. The results show anti-miR-182 treatment blunted induction of SREBP-2 by LE treatment (Fig. 4C and Fig. S6). Expression of some SREBP target genes such as SREBP-2 itself were also reduced (Fig. S6) while others, like Hmgcr, were minimally affected (Fig. S6). This is consistent with many other observations that demonstrate individual SREBP target genes are differentially affected by direct changes in SREBP levels (Osborne and Espenshade, 2009).
Fbxw7 protein levels were only minimally affected by the anti-miR-182 treatment (Fig. 4C and Fig. S6) suggesting there are other miR182 target genes involved in regulating nuclear SREBP levels. Mice were also injected with anti-miRs targeting either miR-96 or mir-183 and neither miR resulted in a decrease in nuclear SREBP-2 (Fig. S6). Taken together, the results suggest that miR-182 plays a dominant role for regulation of SREBP-2 under these conditions, which is consistent with its more robust induction relative to the other two miRs in response to the LE diet challenge.
miR regulation of SREBPs through FBXW7 is conserved in human cells
To analyze the role of miR-182 in regulating human SREBPs through FBXW7, we compared the effects of direct siRNA targeting of Fbxw7 to miR-182 on nuclear SREBP levels in HeLa cells (Fig. 5A). Treatment of HeLa cells with siRNA targeting FBXW7 resulted in an increase in nuclear SREBP-1 and this was similar to the samples treated with pre-miR-182. The magnitude of the induction of nuclear SREBP-1 was similar to that obtained by sterol depletion which is the classic treatment for inducing nuclear SREBP accumulation in cultured cells (Brown and Goldstein, 1986, 1999). Interestingly, while siRNA targeting resulted in parallel reduction in FBXW7 mRNA and protein, the pre-miR-182 treatment resulted in a decrease in FBXW7 protein without a change in RNA. This is consistent with the effects observed for the LE diet treatment on FBXW7 levels in mice (Fig. 3).
Figure 5. Regulation of SREBPs by the miR-182 locus through FBXW7 is conserved in human cells.

A) HeLa cells were transfected with siRNA or pre-miRs as indicated (10 nM, Ambion) in antibiotic-free medium as described in Materials and Methods. After 24 hours, the dishes were switched to DMEM containing 5% lipoprotein-deficient serum, 12 µg/mL cholesterol, 1 µg/mL 25-HC and incubated for 24 hours at 37°C. (A) qPCR for FBXW7 and immunoblotting for FBXW7, SREBP-1 and β-actin. B) The full length FBXW7 coding sequence was cloned downstream of the constitutive RPL10 promoter with that natural FBXW7 3’UTR intact. We also prepared a version where the two predicted miR-182 targeting sites were mutated to decrease the predicted complementarity. These constructs were transfected into HeLa cells in combination with miR-182 or controls and cultured as described in Methods and in the Figure diagram. Quantitation from a scanned image of the immunoblot is presented at the top. Data are represented as mean +/− SD. See also Figure S6.
Increase in nuclear SREBP-2 mediated by miR-182 transfection is reversed by re-introduction of ectopic FBXW7 and is sensitive to the 3’UTR
In order to directly analyze the effects of miR-182 on FBXW7 protein expression, we transfected HeLa cells with an expression vector encoding the full-length SREBP-2 protein including its carboxy-terminal membrane-targeting domain and a FLAG epitope tag at the amino-terminus. Where indicated, cells were co-transfected with the pre-miR-182 and to restore FBXW7, an expression vector encoding FBXW7 (without its native 3’UTR) was added as shown in Fig. S6A. In this study, the increase in nuclear SREBP-2 that resulted from pre-miR-182 addition was similar to that observed when cells were depleted of endogenous sterols. Importantly, the effect was reversed when the FBXW7 expression vector was also included which is consistent with FBXW7 being the major target of miR-182 for regulation of nuclear SREBP levels under these conditions.
To determine whether the effect of ectopic FBXW7 was sensitive to miR-182 targeting the predicted miR-182 binding sites in the FBXW7 3’UTR, we performed two experiments. First, we expressed FBXW7 protein from a constitutive mRNA that contains either its natural 3’UTR or a mutant version where both predicted miR-182 targeting sites (Fig. S4) were changed to destroy complementarity (Fig. 5B). We also showed that FBXW7 protein was expressed at similar levels from both constructs in transfected cells (Fig. S6). When we co-transfected a pre miR-182 along with the two FBXW7 expression constructs, only the one with the mutated miR-182 targeted sites was able to decrease the nuclear SREBP-1._In a separate experiment, we also inserted the wild type and mutant FBXW7 mRNA 3’UTR regions downstream from the luciferase coding sequence driven by a constitutive ribosomal protein-gene 10 promoter (Fig. S6). When these two luciferase expression constructs were transfected into mammalian cells, luciferase expressed from the FBXW7 construct containing the native FBXW7 3’UTR was suppressed by the addition of miR-182 whereas luciferase expressed from the 3’UTR mutant construct was not affected. We also performed a similar experiment to analyze miR-96 targeting of INSIG-2 (Fig. S6). In this experiment, the reduction in luciferase expression in response to miR-96 cotransfection was abrogated when the bases complementary to the miR seed sequences in the corresponding 3’UTRs (Fig. S4) were mutated (Fig. S6). Taken together, the results from the co-transfection studies with the mutant 3’UTRs support our conclusions that miR-182 directly targets the FBXW7 3’UTR and miR-96 directly targets the INSIG 2 3’UTR.
miRs-96/182/183 regulate lipid synthesis through modulation of nuclear SREBP levels
The miR-96/182/183 locus is conserved in humans and sequence alignment predicts human INSIG-2 and FBXW7 are also targeted by the corresponding human miRs (Fig. S4). To test this prediction, HeLa cells were cultured in the presence of sterols where nuclear levels of SREBPs are low and cells were treated with individual pre-miRs corresponding to human miR-96, miR-182, or miR-183 or the combination of all three pre-miRs (Fig. 6A). Nuclear SREBP-1 was increased similarly by each individual miRs or the combination. There was a similar increase in SREBP-2 nuclear accumulation and SREBP target genes were stimulated in parallel with changes in nuclear SREBPs (Fig. S7).
Figure 6. miR regulation of SREBP levels is accompanied by robust induction of lipid biosynthesis.
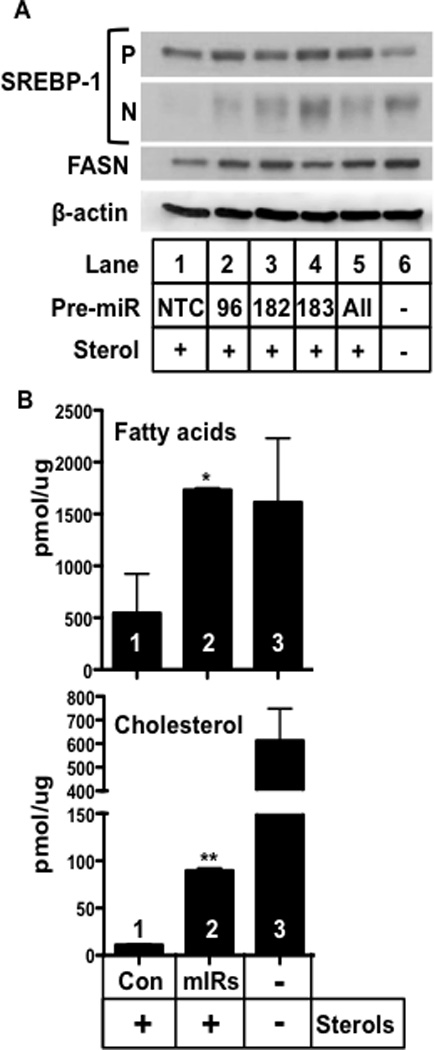
A). HeLa cells were transfected with the indicated human pre-miRNAs alone or in combination (10 nM, Ambion) as indicated and cultured in antibiotic free medium. After 24 hours, the dishes were switched to DMEM containing 5% lipoprotein-deficient serum, with or without sterol mixture (12 µg/mL cholesterol, 1 µg/mL 25-HC) and incubated for 24 hours at 37°C and harvested. Western blot analysis for the precursor (P) and nuclear (N) form of SREBP-1 was performed. Fatty acid synthase protein was also analyzed by immunoblotting (FASN) and β-actin was measured as a control. B). Companion dishes of HeLa cells were treated as in A and de novo synthesis of fatty acid and cholesterol were measured using [14C] acetate incorporation. Either control miR (Con) or a mixture of all three specific miRs(96/182/183) were added together. The p-values for differences relative to control were *p=0.035 for fatty acids and **p<0.0001 for cholesterol. Data are represented as mean +/− SEM. See also Figure S7.
To determine whether regulation of SREBP levels by this miR pathway has a significant physiologic impact on endogenous lipid synthesis, we measured the effects of the combination of all three pre-miRs on the synthetic rates for fatty acids and cholesterol in HeLa cells. The low level of endogenous lipid synthesis in sterol treated HeLa cells was significantly enhanced by the pre-miR combination (Fig. 6B).
Discussion
In classic experiments dating to the middle of the last century, hepatic cholesterol synthesis was suppressed when animals were fed a diet supplemented with excess cholesterol (Gould, 1951; Langdon and Bloch, 1953). This first demonstration of end-product repression in a complex mammalian system in vivo pre-dated most of the key experiments that defined the fundamental molecular mechanisms for nutrient sensing in bacteria (Monod et al., 1963). Since that time, mammalian cholesterol metabolism has been an experimentally rich and clinically relevant experimental system for understanding how the classic regulatory mechanisms for small molecule sensing have evolved to maintain homeostasis in a complex and highly integrated multi-cellular eukaryotic environment (Brown and Goldstein, 2009).
Using an updated version of the original animal feeding protocol, we have uncovered a new role for a coordinately expressed cluster of non-coding micro-RNAs in the pathway that maintains feedback control of intracellular lipid metabolism. In an unbiased screen, we first noticed that levels of miRs 96, 182, and 183 were dramatically increased in livers of mice fed a chow diet supplemented with lovastatin plus ezetimibe relative to a group fed chow supplemented with excess cholesterol. These three conserved miRs are transcribed together in the same transcription unit from a miR locus on mouse chromosome 6 and the homologous region from human chromosome 7 (Chien et al., 2011; Xu et al., 2007). Nuclear SREBP-2 levels increase dramatically by the LE feeding protocol and expression of this miR locus was also induced along with the known SREBP-2 transcriptional program driving lipid accumulation. We also showed that SREBP-2 binds to the promoter for the miR-locus providing a mechanism for the LE-dependent induction.
We also show that the promoter driving expression of the miR locus encoding miR-96/182/183 is directly activated by SREBP-2. We also show miR-96 inhibits Insig-2 and miR- 182 inhibit Fbxw7 and both of these proteins have well described roles in limiting accumulation of nuclear SREBPs as diagrammed in Fig. 3A (Sundqvist et al., 2005; Yabe et al., 2002). Insig-2 reduces proteolytic activation of the membrane bound SREBP precursor and Fbxw7 is the E3 ubiquitin ligase that targets nuclear SREBPs for turnover by the proteasome. In fact, the major effect of a hepatic knockout of Fbxw7 was an increase in nuclear SREBPs and hepatic lipid accumulation (Onoyama et al., 2011), which further emphasizes the importance of Fbxw7 in hepatic lipid accumulation and the SREBP pathway. Additionally, an Fbxw7 siRNA titration experiment showed that a similar change in Fbxw7 mediated by miR-182 resulted in an increase in nuclear SREBP levels in HeLa cells.
Treatment of HeLa cells with pre-miR-183 also increased nuclear SREBP-1 suggesting miR-183 also targets a protein(s) involved in regulating SREBP levels. We were initially encouraged when target scan predicted that miR-183 might target Insig-1 directly. However, we have been unable to confirm this by direct studies with pre miR-183 and the INSIG-1 3’UTR reporter. Unfortunately there were no other obvious SREBP pathway associated genes within the list of putative miR-183 candidates predicted by Targetscan (not shown) or additional prediction programs. Our results strongly suggest that miR183 targets a key gene that regulates nuclear SREBP levels, however its identification will require development of more robust and accurate methods for identifying miR target genes. Because miRs often target several genes in the same pathway, it is also possible that future studies will identify additional relevant target genes of miRs 96 and 182 as well.
The miR regulatory pathway described here is conserved from mouse to humans and we show that introduction of the corresponding pre miRs into human cells increases nuclear levels of both SREBP-1 and SREBP-2. Importantly, this is accompanied by an increase in the rates of synthesis for fatty acids and cholesterol, which are major physiological outcomes for increased SREBP activity. It is noteworthy that the increase in lipid synthesis occurs in cells cultured in the presence of excess sterols indicating this miR pathway can significantly affect lipid metabolism in the absence of other signals that increase SREBP activity in response to low intracellular sterol conditions. Even though addition of ectopic miRs can drive significant SREBP accumulation in transfected cells, this miR pathway represents only a portion of the overall multi-faceted mechanism for regulating SREBP levels in response to physiologic cues. This is evident from the experiment where cholesterol was added to the diets of mice that were pre-treated with LE to induce SREBP-2. In this experiment, SREBP-2 protein levels decline rapidly and dramatically, whereas the levels of miR-182 decline more slowly over time.
miR-182 has also been implicated in oncogenesis and anti-miR targeting of miR-182 decreases hepatic metastasis in a mouse melanoma model (Huynh et al., 2011). Although comparative microarray analyses showed several putative miR-182 target genes were altered by the anti-miR targeting in this study, the identity of key oncogenic targets were not clearly established. Based on our studies, and the known role of Fbxw7 in regulating turnover of cyclins (Koepp et al., 2001) and oncogenes such as c-Myc and c-Jun (Nateri et al., 2004; Yada et al., 2004), it is possible that Fbxw7 is an important target in this liver metastasis model as well.
The hepatic induction of miR-182 by LE treatment was significantly more robust than for miRs-96 and 183. A similar differential accumulation of miR-182 was also observed when the locus was activated during clonal expansion of T-helper cells (Stittrich et al., 2010). The reason for the differential accumulation of miR-182 relative to the others is not clear because all three are processed from the same initial transcript. However, individual miRs are assembled into an active RISC silencing complex after a multi-step processing and assembly pathway and the mechanistic details are not fully understood (Bartel, 2004, 2009). Thus, it is likely that the differential accumulation and loading of specific miRs into RISC is related to differences in the efficiency of pre-miR processing and differential complex assembly.
The concentration of miR-182 decreased by approximately 50% from its peak value in the LE treatment group following one day of cholesterol supplementation and it declined further over the course of the experiment. Thus, hepatic miR-182 levels respond more rapidly than miRNAs in general, which have been reported to be quite stable with an average half-life of approximately five days (Gantier et al., 2011). miR-182 levels also change quickly during the light to dark transition in the retina (Krol et al., 2010). Thus, relatively rapid changes in miR-182 levels are compatible with a significant role in more dynamic metabolic control.
miR regulation often results in modest decreases in target protein expression. However, singular miRs are known to target several proteins in a common pathway, so even though individual changes are modest, the overall effect on pathway flux can be quite significant (Small and Olson, 2011). Our studies reveal another mode of miR regulation of a biological pathway where two separate miRs that are encoded from a common RNA transcript (Chien et al., 2011; Xu et al., 2007) target different steps in a pathway that regulates a transcription factor that controls expression from the corresponding miR promoter. In this way, our study reveals a regulatory loop whereby SREBP-2 controls expression from a genetic locus that produces miRs that regulate SREBP activity (Fig. S7C). The mechanism is reminiscent of the classic “operon” paradigm for coordinate regulation of biological processes in bacterial systems where gene products that function together in a common pathway are coordinately expressed from one primary transcript and downstream from one promoter that is regulated by the biological process associated with the gene products encoded by the operon (Jacob and Monod, 1961; Monod et al., 1965). In bacteria, end-product repression of amino acid operons occurs through a transcriptional regulatory protein that is also subject to auto-regulation. It is interesting that this common feature is also shared with the miR-SREBP-2 regulatory circuit we describe here (Fig. S7C). Because a prominent feature of the operon mechanism of genetic control is a polycistronic mRNA, it was unknown whether this mechanism was conserved in eukaryotic organisms where mRNAs are monocistronic and transcription and translation occur in separate cellular compartments. However, because miRNAs are encoded in polycistronic units and the RNAs function as the active gene products, it was formally possible that miRNA operons might exist in eukaryotic organisms. The SREBP-regulated micro-RNA operon described here constitutes the first example of a true eukaryotic operon.
Overall, this study has uncovered a unique role for miRNA dependent regulation of intracellular lipid metabolism that is integrated with the INSIG-SCAP pathway for controlling nuclear SREBP levels. Several other miRs were differentially expressed in the TLDA array profile from LE vs. cholesterol feeding groups. Recent studies indicate SREBPs link lipid metabolism with additional physiologic processes (Jeon and Osborne, 2012) and it is likely that future studies will reveal new roles for these other miRs and perhaps additional target genes of the miR-96/182/183 locus in the integrated processes controlled by SREBP action.
Experimental Procedures
Animals
All animal experiments were performed in accordance with accepted standards of animal welfare and with permission of the Sanford-Burnham Medical Research Institute at Lake Nona IACUC (protocol 2012-88). Six-week-old male C57BL/6 mice were obtained from Jackson Laboratory and maintained on a chow diet for one week with a 12 h light 12 h dark cycle for acclimatization.
For miRNA expression profiling, mice were separated into 2 groups of 6 animals per group and treated as described by (Seo et al., 2011). Briefly, one group was fed with normal chow supplemented with cholesterol (1% w/w) (Ch) for 10 days, and another group was fed with chow supplemented with a mixture of lovastatin (100 mg lovastatin [2.5 tablet equivalents]/100 g chow, w/w; Mylan) and ezetimibe (from MERCK/Schering-Plough Pharmaceuticals; 21 mg ezetimibe [2.1 tablet equivalents]/100 g chow, w/w) (LE) for 7 days. All mice were sacrificed at 8 AM (at the end of the dark cycle) using CO2 asphyxiation followed by cervical dislocation. This basic feeding regimen was used in all experiments and specific variations are described in the appropriate figure legends.
For the anti-mIR experiment, mice were fed cholesterol or LE as above and control or experimental anti-mIR oligonucleotides were dissolved in 1xPBS and injected at 30 mg/kg IP on days 4, 5 and 6 at 8 AM (end of the dark cycle). Mice were sacrificed on day 7 at the end of the dark cycle.
RNA isolation, RT-qPCR, and miRNA expression profiling and validation
Total RNA was isolated from mouse liver and cultured cells with miRVana™ miRNA isolation kit (Ambion). Primer sequences used in this study are provided in Fig. S7D. mRNA levels were normalized for expression of mouse ribosomal protein L32 and human glyceraldehyde 3-phosphate dehydrogenase (GAPDH) mRNA as control and calculated by the comparative threshold cycle method. miRNA expression profiling was carried out using the TaqMan® array rodent microRNA A+B cards set v2.0 (Applied Biosystem) in triplicate at the Sanford-Burnham Genomics Core facility in Lake Nona, FL. Differential expression was then assessed using the Partek Genomics Suite (Partek Inc.). Expression levels for miRs were then quantified using TaqMan® microRNA assay kit (Applied Biosystems) with a cFX-96 Real-Time PCR Detection System (Bio-Rad). miRNA expression levels were normalized to sno202 (for mouse) and RNU48 (for human) expression.
Cell culture and small RNA transfection
HeLa cells were maintained in Dulbecco's Modified Eagle’s Medium (DMEM) supplemented with 10% heat-inactivated fetal bovine serum (FBS) and antibiotics in an atmosphere of 5% CO2 at 37°C. HeLa cells were transfected with 10 nM pre-miRNAs (Ambion) using Lipofectamine RNAiMAX reagent (Invitrogen) or FBXW7 siRNA from Dharmacon using Dharmafect 1 reagent. Manipulations were performed according to the manufacturer’s instructions and cells were cultured in DMEM media with 10% FBS without antibiotics. HeLa cells were switched to DMEM containing 5% lipoprotein-deficient serum (LPDS, from Sigma Aldrich) and sterols (12 µg/mL cholesterol, 1 µg/ml 25-hydroxycholesterol) 24 hours after transfection. Cells were harvested 24 hours later. Where indicated, plasmids encoding the full length human SREBP-2 with three copies of the FLAG epitope (a gift from Jared Rutter) or human FBXW7 with a GST tag (Sundqvist et al., 2005) were included in the transfection.
ChIP assay
Chromatin preparations for ChIP assays using mouse livers were performed as previously described (Bennett et al., 2008; Seo et al., 2009). For gene specific ChIP, qPCR analysis of SREBP-2 binding to specific gene promoters was performed in triplicate with a standard dilution curve of the input DNA performed in parallel and enrichment was measured by SYBR green incorporation using a cFX-96 Real-Time PCR Detection System (Bio-Rad). Analyses were performed by the standard curve method and values were normalized relative to a non-target control region from the ribosomal L32 gene. The qPCR oligonucleotide pairs for the mouse promoters are provided in Fig. S7.
De novo lipid biosynthesis assay
HeLa cells were transfected with pre-miRNAs as described above. Cells were switched to DMEM containing 5% LPDS with or without sterols for 24 hours. 24 hours later, cells were incubated in DMEM containing 5% LPDS, with or without sterols, plus 0.5 mM sodium [14C]-acetate for the indicated times up to 3 hours. The cells were harvested by scraping into 0.5 ml 0.1 N NaOH, followed by 0.5 ml distilled water, and 100 µl of the cell lysate was used to determine cellular protein content using the Pierce BCA Protein Assay Kit (Thermo Scientific, Rockford, IL, USA). The content of [14C]-labeled cholesterol and [14C]-labeled fatty acids were extracted from the remainder of the lysates as previously described (Horton et al., 1999) and spotted onto plastic-backed silica gel TLC plates (Macherey-Nagel Inc., Bethlehem, PA, USA). TLC plates were resolved in chloroform (cholesterol) or a heptane:diethyl ether:acetic acid (90:30:1) mixture (fatty acids) and stained with iodine vapor. The TLC spots were excised and transferred to scintillation vials containing 10 ml Ultima Gold™ XR scintillation fluid (Perkin-Elmer) for radioactive counting of [14C] and [3H]. The rate of incorporation for the 3 hr time course was linear under all assay conditions indicating the endogenous acetate pool was unaffected by the sterol manipulation (data not shown). All data for each sample were normalized to starting protein concentration and extraction efficiency using the internal [3H]-cholesterol and [3H]-oleic acid standards. Data were reported as [14C]-acetate incorporation per unit mass of protein (nmol/mg protein).
Statistics
The data are presented as mean ± SEM or mean ±SD as detailed in the figure legends. Differences between the means of the individual groups were assessed by 1-way ANOVA with Dunnet’s multiple comparison test and Student’s t-test; differences were considered significant at p-value < 0.05. The statistical software package Prism 5.0 (GraphPad Software) was used for these analyses.
Supplementary Material
Acknowledgments
This work was supported in part by a grant from the NHLBI/NIH (HL48044). Y.-A.M was supported by HL020948-36. We thank Dr. Russell Debose-Boyd for supplying the HMG CoA reductase and Insig 2 antibodies, Dr. Jared Rutter for the FLAG tagged SREBP-2 vector and Dr. Johan Ericsson for the GST tagged FBXW7 expression plasmid.
Footnotes
Publisher's Disclaimer: This is a PDF file of an unedited manuscript that has been accepted for publication. As a service to our customers we are providing this early version of the manuscript. The manuscript will undergo copyediting, typesetting, and review of the resulting proof before it is published in its final citable form. Please note that during the production process errors may be discovered which could affect the content, and all legal disclaimers that apply to the journal pertain.
References
- Bartel DP. MicroRNAs: genomics, biogenesis, mechanism, and function. Cell. 2004;116:281–297. doi: 10.1016/s0092-8674(04)00045-5. [DOI] [PubMed] [Google Scholar]
- Bartel DP. MicroRNAs: target recognition and regulatory functions. Cell. 2009;136:215–233. doi: 10.1016/j.cell.2009.01.002. [DOI] [PMC free article] [PubMed] [Google Scholar]
- Bennett MK, Seo Y-K, Datta S, Shin D-J, Osborne TF. Selective Binding of SREBP isoforms and Co-Regulatory Proteins to Promoters for Lipid Metabolic Genes in Liver. J Biol Chem. 2008;283:15628–15637. doi: 10.1074/jbc.M800391200. [DOI] [PMC free article] [PubMed] [Google Scholar]
- Brown MS, Goldstein JL. A receptor-mediated pathway for cholesterol homeostasis. Science. 1986;232:34–47. doi: 10.1126/science.3513311. [DOI] [PubMed] [Google Scholar]
- Brown MS, Goldstein JL. A proteolytic pathway that controls the cholesterol content of membranes, cells, and blood. Proc. Natl. Acad. Sci. USA. 1999;96:11041–11048. doi: 10.1073/pnas.96.20.11041. [DOI] [PMC free article] [PubMed] [Google Scholar]
- Brown MS, Goldstein JL. Cholesterol feedback: from Schoenheimer's bottle to Scap's MELADL. J Lipid Res. 2009;(50 Suppl):S15–S27. doi: 10.1194/jlr.R800054-JLR200. [DOI] [PMC free article] [PubMed] [Google Scholar]
- Chien CH, Sun YM, Chang WC, Chiang-Hsieh PY, Lee TY, Tsai WC, Horng JT, Tsou AP, Huang HD. Identifying transcriptional start sites of human microRNAs based on high-throughput sequencing data. Nucleic acids research. 2011;39:9345–9356. doi: 10.1093/nar/gkr604. [DOI] [PMC free article] [PubMed] [Google Scholar]
- Dooley KA, Millinder S, Osborne TF. Sterol regulation of 3-hydroxy-3-methylglutaryl-coenzyme A synthase gene through a direct interaction between sterol regulatory element binding protein and the trimeric CCAAT-binding factor/nuclear factor Y. J Biol Chem. 1998;273:1349–1356. doi: 10.1074/jbc.273.3.1349. [DOI] [PubMed] [Google Scholar]
- Fernandez-Hernando C, Moore KJ. MicroRNA modulation of cholesterol homeostasis. Arteriosclerosis, thrombosis, and vascular biology. 2011;31:2378–2382. doi: 10.1161/ATVBAHA.111.226688. [DOI] [PMC free article] [PubMed] [Google Scholar]
- Gantier MP, McCoy CE, Rusinova I, Saulep D, Wang D, Xu D, Irving AT, Behlke MA, Hertzog PJ, Mackay F, Williams BR. Analysis of microRNA turnover in mammalian cells following Dicer1 ablation. Nucleic acids research. 2011;39:5692–5703. doi: 10.1093/nar/gkr148. [DOI] [PMC free article] [PubMed] [Google Scholar]
- Gerin I, Clerbaux LA, Haumont O, Lanthier N, Das AK, Burant CF, Leclercq IA, MacDougald OA, Bommer GT. Expression of miR-33 from an SREBP2 intron inhibits cholesterol export and fatty acid oxidation. J Biol Chem. 2010;285:33652–33661. doi: 10.1074/jbc.M110.152090. [DOI] [PMC free article] [PubMed] [Google Scholar]
- Goldstein J, Brown M. Regulation of the mevalonate pathway. Nature. 1990;343:425–430. doi: 10.1038/343425a0. [DOI] [PubMed] [Google Scholar]
- Gould RG. Lipid metabolism and atherosclerosis. Am. J. Med. 1951;11:209–227. doi: 10.1016/0002-9343(51)90107-6. [DOI] [PubMed] [Google Scholar]
- Horie T, Ono K, Horiguchi M, Nishi H, Nakamura T, Nagao K, Kinoshita M, Kuwabara Y, Marusawa H, Iwanaga Y, Hasegawa K, Yokode M, Kimura T, Kita T. MicroRNA-33 encoded by an intron of sterol regulatory element-binding protein 2 (Srebp2) regulates HDL in vivo. Proc Natl Acad Sci U S A. 2010;107:17321–17326. doi: 10.1073/pnas.1008499107. [DOI] [PMC free article] [PubMed] [Google Scholar]
- Horton JD, Shah NA, Warrington JA, Anderson NN, Park SW, Brown MS, Goldstein JL. Combined analysis of oligonucleotide microarray data from transgenic and knockout mice identifies direct SREBP target genes. Proc Natl Acad Sci U S A. 2003;100:12027–12032. doi: 10.1073/pnas.1534923100. [DOI] [PMC free article] [PubMed] [Google Scholar]
- Horton JD, Shimano H, Hamilton RL, Brown MS, Goldstein JL. Disruption of LDL receptor gene in transgenic SREBP-1a mice unmasks hyperlipidemia resulting from production of lipid-rich VLDL. J. Clin. Invest. 1999;103:1067–1076. doi: 10.1172/JCI6246. [DOI] [PMC free article] [PubMed] [Google Scholar]
- Huynh C, Segura MF, Gaziel-Sovran A, Menendez S, Darvishian F, Chiriboga L, Levin B, Meruelo D, Osman I, Zavadil J, Marcusson EG, Hernando E. Efficient in vivo microRNA targeting of liver metastasis. Oncogene. 2011;30:1481–1488. doi: 10.1038/onc.2010.523. [DOI] [PubMed] [Google Scholar]
- Jacob F, Monod J. Genetic regulatory mechanisms in the synthesis of proteins. Journal of molecular biology. 1961;3:318–356. doi: 10.1016/s0022-2836(61)80072-7. [DOI] [PubMed] [Google Scholar]
- Jeon TI, Osborne TF. SREBPs: metabolic integrators in physiology and metabolism. Trends Endocrinol Metab. 2012;23:65–72. doi: 10.1016/j.tem.2011.10.004. [DOI] [PMC free article] [PubMed] [Google Scholar]
- Koepp DM, Schaefer LK, Ye X, Keyomarsi K, Chu C, Harper JW, Elledge SJ. Phosphorylation-dependent ubiquitination of cyclin E by the SCFFbw7 ubiquitin ligase. Science. 2001;294:173–177. doi: 10.1126/science.1065203. [DOI] [PubMed] [Google Scholar]
- Krol J, Busskamp V, Markiewicz I, Stadler MB, Ribi S, Richter J, Duebel J, Bicker S, Fehling HJ, Schubeler D, Oertner TG, Schratt G, Bibel M, Roska B, Filipowicz W. Characterizing light-regulated retinal microRNAs reveals rapid turnover as a common property of neuronal microRNAs. Cell. 2010;141:618–631. doi: 10.1016/j.cell.2010.03.039. [DOI] [PubMed] [Google Scholar]
- Langdon RG, Bloch K. The effects of some dietary additions on the synthesis of cholesterol from acetate in vitro . J. Biol. Chem. 1953;202:77–81. [PubMed] [Google Scholar]
- Liscum L, Luskey KL, Chin DJ, Ho YK, Goldstein JL, Brown MS. Regulation of 3-hydroxy-3-methylglutaryl coenzyme A reductase and its mRNA in rat liver as studied with a monoclonal antibldy and a cDNA probe. J. Biol. Chem. 1983;258:8450–8455. [PubMed] [Google Scholar]
- Marquart TJ, Allen RM, Ory DS, Baldan A. miR-33 links SREBP-2 induction to repression of sterol transporters. Proc Natl Acad Sci U S A. 2010;107:12228–12232. doi: 10.1073/pnas.1005191107. [DOI] [PMC free article] [PubMed] [Google Scholar]
- Monod J, Changeux JP, Jacob F. Allosteric proteins and cellular control systems. Journal of molecular biology. 1963;6:306–329. doi: 10.1016/s0022-2836(63)80091-1. [DOI] [PubMed] [Google Scholar]
- Monod J, Wyman J, Changeux JP. On the Nature of Allosteric Transitions: A Plausible Model. Journal of molecular biology. 1965;12:88–118. doi: 10.1016/s0022-2836(65)80285-6. [DOI] [PubMed] [Google Scholar]
- Najafi-Shoushtari SH, Kristo F, Li Y, Shioda T, Cohen DE, Gerszten RE, Naar AM. MicroRNA-33 and the SREBP host genes cooperate to control cholesterol homeostasis. Science. 2010;328:1566–1569. doi: 10.1126/science.1189123. [DOI] [PMC free article] [PubMed] [Google Scholar]
- Nateri AS, Riera-Sans L, Da Costa C, Behrens A. The ubiquitin ligase SCFFbw7 antagonizes apoptotic JNK signaling. Science. 2004;303:1374–1378. doi: 10.1126/science.1092880. [DOI] [PubMed] [Google Scholar]
- Onoyama I, Suzuki A, Matsumoto A, Tomita K, Katagiri H, Oike Y, Nakayama K, Nakayama KI. Fbxw7 regulates lipid metabolism and cell fate decisions in the mouse liver. J Clin Invest. 2011;121:342–354. doi: 10.1172/JCI40725. [DOI] [PMC free article] [PubMed] [Google Scholar]
- Osborne TF, Espenshade PJ. Evolutionary conservation and adaptation in the mechanism that regulates SREBP action: what a long, strange tRIP it's been. Genes Dev. 2009;23:2578–2591. doi: 10.1101/gad.1854309. [DOI] [PMC free article] [PubMed] [Google Scholar]
- Rayner KJ, Suarez Y, Davalos A, Parathath S, Fitzgerald ML, Tamehiro N, Fisher EA, Moore KJ, Fernandez-Hernando C. MiR-33 contributes to the regulation of cholesterol homeostasis. Science. 2010;328:1570–1573. doi: 10.1126/science.1189862. [DOI] [PMC free article] [PubMed] [Google Scholar]
- Reed BD, Charos AE, Szekely AM, Weissman SM, Snyder M. Genomewide occupancy of SREBP1 and its partners NFY and SP1 reveals novel functional roles and combinatorial regulation of distinct classes of genes. PLoS Genet. 2008;4:e1000133. doi: 10.1371/journal.pgen.1000133. [DOI] [PMC free article] [PubMed] [Google Scholar]
- Rottiers V, Najafi-Shoushtari SH, Kristo F, Gurumurthy S, Zhong L, Li Y, Cohen DE, Gerszten RE, Bardeesy N, Mostoslavsky R, Naar AM. MicroRNAs in metabolism and metabolic diseases. Cold Spring Harb Symp Quant Biol. 2011;76:225–233. doi: 10.1101/sqb.2011.76.011049. [DOI] [PMC free article] [PubMed] [Google Scholar]
- Sakai J, Nohturfft A, Cheng D, Ho YK, MS B, Goldstein JL. Identification of complexes between the COOH-terminal domains of sterol regulatory element-binding proteins (SREBPs) and SREBP cleavage-activating protein. J. Biol. Chem. 1997;272:20213–20221. doi: 10.1074/jbc.272.32.20213. [DOI] [PubMed] [Google Scholar]
- Seo YK, Chong HK, Infante AM, Im SS, Xie X, Osborne TF. Genomewide analysis of SREBP-1 binding in mouse liver chromatin reveals a preference for promoter proximal binding to a new motif. Proc Natl Acad Sci U S A. 2009;106:13765–13769. doi: 10.1073/pnas.0904246106. [DOI] [PMC free article] [PubMed] [Google Scholar]
- Seo YK, Jeon TI, Chong HK, Biesinger J, Xie X, Osborne TF. Genome-wide Localization of SREBP-2 in Hepatic Chromatin Predicts a Role in Autophagy. Cell Metab. 2011;13:367–375. doi: 10.1016/j.cmet.2011.03.005. [DOI] [PMC free article] [PubMed] [Google Scholar]
- Sever N, Yang T, Brown MS, Goldstein JL, DeBose-Boyd RA. Accelerated degradation of HMG CoA reductase mediated by binding of insig-1 to its sterol-sensing domain. Mol Cell. 2003;11:25–33. doi: 10.1016/s1097-2765(02)00822-5. [DOI] [PubMed] [Google Scholar]
- Sheng Z, Otani H, Brown MS, Goldstein JL. Independent regulation of sterol regulatory element-binding proteins 1 and 2 in hamster liver. Proc. Natl. Acad. Sci. USA. 1995;92:935–938. doi: 10.1073/pnas.92.4.935. [DOI] [PMC free article] [PubMed] [Google Scholar]
- Small EM, Olson EN. Pervasive roles of microRNAs in cardiovascular biology. Nature. 2011;469:336–342. doi: 10.1038/nature09783. [DOI] [PMC free article] [PubMed] [Google Scholar]
- Stittrich AB, Haftmann C, Sgouroudis E, Kuhl AA, Hegazy AN, Panse I, Riedel R, Flossdorf M, Dong J, Fuhrmann F, Heinz GA, Fang Z, Li N, Bissels U, Hatam F, Jahn A, Hammoud B, Matz M, Schulze FM, Baumgrass R, Bosio A, Mollenkopf HJ, Grun J, Thiel A, Chen W, Hofer T, Loddenkemper C, Lohning M, Chang HD, Rajewsky N, Radbruch A, Mashreghi MF. The microRNA miR-182 is induced by IL-2 and promotes clonal expansion of activated helper T lymphocytes. Nat Immunol. 2010;11:1057–1062. doi: 10.1038/ni.1945. [DOI] [PubMed] [Google Scholar]
- Sun LP, Seemann J, Goldstein JL, Brown MS. Sterol-regulated transport of SREBPs from endoplasmic reticulum to Golgi: Insig renders sorting signal in Scap inaccessible to COPII proteins. Proc Natl Acad Sci U S A. 2007;104:6519–6526. doi: 10.1073/pnas.0700907104. [DOI] [PMC free article] [PubMed] [Google Scholar]
- Sundqvist A, Bengoechea-Alonso MT, Ye X, Lukiyanchuk V, Jin J, Harper JW, Ericsson J. Control of lipid metabolism by phosphorylation-dependent degradation of the SREBP family of transcription factors by SCF(Fbw7) Cell Metab. 2005;1:379–391. doi: 10.1016/j.cmet.2005.04.010. [DOI] [PubMed] [Google Scholar]
- Xu S, Witmer PD, Lumayag S, Kovacs B, Valle D. MicroRNA (miRNA) transcriptome of mouse retina and identification of a sensory organ-specific miRNA cluster. J Biol Chem. 2007;282:25053–25066. doi: 10.1074/jbc.M700501200. [DOI] [PubMed] [Google Scholar]
- Yabe D, Brown MS, Goldstein JL. Insig-2, a second endoplasmic reticulum protein that binds SCAP and blocks export of sterol regulatory element-binding proteins. Proc Natl Acad Sci U S A. 2002;99:12753–12758. doi: 10.1073/pnas.162488899. [DOI] [PMC free article] [PubMed] [Google Scholar]
- Yada M, Hatakeyama S, Kamura T, Nishiyama M, Tsunematsu R, Imaki H, Ishida N, Okumura F, Nakayama K, Nakayama KI. Phosphorylationdependent degradation of c-Myc is mediated by the F-box protein Fbw7. The EMBO journal. 2004;23:2116–2125. doi: 10.1038/sj.emboj.7600217. [DOI] [PMC free article] [PubMed] [Google Scholar]
- Yang T, Espenshade PJ, Wright ME, Yabe D, Gong Y, Aebersold R, Goldstein JL, Brown MS. Crucial step in cholesterol homeostasis: sterols promote binding of SCAP to INSIG-1, a membrane protein that facilitates retention of SREBPs in ER. Cell. 2002;110:489–500. doi: 10.1016/s0092-8674(02)00872-3. [DOI] [PubMed] [Google Scholar]
- Yokoyama C, Wang X, Briggs MR, Admon A, Wu J, Hua X, Goldstein JL, Brown MS. SREBP-1, a basic-helix-loop-helix-zipper protein that controls transcription of the low density receptor gene. Cell. 1993;75:185–197. [PubMed] [Google Scholar]
Associated Data
This section collects any data citations, data availability statements, or supplementary materials included in this article.