

Abstract
Dysregulated inflammation in adipose tissue, marked by increased proinflammatory T-cell accumulation and reduced regulatory T cells (Tregs), contributes to obesity-associated insulin resistance. The molecular mechanisms underlying T-cell-mediated inflammation in adipose tissue remain largely unknown, however. Here we show a crucial role for signal transducer and activator of transcription 3 (Stat3) in T cells in skewing adaptive immunity in visceral adipose tissue (VAT), thereby contributing to diet-induced obesity (DIO) and insulin resistance. Stat3 activity is elevated in obese VAT and in VAT-resident T cells. Functional ablation of Stat3 in T cells reduces DIO, improves insulin sensitivity and glucose tolerance, and suppresses VAT inflammation. Importantly, Stat3 ablation reverses the high Th1/Treg ratio in VAT of DIO mice that is likely secondary to elevated IL-6 production, leading in turn to suppression of Tregs. In addition, Stat3 in T cells in DIO mice affects adipose tissue macrophage accumulation and M2 phenotype. Our study identifies Stat3 in VAT-resident T cells as an important mediator and direct target for regulating adipose tissue inflammation, DIO, and its associated metabolic dysfunctions.
Chronic inflammation is increasingly appreciated as a major culprit in promoting insulin resistance and other metabolic abnormalities associated with diet-induced obesity (DIO) (1–3). At the cellular level, recent studies implicate T cells, B cells, and macrophages in promoting adipose tissue inflammation and regulating high-fat diet (HFD)-induced obesity and insulin resistance (4–6). Seminal studies have demonstrated that both CD4+ and CD8+ T-cell subsets in obese adipose tissue produce proinflammatory cytokines such as IFN-γ, which drives local inflammation and inhibits insulin signaling (7–10). B and T cells also can regulate CD11b+F4/80+ adipose tissue M1 and M2 macrophage phenotypes, which exacerbate adipose tissue inflammation (7, 9, 11). Foxp3+ regulatory T cell (Treg) populations in adipose tissue are inversely correlated with obesity (4, 9, 12), suggesting that a defect in immune tolerance also promotes obesity, inflammation, and insulin resistance. The key signaling mediators that regulate T-cell–promoted HFD-induced obesity and insulin resistance are largely unexplored, however. Thus, identification of key molecular mechanisms underlying local inflammation in DIO is of significant interest and may lead to effective strategies to treat obesity and insulin resistance.
Several transcription factors, including the signal transducer and activator of transcription (Stat) family, particularly Stat3, regulate diverse targets to drive T-cell–mediated inflammatory responses in cancer, graft-versus-host disease, and other autoimmune disorders (13–15). During cancer development, Stat3 promotes Treg recruitment and their suppressive functions in the tumor microenvironment, while inhibiting antitumor Th1-mediated immune responses (16–20). Therapeutic inhibition or genetic ablation of Stat3 in immune cells, including T cells and myeloid cells, results in robust Th1 mediators with an effective antitumor immune response in solid cancers. It was recently shown that Stat3 regulates Th1 cells in autoimmune diseases such as experimental autoimmune encephalomyelitis, and that the loss of Stat3 blunts Th17 cell populations and elevates Treg populations in these models, thereby ameliorating disease progression (21, 22). In contrast, however, in models of colitis, a disease driven by both Th17 and Th1 cells, Stat3 ablation in T cells elevates Th1 populations in spleen but may dampen their infiltration in the colon while promoting Tregs (23). The apparent paradoxical role of Stat3 in Th1/Treg balance during cancer and autoimmunity suggests that its contribution to diseases with dysregulated inflammation is highly context-dependent. Although aberrant inflammation is known to contribute to DIO, whether Stat3 signaling in T cells regulates inflammation and insulin resistance remains unknown.
In the present study, we examined the role of Stat3 in potentiating inflammation that leads to obesity and insulin resistance. Using mice lacking Stat3 in T cells, we found that Stat3 is crucial for T-cell–mediated inflammation in obese adipose tissue, and that functional ablation of Stat3 in T cells reduces DIO and improves glucose tolerance and insulin sensitivity. Stat3 in T cells of mice on a HFD promotes IFN-γ–producing CD8+ and CD4+ T cells and blunts Tregs in visceral adipose tissue (VAT). Factors secreted by obese VAT, including IL-6, suppress Treg generation in a Stat3-dependent manner, thereby provoking local inflammation. In addition, the ablation of Stat3 in T cells is accompanied by a reduction in macrophage accumulation and restoration of the M2 phenotype in VAT. Taken together, our findings suggest that T cells use Stat3 as a key mediator of adipose tissue inflammation during DIO causing insulin resistance, and may serve as an effective therapeutic target for treating obesity and its metabolic complications.
Results
Stat3 in T Cells Promotes DIO and Insulin Resistance.
To investigate the impact of Stat3 on dietary obesity, we analyzed activation of Stat3 [phosphoTyr705-Stat3 (pStat3)] in VAT of mice after 16 wk on either a low-fat diet (LFD) or a HFD. Stat3 activity was highly elevated in total VAT of mice fed a HFD compared with those fed a LFD (Fig. S1A), and appeared predominantly in crown-like structures (CLSs) in the stromal compartment of obese VAT (Fig. S1B). We next assessed Stat3 activation specifically in T cells, and found elevated pStat3 in VAT-associated CD4+ T cells in mice fed a HFD compared with those fed a LFD (Fig. S1C).
To assess the potential contributions of Stat3 signaling in T cells to DIO and insulin resistance, we fed Stat3flox/flox (Stat3+/+) and CD4-Cre/Stat3flox/flox (Stat3−/−) mice either a LFD or a HFD for 16 wk. Genomic PCR and quantitative RT-PCR (qRT-PCR) analysis of FACS-sorted immune cell subsets confirmed functional Stat3 deletion in spleen and VAT-associated CD4+ and CD8+ T cells (Fig. S2 A–C). Compared with Stat3+/+ mice, Stat3−/− mice gained less weight on a HFD, with a nearly 50% reduction in weight gain during the first 8 wk of the diet seen in both sexes (Fig. 1A). Food intake was similar in Stat3+/+ and Stat3−/− mice (Fig. S3). Stat3−/− mice had significantly lower blood glucose (Fig. 1B and Fig. S4A) and serum insulin levels compared with Stat3+/+ mice on a HFD (Fig. 1C).
Fig. 1.

Stat3 in T cells promotes DIO and insulin resistance. (A) Body weight was measured in Stat3+/+ and Stat3−/− mice on a LFD or HFD from at least two independent studies. (Left) Females, n ≥ 20 per group. (Right) Males, n ≥ 6 per group. (B) Fasting blood glucose levels measured after 12 wk on a LFD or HFD. n = 4 per group. (C) Serum insulin levels measured by ELISA after 16 wk on a LFD or HFD. n = 8 per group from two independent studies. (D) GTT performed on female mice after 12 wk on a LFD or HFD. n = 4 per group. (E) GTT performed on male mice after 6 wk on a LFD or HFD. n = 5–8 per group (F) ITT performed on mice after 14 wk on a LFD or HFD. n = 4 per group. P values indicate comparisons between Stat3+/+ and Stat3−/− mice on a HFD.
We next evaluated the impact of Stat3 in T cells on insulin sensitivity in DIO using the glucose tolerance test (GTT) and the insulin tolerance test (ITT). Stat3−/− mice demonstrated improved glucose tolerance compared with Stat3+/+ mice on a HFD (Fig. 1 D and E and Fig. S4B). Moreover, insulin sensitivity was significantly improved in Stat3−/− mice compared with Stat3+/+ mice (Fig. 1F and Fig. S4C). Stat3−/− mice demonstrated less severe fatty liver (Fig. S5 A and B), along with decreased triglyceride levels and increased activation of phosphorylated Akt, suggesting reduced lipid accumulation and improved insulin signaling, respectively, in the liver during DIO (Fig. S5 C and D). Functional ablation of Stat3 in T cells of LFD-fed mice did not affect body weight, glucose level, or insulin tolerance, indicating that regulation of T cells by Stat3 requires DIO. Collectively, these results indicate that Stat3 activation in T cells regulates HFD-induced obesity and promotes insulin resistance and glucose intolerance.
Stat3 in T Cells Promotes Adipose Tissue Inflammation.
Because T cells have been previously implicated in the regulation of adipose tissue inflammation, we next examined whether Stat3 in T cells promotes inflammation in VAT of DIO mice. Our analysis revealed significant reductions in VAT mass in Stat3−/− mice compared with Stat3+/+ mice on a HFD (Fig. 2A and Fig. S4D). Of note, VAT mass was similar in Stat3+/+ and Stat3−/− mice on a LFD. In addition, adipocyte cell diameter, determined by quantification of H&E staining in VAT, was smaller in Stat3−/− mice compared with Stat3+/+ mice on a HFD (Fig. 2B).
Fig. 2.

Stat3 in T cells promotes adipose tissue inflammation. (A) VAT mass was measured in Stat3+/+ and Stat3−/− mice after 16 wk on a LFD or HFD. n ≥12 per group from two independent studies. (B) H&E staining of VAT from Stat3+/+ and Stat3−/− mice on a LFD or HFD. (Scale bars: 100 μm.) Adipocyte cell diameter (in pixels) from 50 random cells from n = 4 mice per group are shown. Data are representative of two independent studies. (C) qRT-PCR analysis of VAT from Stat3+/+ and Stat3−/− mice after 16 wk on a LFD or HFD. mRNA expression of indicated genes was normalized with Gapdh. n = 4 per group. (D and E) ELISA of IFN-γ (D) and IL-6 (E) levels of VAT from Stat3+/+ and Stat3−/− mice on a LFD or HFD. Pooled data from n = 4 mice per group are shown as mean ± SD.
To evaluate the potential impact of T-cell–specific Stat3 on VAT inflammation and metabolism, we assessed mRNA levels of various markers of fatty acid and glucose metabolism and inflammation by qRT-PCR, focusing on mRNA levels with significant differences between mice on a LFD and those on a HFD. We found increased expression of Adipoq and Fasn in VAT of Stat3−/− mice compared with Stat3+/+ mice on a HFD (Fig. 2C). We also detected reduced Socs3, which is expressed in adipocytes and has been linked to obesity-induced insulin resistance (24, 25), and increased Socs1 expression in VAT of Stat3−/− mice compared with Stat3+/+ mice on a HFD (Fig. 2C). Expression levels of genes implicated in VAT inflammation, including Saa3, Ccl5, and Ifnγ (6, 10), were reduced in Stat3−/− mice compared with Stat3+/+ mice on a HFD, whereas expression of Il-6 remained unchanged (Fig. 2C). We confirmed protein levels of IFN-γ and IL-6 in obese VAT by ELISA (Fig. 2 D and E). Taken together, these data indicate reductions in both metabolic dysfunction and local inflammation in VAT of DIO mice lacking Stat3 in T cells.
Stat3 in T Cells Regulates Th1/Treg Balance in Adipose Tissue of DIO Mice.
To further characterize cellular mechanisms important for Stat3-regulated T-cell–driven adipose tissue inflammation, we assessed T cells and their cytokine profiles in VAT of DIO mice. Total CD8+ and CD4+ T cell numbers were significantly reduced in Stat3−/− mice compared with Stat3+/+ mice on a HFD (Fig. 3A and Fig. S6 A and B). Of note, CD4+ T cell levels were significantly elevated, whereas CD8+ T cell levels remained unchanged, in DIO mice compared with lean mice. Flow cytometry revealed modest reductions in VAT-associated CD8+ and CD4+ T-cell production of IFN-γ in Stat3−/− mice compared with Stat3+/+ mice (Fig. 3B). qRT-PCR analysis confirmed a reduced Ifnγ expression in CD8+ T cells (Fig. 3C).
Fig. 3.
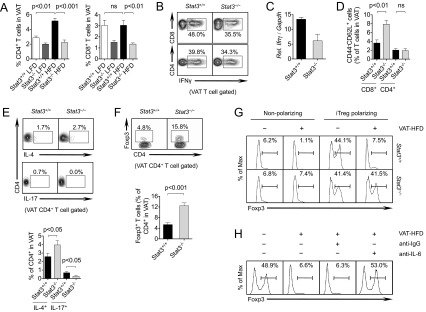
Stat3 in T cells regulates Th1/Treg balance in adipose tissue of DIO mice. (A) Flow cytometry analysis of CD4+ and CD8+ T cells in Stat3+/+ and Stat3−/− mice on a LFD or HFD. n = 12 per group from three independent studies. (B) IFN-γ production by CD4+ and CD8+ T cells in VAT. (C) qRT-PCR analysis of Ifnγ expression by CD8+ T cells in VAT of mice on a HFD. Pooled data are from FACS-sorted cells, n = 4 per group. (D) Naïve CD4+ and CD8+ T cells in VAT of mice on a HFD. n = 4 per group. (E) IL-4–producing Th2 cells and IL-17–producing Th17 cells in VAT of mice on a HFD. Representative images (Upper) and analysis of n = 7–8 per group from two independent studies (Lower) are shown. (F) Foxp3+ Tregs in VAT of mice on a HFD. Representative images (Upper) and analysis of n = 7–8 per group from two independent studies (Lower) are shown. (G) In vitro induced Treg (iTreg) polarization of splenic CD4+ T cells from Stat3+/+ and Stat3−/− mice with or without VAT- conditioned media from HFD-fed mice (VAT-HFD) for 3 d, followed by flow cytometry analysis. (H) Under similar polarizing conditions, IL-6–neutralizing antibody or IgG control antibody was added for 3 d, after which splenic CD4+ T cells were analyzed by flow cytometry. All data are representative of at least two independent studies.
VAT-associated T cells show increased memory and decreased naïve markers during the development of DIO (10, 26). Thus, we evaluated the effects of Stat3 ablation on memory phenotype in VAT, and observed a twofold increase in naïve CD62L+CD44−CD8+ T cells in Stat3−/− mice compared with Stat3+/+ mice on a HFD, with no discernible differences in CD4+ T cells (Fig. 3D).
CD4+IL-17+ (Th17) cells were significantly reduced and CD4+IL-4+ (Th2) cells were significantly increased in Stat3−/− mice compared with Stat3+/+ mice on a HFD (Fig. 3E). Analysis of T-cell subsets in Stat3+/+ and Stat3−/− mice on a LFD demonstrated increased IFN-γ production by CD4+ and CD8+ T cells in spleen (Fig. S7A), but reduced IFN-γ production in both T-cell subsets in VAT of Stat3−/− mice compared with Stat3+/+ mice under lean conditions (Fig. S7B). Of note, along with the known reduction in VAT-associated Tregs during DIO (4, 9, 12, 27), CD4+Foxp3+ Treg percentages were increased in the VAT of Stat3−/− mice compared with Stat3+/+ mice on a HFD (Fig. 3F). Spleens from Stat3−/− mice demonstrated a reduction in total CD4+ T cells and a concomitant increase in CD8+ T cells, although negligible differences were observed in Th1 and Treg populations compared with Stat3+/+ mice on a HFD (Fig. S8 A and B). These data suggest that a shift in Th1/Treg balance through ablation of Stat3 in T cells reduces local inflammation in VAT of DIO mice.
To gain insight into potentially important molecular mechanisms for Stat3-promoted Treg suppression in VAT of DIO mice, we treated splenic CD4+ T cells undergoing in vitro Treg polarization with conditioned media (VAT-HFD) collected from VAT of DIO mice. The results of these experiments show that VAT-HFD potently suppressed Treg generation in a Stat3-dependent manner (Fig. 3G). Culturing of CD4+ T cells with VAT-HFD under non-Treg polarizing conditions also revealed defective Treg populations, a situation reversed by Stat3 ablation. We also observed a concomitant reduction in Th17 generation in Stat3−/− T cells, which was promoted by VAT-HFD (Fig. S9A). We then examined whether IL-6, a potent Stat3 activator found to be elevated in VAT of DIO mice (Fig. 2 D and E), contributes to defective Treg accumulation during DIO. To that end, we depleted IL-6 from VAT-HFD, which completely restored Treg generation (Fig. 3H). Inhibition of Stat3 signaling with Stattic also reversed the inhibition of Tregs by VAT-HFD (Fig. S9B). Considered together, these findings suggest that Stat3 signaling in T cells promotes Th1 cells while reducing Tregs in VAT of mice on a HFD, and that functional ablation of Stat3 in T cells reverses the high Th1/Treg ratio in DIO mice.
Stat3 in T Cells Regulates Adipose Tissue Macrophages in DIO Mice.
Recent studies have demonstrated that T-cell–mediated inflammation in DIO mice affects adipose tissue macrophage (ATM) function, thereby contributing to obesity and insulin resistance. We examined whether Stat3 activation in T cells affects ATMs in DIO mice. Flow cytometry analysis of VAT demonstrated a significant reduction in F4/80+ ATMs in Stat3−/− mice compared with Stat3+/+ mice on a HFD (Fig. 4 A and B and Fig. S10A). ATM accumulation in VAT was reduced as detected by immunostaining (Fig. 4C), with reduced CLSs in Stat3−/− mice compared with Stat3+/+ mice on a HFD (Fig. 4D). In addition, F4/80 (Emr-1) expression was reduced in Stat3−/− VAT, whereas Cd11c expression was similar, and M2 markers Cd163 and Retnla, which were reduced in DIO mice compared with lean mice, were significantly restored in Stat3−/− mice compared with Stat3+/+ mice (Fig. 4E).
Fig. 4.

Stat3 in T cells regulates ATMs in DIO mice. (A) VAT-associated macrophages measured by flow cytometry in Stat3+/+ and Stat3−/− female mice on a HFD. n = 4 per group. (B) VAT-associated macrophages measured by flow cytometry in male mice on a HFD. n = 4 per group. (C) Histological evaluation of F4/80+ macrophages in VAT of female (Left) and male (Right) mice on a HFD. (Scale bars: 100 μm.) (D) Analysis of CLSs of F4/80+ macrophages in VAT of male mice on a LFD or HFD. n = 4 per group. (E) qRT-PCR analysis of VAT in mice on a LFD or HFD. n = 4 per group. (F) Flow cytometry analysis of M1 (CD11c) and M2 (MMR) macrophage markers in ATMs in VAT of mice on a LFD or HFD. Data are representative of two independent studies.
To further characterize the polarization of macrophages in VAT of DIO mice, we analyzed the M1 and M2 subsets by CD11c and macrophage mannose receptor (MMR) expression in ATMs, respectively. We found that DIO was associated with a significant decrease in the percentage of MMR-expressing M2 ATMs, which was partially restored by ablation of Stat3 in T cells (Fig. 4F and Fig. S10B). Percentages of CD11c+ classically activated M1 ATMs in VAT were relatively unaffected in Stat3−/− mice compared with Stat3+/+ mice on a HFD (Fig. 4F and Fig. S10C). These data suggest that Stat3 ablation in T cells reduces ATM infiltration and restores an M2 phenotype in VAT during HFD-induced obesity.
Discussion
Recent studies indicate that local adipose tissue inflammation contributes to insulin resistance and other metabolic abnormalities associated with dietary obesity (1–3, 5, 6). Although the pathological impact of both innate and adaptive immune cells, including myeloid cells, B cells, T cells, and natural killer T (NKT) cells, has been documented in DIO models (1, 7, 9, 11, 12, 28, 29), the molecular signaling pathways that mediate their effects remain largely unexplored and unclear. In the present study, we have identified the transcription factor Stat3 as an important mediator of T-cell–driven inflammation in adipose tissue of DIO mice. Although we focused on the role of Stat3 in T cells, Stat3 is likely elevated in multiple cell types in VAT of DIO mice compared with lean mice. Mice with deletion of Stat3 in T cells were significantly less obese on a HFD, and demonstrated improved insulin sensitivity and reduced local adipose tissue inflammation compared with control mice.
Although the present study focused primarily on CD4+ and CD8+ T cells, the deletion of Stat3 may occur in other T lymphoid subsets as well, such as NKT cells; further investigation of this possibility is needed. Functional ablation of Stat3 blocked CD8+ and CD4+ T-cell accumulation in VAT, and balanced the Th1 and Treg ratio in favor of Tregs. Importantly, we observed a significant impact on ATMs, with functional ablation of Stat3 in T cells reducing overall macrophage accumulation and promoting an alternatively activated M2 macrophage phenotype. These findings suggest that Stat3 links T-cell–mediated inflammation with macrophage activation, a finding that has been attributed to both CD8+ and CD4+ T cells in VAT of DIO mice.
Stat3 is recognized as a crucial factor underlying dysfunctional inflammation in multiple diseases; however, its role in these diseases is complex and highly context-dependent. For instance, in T cells, deletion of Stat3 in various autoimmune disease models was found to increase Foxp3+ Tregs along with a reduction in overall disease progression (21, 22, 30). Contrary to the unchanged or elevated IFN-γ levels from Stat3 ablation in those studies, our findings indicate that populations of Th1 and CD8+ T cells expressing IFN-γ were both reduced in VAT, whereas Foxp3+ Treg subsets were elevated. These findings suggest that in dietary obesity, Stat3 affects Th1 and Treg subsets, which are known culprits in the mediation of VAT-associated inflammation and insulin resistance. In addition to their known roles in exacerbating local inflammation, IL-6 and IFN-γ can directly inhibit insulin signaling in multiple cell types and promote insulin resistance (31–33). Although the detection of IL-17 was low in CD4+ T cells in VAT, functional ablation of Stat3 blunted their numbers, as expected. The impact of this small population of Th17 cells on obesity and insulin resistance merits further investigation, however.
Although multiple studies have implicated adaptive immune cells in promoting adipose tissue inflammation (2, 10, 26), the molecular mechanisms involved have remained largely unknown. Nonetheless, it has recently been demonstrated that peroxisome proliferator-activated receptor gamma (PPARγ) is critical in regulating T-cell–mediated inflammation in adipose tissue by promoting VAT-associated Tregs during HFD-induced obesity (27). Further, PPARγ agonists induce Treg-dependent improvements in insulin sensitivity in DIO mice. Given that PPARγ has been shown to inhibit Th17 polarization (34), a differentiation program highly positively regulated by Stat3 (21, 35), it is possible that these two important transcription factors oppose each other during T-cell–mediated VAT inflammation in DIO. However, Stat3 likely regulates multiple genes in various cell types to mediate VAT inflammation during DIO. In addition, although we observed only minimal effects of HFD-induced obesity on splenic T-cell numbers or their inflammatory profiles, whether Stat3 in T cells located in other tissues, such as muscle, liver, and the gut, also contributes to obesity and insulin resistance, remains to be explored.
Being a transcription factor, Stat3 is a difficult target to inhibit in a cell-specific manner. However, recent approaches to inhibit Stat3 using targeted platforms to deliver siRNA to specific immune cells have been explored with therapeutic success by our group (16, 36, 37). Thus, in addition to more potent and innovative small molecule inhibitors of Stat3 signaling in the near future, targeting Stat3 specifically in T cells may be an ultimate goal for treating obesity and insulin resistance. Our findings suggest a crucial role for Stat3 in mediating T-cell accumulation in adipose tissue, driving VAT inflammation and contributing to DIO and insulin resistance. Consequently, these findings highlight the importance of Stat3 in T cells as a potential therapeutic target for blunting obesity and insulin resistance.
Materials and Methods
Mice.
Mouse care and experimental procedures were performed under pathogen-free conditions in accordance with established institutional guidance and approved protocols from the Institutional Animal Care and Use Committee of Beckman Research Institute at City of Hope National Medical Center. C57BL/6 mice were purchased from Jackson Laboratory or the National Cancer Institute, Stat3flox/flox mice were obtained from Drs. Shizuo Akira and Kiyoshi Takeda (Osaka University, Osaka, Japan), and CD4-Cre mice were purchased from Taconic Farms. Functional ablation of Stat3 in T cells was accomplished as described previously (20).
Diet and Metabolic Studies.
For diet and metabolic studies, mice were fed either a LFD or a HFD (60 kcal% fat; Research Diets D12492) generally from 6 to 8 wk of age, for up to 16 wk where indicated. Body weight was measured weekly and food intake was monitored on both diets. After specified periods on a HFD, fasting blood glucose levels (OneTouch Ultra; LifeScan) levels and serum insulin concentrations (Crystal Chem ELISA) were measured. For the GTT, fasted mice (16 h) received 1 g per kg body weight of glucose i.p., and glucose levels were measured every 15–30 min for 120 min. For ITT, fasted mice (4-6 h) received 0.75 U per kg of body weight of insulin (Humulin; Eli Lilly) i.p., and glucose levels were measured every 15–30 min for 120 min. Area under the curve (AUC) analysis was performed using GraphPad Prism software.
Flow Cytometry.
Adipose tissue (carefully avoiding lymph nodes) was dissected into 1- to 5-mm3 fragments, centrifuged to remove circulating cells, and digested with collagenase type D (2 mg/mL; Roche) and DNase I (1 mg/mL; Roche) for 30–45 min at 37 °C. Digests were filtered through 70-μm cell strainers and pelleted to enrich for immune cells in stromal vascular fractions. Spleens were gently dissociated under 70-μm mesh for single-cell isolation. After RBC lysis (Sigma-Aldrich), single-cell suspensions were resuspended in FACS wash buffer (2% FBS in HBSS without magnesium, calcium, and phenol red). Cells were blocked with CD16/32 and then incubated for 30 min on ice with fluorophore-conjugated antibodies (CD3, CD4, CD8, CD25, CD44, CD45, CD62L, CD11b, CD11c, F4/80, Gr-1, Ly6C, and MMR, from eBioscience, Biolegend, or BD Biosciences). Aqua LIVE/DEAD (R) for viability was purchased from Invitrogen.
For intracellular staining, cells were fixed and permeabilized using the Foxp3 Fixation/Permeabilization Kit (eBioscience) according to the manufacturer’s protocol. After two washes, cells were stained for 30 min on ice with fluorophore-conjugated antibodies (IFN-γ, IL-4, IL-17, and Foxp3, from eBioscience, Biolegend, or BD Biosciences). Intracellular pSTAT3 staining was performed as described previously (19). Cells were washed twice before analysis on a BD LSRFortessa flow cytometer. Cell sorting was performed with a BD FACS Aria-III cell sorter with DAPI (Sigma-Aldrich) for viability. Data were analyzed with FlowJo software (TreeStar).
Immunohistochemistry.
Tissues were harvested and fixed in 3% paraformaldehyde for 24–48 h. Paraffin-embedded sections (5 μm) were deparaffinized and stained with rat anti-F4/80 (Serotec) or monoclonal rabbit anti-pY705 STAT3 (Cell Signaling) antibodies and counterstained with hematoxylin. Oil Red O staining was performed on frozen [optimal cutting temperature medium (OCT)] liver sections. Sections were examined under an Olympus AX70 automated upright microscope. CLSs were analyzed from F4/80-stained sections and quantified from one representative 10× field per mouse. Adipocyte cell diameter was examined from H&E-stained sections using the straight-line tool in ImageJ software and quantified in 50 random adipocyte cells from one representative 10× field per mouse.
Western Blot Analysis and ELISA.
For Western blot analysis, tissues were minced to a fine powder in liquid nitrogen and then lysed in 1% Nonidet P-40 lysis buffer containing protease inhibitor mixture (1:1,000, Sigma-Aldrich) and 1 mM sodium orthovanadate (Sigma-Aldrich). Protein lysates (10–20 μg) were separated by SDS/PAGE and then transferred to a PVDF membrane. Membranes were probed and reprobed using antibodies specific for mouse pSTAT3 (Tyr705; Cell Signaling), STAT3 (C-20; Santa Cruz Biotechnology), pAKT (Ser473; Cell Signaling), AKT (Cell Signaling), and β-actin (Sigma-Aldrich) and detected using an enhanced chemiluminescence substrate (Pierce). For ELISA on IFN-γ (Femto; eBioscience) and IL-6 (R&D Systems), VAT was harvested and minced into 1- to 5-mm3 fragments, and 100 mg total tissue was cultured in 1 mL serum-free DMEM for 24 h. Supernatants were filtered through a 0.22-μm filter and stored at −80 °C until analysis.
In Vitro Treg Polarization.
CD4+ T cells were positively enriched (EasySep; Stem Cell Technologies) from spleens of C57BL/6 mice or Stat3+/+ and Stat3−/− mice, then FACS-sorted for CD62L+ and CD25− cells. Naïve T cells were cultured on 96-well plates coated with 1 μg/mL anti-CD3 (eBioscience) in complete DMEM media (10% FBS) containing soluble 1 μg/mL anti-CD28 (eBioscience), 1 ng/mL human TGF-β (Peprotech), and 5 ng/mL murine IL-2 (BD Biosciences). Conditioned media (VAT-HFD) prepared from VAT of HFD-fed mice was added (15% VAT-HFD in media) where indicated. IL-6 was depleted from VAT-HFD with neutralizing antibodies (BD Biosciences) for 30 min at 4 °C. Stattic (Sigma-Aldrich) was added at 1 μM. After 3 d, cells were restimulated with 50 ng/mL PMA (Sigma-Aldrich), 0.5 μg/mL ionomycin (Sigma-Aldrich), and monensin (Biolegend) for 4 h before analysis by flow cytometry.
Quantitative RT-PCR
Quantitative RT-PCR (qRT-PCR) was performed as described previously (38). In brief, tissues were minced as stated above, and RNA was extracted using column purification (Qiagen RNeasy or Ambion RNAqueous micro kit). cDNA was prepared using a Bio-Rad cDNA synthesis kit. qRT-PCR was performed using Bio-Rad SYBR Green Supermix. Primers were generated using SciTools (Integrated DNA Technologies), PubMed-blasted for specificity, and validated across a dynamic range of interest with a single melting peak.
Statistical Analysis
Data are presented as mean ± SEM unless stated otherwise. Statistical comparisons among groups were performed using the unpaired two-tailed Student t test to calculate P values. *P < 0.05; **P < 0.01; ***P < 0.001. Adipocyte cell diameter was compared using the Mann–Whitney U test.
Supplementary Material
Acknowledgments
We thank staff members at the Light Microscopy Core, Pathology Core, Flow Cytometry Core, and Animal Facility Core at the Beckman Research Institute, City of Hope Comprehensive Cancer Center for excellent technical assistance, as well as other colleagues at City of Hope, including Dr. Claudia Kowolik and Szu-Min Lin, for their assistance. This work is partially funded by grants for the study of obesity, inflammation, and cancer awarded by the Women’s Cancer Program and through seed funds for the study of diabetes from the Beckman Research Institute at City of Hope.
Footnotes
The authors declare no conflict of interest.
This article contains supporting information online at www.pnas.org/lookup/suppl/doi:10.1073/pnas.1311557110/-/DCSupplemental.
References
- 1.Chawla A, Nguyen KD, Goh YP. Macrophage-mediated inflammation in metabolic disease. Nat Rev Immunol. 2011;11(11):738–749. doi: 10.1038/nri3071. [DOI] [PMC free article] [PubMed] [Google Scholar]
- 2.Lumeng CN, Saltiel AR. Inflammatory links between obesity and metabolic disease. J Clin Invest. 2011;121(6):2111–2117. doi: 10.1172/JCI57132. [DOI] [PMC free article] [PubMed] [Google Scholar]
- 3.Shu CJ, Benoist C, Mathis D. The immune system’s involvement in obesity-driven type 2 diabetes. Semin Immunol. 2012;24(6):436–442. doi: 10.1016/j.smim.2012.12.001. [DOI] [PMC free article] [PubMed] [Google Scholar]
- 4.Cipolletta D, Kolodin D, Benoist C, Mathis D. Tissular T(regs): A unique population of adipose tissue-resident Foxp3+CD4+ T cells that impacts organismal metabolism. Semin Immunol. 2011;23(6):431–437. doi: 10.1016/j.smim.2011.06.002. [DOI] [PubMed] [Google Scholar]
- 5.Sell H, Habich C, Eckel J. Adaptive immunity in obesity and insulin resistance. Nat Rev Endocrinol. 2012;8(12):709–716. doi: 10.1038/nrendo.2012.114. [DOI] [PubMed] [Google Scholar]
- 6.Winer S, Winer DA. The adaptive immune system as a fundamental regulator of adipose tissue inflammation and insulin resistance. Immunol Cell Biol. 2012;90(8):755–762. doi: 10.1038/icb.2011.110. [DOI] [PubMed] [Google Scholar]
- 7.Nishimura S, et al. CD8+ effector T cells contribute to macrophage recruitment and adipose tissue inflammation in obesity. Nat Med. 2009;15(8):914–920. doi: 10.1038/nm.1964. [DOI] [PubMed] [Google Scholar]
- 8.Strissel KJ, et al. T-cell recruitment and Th1 polarization in adipose tissue during diet-induced obesity in C57BL/6 mice. Obesity (Silver Spring) 2010;18(10):1918–1925. doi: 10.1038/oby.2010.1. [DOI] [PMC free article] [PubMed] [Google Scholar]
- 9.Winer S, et al. Normalization of obesity-associated insulin resistance through immunotherapy. Nat Med. 2009;15(8):921–929. doi: 10.1038/nm.2001. [DOI] [PMC free article] [PubMed] [Google Scholar]
- 10.Yang H, et al. Obesity increases the production of proinflammatory mediators from adipose tissue T cells and compromises TCR repertoire diversity: Implications for systemic inflammation and insulin resistance. J Immunol. 2010;185(3):1836–1845. doi: 10.4049/jimmunol.1000021. [DOI] [PMC free article] [PubMed] [Google Scholar]
- 11.Winer DA, et al. B cells promote insulin resistance through modulation of T cells and production of pathogenic IgG antibodies. Nat Med. 2011;17(5):610–617. doi: 10.1038/nm.2353. [DOI] [PMC free article] [PubMed] [Google Scholar]
- 12.Feuerer M, et al. Lean, but not obese, fat is enriched for a unique population of regulatory T cells that affect metabolic parameters. Nat Med. 2009;15(8):930–939. doi: 10.1038/nm.2002. [DOI] [PMC free article] [PubMed] [Google Scholar]
- 13.Egwuagu CE. STAT3 in CD4+ T helper cell differentiation and inflammatory diseases. Cytokine. 2009;47(3):149–156. doi: 10.1016/j.cyto.2009.07.003. [DOI] [PMC free article] [PubMed] [Google Scholar]
- 14.Takatori H, Kanno Y, Chen Z, O’Shea JJ. New complexities in helper T cell fate determination and the implications for autoimmune diseases. Mod Rheumatol. 2008;18(6):533–541. doi: 10.1007/s10165-008-0099-z. [DOI] [PMC free article] [PubMed] [Google Scholar]
- 15.Yu H, Pardoll D, Jove R. STATs in cancer inflammation and immunity: A leading role for STAT3. Nat Rev Cancer. 2009;9(11):798–809. doi: 10.1038/nrc2734. [DOI] [PMC free article] [PubMed] [Google Scholar]
- 16.Herrmann A, et al. Targeting Stat3 in the myeloid compartment drastically improves the in vivo antitumor functions of adoptively transferred T cells. Cancer Res. 2010;70(19):7455–7464. doi: 10.1158/0008-5472.CAN-10-0736. [DOI] [PMC free article] [PubMed] [Google Scholar]
- 17.Kong LY, et al. A novel phosphorylated STAT3 inhibitor enhances T cell cytotoxicity against melanoma through inhibition of regulatory T cells. Cancer Immunol Immunother. 2009;58(7):1023–1032. doi: 10.1007/s00262-008-0618-y. [DOI] [PMC free article] [PubMed] [Google Scholar]
- 18.Kortylewski M, et al. Inhibiting Stat3 signaling in the hematopoietic system elicits multicomponent antitumor immunity. Nat Med. 2005;11(12):1314–1321. doi: 10.1038/nm1325. [DOI] [PubMed] [Google Scholar]
- 19.Kortylewski M, et al. Regulation of the IL-23 and IL-12 balance by Stat3 signaling in the tumor microenvironment. Cancer Cell. 2009;15(2):114–123. doi: 10.1016/j.ccr.2008.12.018. [DOI] [PMC free article] [PubMed] [Google Scholar]
- 20.Kujawski M, et al. Targeting STAT3 in adoptively transferred T cells promotes their in vivo expansion and antitumor effects. Cancer Res. 2010;70(23):9599–9610. doi: 10.1158/0008-5472.CAN-10-1293. [DOI] [PMC free article] [PubMed] [Google Scholar]
- 21.Harris TJ, et al. Cutting edge: An in vivo requirement for STAT3 signaling in TH17 development and TH17-dependent autoimmunity. J Immunol. 2007;179(7):4313–4317. doi: 10.4049/jimmunol.179.7.4313. [DOI] [PubMed] [Google Scholar]
- 22.Liu X, Lee YS, Yu CR, Egwuagu CE. Loss of STAT3 in CD4+ T cells prevents development of experimental autoimmune diseases. J Immunol. 2008;180(9):6070–6076. doi: 10.4049/jimmunol.180.9.6070. [DOI] [PMC free article] [PubMed] [Google Scholar]
- 23.Durant L, et al. Diverse targets of the transcription factor STAT3 contribute to T cell pathogenicity and homeostasis. Immunity. 2010;32(5):605–615. doi: 10.1016/j.immuni.2010.05.003. [DOI] [PMC free article] [PubMed] [Google Scholar]
- 24.Palanivel R, et al. Reduced Socs3 expression in adipose tissue protects female mice against obesity-induced insulin resistance. Diabetologia. 2012;55(11):3083–3093. doi: 10.1007/s00125-012-2665-3. [DOI] [PMC free article] [PubMed] [Google Scholar]
- 25.Yang SJ, Xu CQ, Wu JW, Yang GS. SOCS3 inhibits insulin signaling in porcine primary adipocytes. Mol Cell Biochem. 2010;345(1-2):45–52. doi: 10.1007/s11010-010-0558-7. [DOI] [PubMed] [Google Scholar]
- 26.Vandanmagsar B, et al. The NLRP3 inflammasome instigates obesity-induced inflammation and insulin resistance. Nat Med. 2011;17(2):179–188. doi: 10.1038/nm.2279. [DOI] [PMC free article] [PubMed] [Google Scholar]
- 27.Cipolletta D, et al. PPAR-γ is a major driver of the accumulation and phenotype of adipose tissue Treg cells. Nature. 2012;486(7404):549–553. doi: 10.1038/nature11132. [DOI] [PMC free article] [PubMed] [Google Scholar]
- 28.Lynch L, et al. Adipose tissue invariant NKT cells protect against diet-induced obesity and metabolic disorder through regulatory cytokine production. Immunity. 2012;37(3):574–587. doi: 10.1016/j.immuni.2012.06.016. [DOI] [PMC free article] [PubMed] [Google Scholar]
- 29.Wu L, et al. Activation of invariant natural killer T cells by lipid excess promotes tissue inflammation, insulin resistance, and hepatic steatosis in obese mice. Proc Natl Acad Sci USA. 2012;109(19):E1143–E1152. doi: 10.1073/pnas.1200498109. [DOI] [PMC free article] [PubMed] [Google Scholar]
- 30.Goodman WA, et al. IL-6 signaling in psoriasis prevents immune suppression by regulatory T cells. J Immunol. 2009;183(5):3170–3176. doi: 10.4049/jimmunol.0803721. [DOI] [PMC free article] [PubMed] [Google Scholar]
- 31.McGillicuddy FC, et al. Interferon gamma attenuates insulin signaling, lipid storage, and differentiation in human adipocytes via activation of the JAK/STAT pathway. J Biol Chem. 2009;284(46):31936–31944. doi: 10.1074/jbc.M109.061655. [DOI] [PMC free article] [PubMed] [Google Scholar]
- 32.Wada T, et al. Both type I and II IFN induce insulin resistance by inducing different isoforms of SOCS expression in 3T3-L1 adipocytes. Am J Physiol Endocrinol Metab. 2011;300(6):E1112–E1123. doi: 10.1152/ajpendo.00370.2010. [DOI] [PubMed] [Google Scholar]
- 33.Rotter V, Nagaev I, Smith U. Interleukin-6 (IL-6) induces insulin resistance in 3T3-L1 adipocytes and is, like IL-8 and tumor necrosis factor-alpha, overexpressed in human fat cells from insulin-resistant subjects. J Biol Chem. 2003;278(46):45777–45784. doi: 10.1074/jbc.M301977200. [DOI] [PubMed] [Google Scholar]
- 34.Klotz L, et al. The nuclear receptor PPAR gamma selectively inhibits Th17 differentiation in a T cell-intrinsic fashion and suppresses CNS autoimmunity. J Exp Med. 2009;206(10):2079–2089. doi: 10.1084/jem.20082771. [DOI] [PMC free article] [PubMed] [Google Scholar]
- 35.Chaudhry A, et al. CD4+ regulatory T cells control TH17 responses in a Stat3-dependent manner. Science. 2009;326(5955):986–991. doi: 10.1126/science.1172702. [DOI] [PMC free article] [PubMed] [Google Scholar]
- 36.Zhang Q, et al. TLR9-mediated siRNA delivery for targeting of normal and malignant human hematopoietic cells in vivo. Blood. 2013;121(8):1304–1315. doi: 10.1182/blood-2012-07-442590. [DOI] [PMC free article] [PubMed] [Google Scholar]
- 37.Kortylewski M, et al. In vivo delivery of siRNA to immune cells by conjugation to a TLR9 agonist enhances antitumor immune responses. Nat Biotechnol. 2009;27(10):925–932. doi: 10.1038/nbt.1564. [DOI] [PMC free article] [PubMed] [Google Scholar]
- 38.Priceman SJ, et al. Targeting distinct tumor-infiltrating myeloid cells by inhibiting CSF-1 receptor: Combating tumor evasion of antiangiogenic therapy. Blood. 2010;115(7):1461–1471. doi: 10.1182/blood-2009-08-237412. [DOI] [PMC free article] [PubMed] [Google Scholar]
Associated Data
This section collects any data citations, data availability statements, or supplementary materials included in this article.