

SUMMARY
Neurons in the medial superior olive (MSO) enable sound localization by their remarkable sensitivity to submillisecond interaural time differences (ITDs). Each MSO neuron has its own “best ITD” to which it responds optimally. A difference in physical path length of the excitatory inputs from both ears cannot fully account for the ITD tuning of MSO neurons. As a result, it is still debated how these inputs interact and whether the segregation of inputs to opposite dendrites, well-timed synaptic inhibition, or asymmetries in synaptic potentials or cellular morphology further optimize coincidence detection or ITD tuning. Using in vivo whole-cell and juxtacellular recordings, we show here that ITD tuning of MSO neurons is determined by the timing of their excitatory inputs. The inputs from both ears sum linearly, whereas spike probability depends nonlinearly on the size of synaptic inputs. This simple coincidence detection scheme thus makes accurate sound localization possible.
INTRODUCTION
Sixty-five years ago, Jeffress proposed a cellular model to explain how ITDs are used to localize sounds (Jeffress, 1948). He postulated neurons that fired when inputs from both ears arrived at the same time. He further postulated delay lines introducing different travel times of inputs from either ear which would allow these coincidence detectors to be specifically tuned to certain ITDs. Experimental work showed that principal neurons of the MSO fulfil many of the predictions of his model, including tuning for certain ITDs (Goldberg and Brown, 1969; Spitzer and Semple, 1995; Yin and Chan, 1990). Because these cells are such good coincidence detectors, they have even been compared to logical AND gates (Herz et al., 2006).
It has been very difficult to record the synaptic inputs of MSO neurons in vivo because of their location in the ventral brainstem, the large field responses (Biedenbach and Freeman, 1964; Galambos et al., 1959; Mc Laughlin et al., 2010), unusually low input resistance, fast time course of synaptic potentials (Mathews et al., 2010), and the small size of the somatic action potentials (Scott et al., 2007; Scott et al., 2005), which altogether make it harder to distinguish between synaptic potentials and action potentials during in vivo extracellular recordings from the somatic region. Consequently, two aspects of Jeffress’ theory are still disputed (reviewed in Ashida and Carr, 2011; Grothe et al., 2010). The first involves the anatomical arrangement of the inputs from both ears, which are segregated to opposite dendrites (Grothe et al., 2010). It has been proposed that this arrangement favours binaural inputs over monaural inputs, since it would be difficult for monaural inputs to reach threshold owing to the current sink of the non-stimulated dendrite (Agmon-Snir et al., 1998). This would explain how MSO neurons can be such efficient coincidence detectors, being driven much more effectively by optimal binaural stimuli than by monaural sounds (Goldberg and Brown, 1969; Langford, 1984; Spitzer and Semple, 1995; Yin and Chan, 1990). In an alternative model, inputs from both ears sum linearly, but the efficient coincidence detection results from a non-linear relation between the number of simultaneous inputs and spike probability (Colburn et al., 1990). The other area of debate involves the mechanisms causing most MSO neurons to be preferentially activated by contralaterally leading sounds. Difficulties in matching the observed path lengths with the distribution of “best delays” (Beckius et al., 1999; Karino et al., 2011; Seidl et al., 2010), have inspired alternative models to the anatomical delay lines of Jeffress’ theory. A subject for debate is whether the arrival of the excitatory inputs determines ITD tuning, as Jeffress (1948) originally proposed. In addition to the excitatory inputs originating from the spherical bushy cells of ipsi- and contralateral cochlear nuclei, the MSO neurons also receive prominent glycinergic inhibitory inputs on soma and proximal dendrites arising mainly from the medial nucleus of the trapezoid body (MNTB; contralateral ear), but also from the lateral nucleus of the trapezoid body (LNTB; ipsilateral ear; reviewed in Grothe et al., 2010). Pharmacologically blocking the inhibitory inputs to the MSO neurons can shift the best ITD from contralaterally leading towards 0 μs (Brand et al., 2002; Pecka et al., 2008). To explain this observation, a model has been proposed in which brief IPSPs activated by contralateral sounds immediately precede the EPSPs, thus delaying the triggering of the action potential (Brand et al., 2002; Pecka et al., 2008). This well-timed inhibition model predicts a significant phase-dependent interaction between the postsynaptic potentials of both ears for in vivo recordings. A second model which also proposes a central role for the MSO neurons in shaping the internal delays is based on an interaural disparity in EPSP slopes, the contralateral inputs being less effective in triggering spikes because their slower risetime leads to larger activation of low-threshold potassium channels. The interaural disparity in risetimes would then favor instances in which the more effective ipsilateral inputs arrive first (Jercog et al., 2010). This model predicts a difference in slope between postsynaptic potentials of both ears for in vivo recordings. A third model assumes an interaural asymmetry in the delay between ipsi- and contralateral EPSPs and generation of action potentials (Zhou et al., 2005). This model predicts during in vivo recordings a difference in the delay between ipsi- and contralateral EPSPs and the respective APs they trigger. A test of these different models therefore requires direct recording of the inputs of MSO neurons in vivo. To investigate how signals from both ears interact in MSO neurons, we made juxtacellular (loose-patch) and whole-cell recordings from principal neurons of the low-frequency area of the MSO in gerbils, which, like humans, use ITDs for sound localization (Heffner and Heffner, 1988; Maier and Klump, 2006).
RESULTS
Juxtacellular recordings can resolve inputs to MSO neurons
We used a ventral approach to make juxtacellular (loose-patch) recordings from principal neurons of the low-frequency area of the somatic layer of the gerbil MSO (Figures 1 and S1). We studied binaural interactions using “binaural beat” stimuli (Yin and Chan, 1990), for which the tone frequencies always differed by 4 Hz between the ears. The 4-Hz beat causes the interaural phase difference (IPD) to change continuously over the 250-ms beat period. In all MSO cells, binaural beats triggered complex responses (Figure 1A, B). Remarkably, rapid, positive fluctuations were also observed in the absence of sound stimulation (Figure 1D). These spontaneous fluctuations were smaller than the tone-evoked fluctuations. They depended critically on pipette position, since they disappeared upon withdrawal of the pipette. The estimated half width of these spontaneous events was 415 ± 73 μs (mean ± standard deviation; n = 19 cells), similar to EPSPs measured in slice recordings (Scott et al., 2005). We therefore interpret these randomly timed events as the postsynaptic response to the spontaneous activity of spherical bushy cells (SBCs), the main excitatory inputs to MSO. The extracellularly recorded EPSPs (eEPSPs) could not be well delineated owing to their high rate. Lower bound estimates of spontaneous input rates were obtained by peak counting. In most (14/19) cells, peak rate exceeded 500/s.
Figure 1. Juxtacellular recordings in MSO.

(A) Juxtacellular recording from a neuron in the somatic layer of the MSO, which was identified based on field potentials (Figure S1), showing the response to a 4-Hz binaural beat (700/704 Hz tone; 50 dB SPL). Stimulus presentation is marked by the blue bar. (B) Short segment of the recording of (A). Two action potentials are marked with red dots. (C) Time derivative of segment shown in (B) illustrating that action potentials can be identified based on their steep downward slopes. (D) Segment of spontaneous activity of the same cell. (E) Bimodal distribution of downward slopes, enabling the distinction of subthreshold events (blue) and action potentials (red). Green line indicates threshold criterion. (F) Action potentials time-aligned on the preceding EPSPs. Smaller EPSPs result in larger EPSP-AP latencies. (G) Scatter plot of EPSP-AP latency versus EPSP magnitude. Characteristic frequency (CF): 680 Hz.
During tone stimulation, the size of the events increased (Figure 1B). Half width of tone-evoked events was 438 ± 73 μs. The largest events triggered extracellularly recorded action potentials (eAPs). These events had an amplitude of 1.0 ± 0.5 mV and a maximum rate of rise of 6.4 ± 3.1 V/s. eAPs were generally small, sometimes even smaller than the eEPSPs that triggered them, in agreement with the small size of somatic APs in whole-cell slice recordings (Scott et al., 2005), which is caused by restricted invasion of the somatodendritic compartment by the backpropagating axonal AP (Scott et al., 2007). Nevertheless, eAPs could be readily identified by their steep downward slope immediately following the peak (Figure 1C, E). The latency between eEPSPs and eAPs was inversely related to eEPSP size (Figure 1F, G); on average it was 168 ± 20 μs (n = 19 cells), with an average coefficient of variation of 0.24. Spontaneous rates ranged from 0 sp/s (5/19 cells) to 12.5 sp/s, (median value 0.4 sp/s), comparable to estimates from extracellular recordings (Goldberg and Brown, 1969; Yin and Chan, 1990).
Relation between juxtacellular and whole-cell recordings
The highly unusual properties of the principal neurons were also observed in whole-cell recordings in vivo. A total of 3 neurons were recorded for a sufficiently long period to allow binaural beat stimulation (Figure 2A–C). Membrane potential was −60 ± 3 mV (n = 3). Spontaneous fluctuations were observed with half widths that were somewhat larger than juxtacellularly recorded spontaneous fluctuations (Figure 2D). The smallest events could not be identified unambiguously, but using a minimum amplitude criterion of 0.5 mV, we estimated average rates of about 900 events/s. These events had half widths of 608 ± 142 μs. During binaural beat stimulation, the size of the EPSPs increased and they showed good phase locking (Figure 2A, B). Tone-evoked EPSPs had a half width of 601 ± 122 μs. The largest EPSPs evoked APs. APs had an average amplitude of only 8.5 ± 1.3 mV (n = 3), but could be reliably identified based on their faster rate of repolarization (Figure 2C). Suprathreshold EPSPs had an estimated average amplitude of 4.6 ± 1 mV and a maximum rate of rise of 20.2 ± 3.7 V/s. The estimated delay between EPSPs and APs was 216 ± 34 μs. Juxtacellular recordings provide a measure for the local membrane currents, which consists of a resistive component, which is proportional to the intracellular membrane potential and a capacitive component, which is proportional to the first derivative of the membrane potential (Freygang and Frank, 1959; Lorteije et al., 2009). A comparison of juxtacellular and whole-cell recordings indeed suggests that the shape of EPSPs and APs in juxtacellular recordings (Figure 1B) was intermediate between membrane potentials (Figure 2B) and their first derivative (Figure 2C).
Figure 2. Whole-cell recordings in MSO.

(A–D) shows an in-vivo whole cell recording; (EG) illustrates the relation between a juxtacellular and a whole-cell recording obtained from a paired recording in brainstem slices. (A) Response to a 700/704-Hz, 40-dB-SPL binaural beat from an MSO neuron with a CF of 790 Hz. Resting membrane potential was −60 mV. (B) Short segment of the trace shown in (A). Two action potentials are marked by red dots. (C) Time derivative of the trace shown in (B), illustrating the faster repolarization phase of action potentials. (D) Segment of spontaneous activity of the same cell. (E) Simultaneous whole-cell and juxtacellular recordings of principal neuron in MSO slice showing EPSPs evoked from ipsilateral afferent stimulation, which in some cases triggered APs. (F) Relation between juxtacellular and intracellular peak EPSP amplitudes. Solid line shows line fit (r = 0.994). (G) The juxtacellularly recorded EPSP (black trace) can be well approximated by the sum (red trace) of a scaled version of the membrane potential (blue trace; resistive coupling constant 298 mV/V) and a scaled version of the time derivative of the membrane potential (green trace; capacitive coupling constant 8.2 μV/V/s).
To test whether juxtacellular potentials can be used in a quantitative manner, we made simultaneous juxtacellular and whole-cell current-clamp recordings from MSO principal neurons in electrophysiologically mature gerbil slices (Scott et al., 2007). Spontaneous inputs as shown in Figure 1C and 2D were not observed, in agreement with previous slice recordings from the MSO. Comparison of the shape of EPSPs evoked by afferent stimulation in juxtacellular (eEPSP) and whole-cell recordings (iEPSP) showed that the juxtacellular recordings could be approximated by a mixture of a scaled-down version of the intracellular membrane potential and its time derivative. The relative contribution of both components varied between cells. An example with a relatively large resistive component is shown in Figure 2E. In 9 cells in which EPSPs were afferently evoked, the resistive coupling constant was 127 ± 96 mV/V and the capacitive coupling constant was 5.6 ± 5.1 μV/V/s. The relation between the amplitude of iEPSPs and eEPSPs was linear (Figure 2F); average correlation was r = 0.945 ± 0.036 (n = 9). Linearity was also excellent for IPSPs, which were evoked by conductance clamp (r = 0.991 ± 0.015; n = 5; Figure S2A, B). To further evaluate the linearity of the relation between intracellular and extracellular amplitudes, we injected intracellular depolarizing and hyperpolarizing currents, which showed that peak amplitudes were linearly related in the voltage range between −50 and −70 mV (r = 0.989 ± 0.010; n = 6), but that outside this range, the relation changed, probably because of a voltage-dependent change in the resistive component of the juxtacellular membrane currents (Figure S2C, D). Because of the limited voltage range over which the membrane potentials operated in vivo (Figure 2A, B), we conclude that in vivo juxtacellular recordings can be used to quantify subthreshold activity in the MSO.
ITD tuning of MSO neurons can be predicted from their inputs
In Figure 3A (black circles), the number of triggered spikes of the recording of Figure 1A is plotted against ITD, showing a “best ITD” of 200 μs, a “worst ITD” of about −500 μs, and a vector strength (a measure for phase locking to the binaural beat) of 0.78. The best ITD of single MSO cells was not constant, but often varied considerably with frequency (Figure S4), providing evidence against the explanation of best ITDs solely by delay lines (Day and Semple, 2011). Population data of best ITD showed a bias for contralateral lead (91 ± 282 μs; n = 285; Figure 3B), and 43% of the best ITDs were outside the physiologically relevant ITD range of the gerbil of ~130 μs (Brand et al., 2002; Day and Semple, 2011; Pecka et al., 2008; Spitzer and Semple, 1995). Such tuning beyond the physiological range is consistent with the idea that ITDs follow a “slope” code (Grothe et al., 2010).
Figure 3. ITD tuning of MSO cells and their subthreshold input.

(A) Relation between number of triggered spikes and ITD for the recording shown in Figure 1A. Arrow indicates the best ITD at +200 μs. Green line, peak of subthreshold potential against ITD (see text). (B) Histogram of best ITD values. The histogram was compiled from the 285 binaural-beat recordings (from 19 cells, CFs ranging from 300 Hz to 930 Hz, median 560 Hz) that showed significant (Rayleigh test, p < 0.001) phase locking to the 4-Hz beat frequency. Vertical green lines mark the ±130 μs physiological range of ITDs. (C) Phase-locked averaging of recordings. After removal of the action potentials, the same binaural beat response was divided in snippets having either the 700-Hz period of the ipsilateral stimulus (left) or the 704-Hz contralateral period (right), yielding the ipsi- and contralateral cycle-averages shown in the bottom traces. (D) Two-dimensional representation of subthreshold input (colored contours; 0.2-mV spacing) as a function of both monaural phases, obtained by averaging over repeated instants during the stimulation with the same combination of ipsi- and contralateral phase. White dots: eAPs from the same recording. (E) Scatter plot of measured best IPDs against predictions derived from subthreshold input.
To resolve whether ITD tuning can be predicted from the inputs (Jeffress, 1948), we determined the cycle-averaged subthreshold response for both ears. We removed the eAPs and separately averaged the recording across the cycles of the respective frequencies presented to each ear (Figure 3C). The latency between the peaks of the two averages thus obtained was 190 μs, close to the observed best ITD of 200 μs.
During its 250-ms cycle, the 4-Hz binaural beat stimulus traverses all possible combinations of ipsi- and contralateral phase, allowing a two-dimensional representation of the subthreshold input as a function of both monaural phases (Figure 3D). The horizontal and vertical ridges in this graph reveal the phase locking of the binaural subthreshold response to the ipsi- and contralateral tone, respectively. The crossing point of these ridges combines the favored phases of both ears, and the peak created by this combination of monaural phases is where one expects the eAPs. The actual timing of eAPs (white dots in Figure 3D) was slightly offset relative to the peak. The direction and magnitude of this offset represents an average latency of 158 μs between peak subthreshold input and APs, consistent with the average EPSP-AP latency of this recording of 173 μs. Thus, Figure 3D shows that subthreshold responses predicted ITD tuning well.
ITD tuning of MSO neurons is complex
Binaural tuning of the subthreshold input was further analyzed by determining, for each value of IPD, the peak potential of the portions of the recording corresponding to that IPD, (i.e., the maximum across diagonal sections of Figure 3D). The IPD-dependence of this peak potential is shown in Figure 3A (green line) along with the cycle histogram of eAPs. Again, the binaural tuning of the spikes matches the binaural tuning of the subthreshold input quite well. Figure 3E compares measured best ITDs with predictions from the subthreshold input (as exemplified by the peak of the green curve in Figure 3A) for all our recordings having significant (Rayleigh test, p < 0.001; 22 cells, including 3 cells recorded in whole-cell mode) binaural tuning. The correlation r = 0.84 confirms the predictability of binaural tuning from the monaural inputs.
The shape of the cycle-averaged subthreshold inputs varied with stimulus frequency (Figures 4A and S5), higher frequencies yielding sinusoidal shapes similar to the intracellularly recorded subthreshold waveforms in nucleus laminaris cells of the barn owl (Funabiki et al., 2011). Responses to low-frequency (<500 Hz) stimuli often showed multiple peaks per tone cycle (e.g., Figure 4A, 200/204-Hz responses). Analysis of SBC recordings previously recorded in our lab suggested that multiple peaks could already be present in individual inputs to the MSO neurons (Figure S6). Interestingly, the multiple peaks were often matched between the inputs of both ears (Figures 4A and S3). We also expanded the analysis of binaural tuning of the subthreshold input (green curve in Figure 3A) to multiple frequencies (Figure 4B). When displayed as contour plots (Figure 4C–E), these data yield a binaural receptive field, in which the effects of stimulus frequency and interaural phase are combined. If a constant, frequency-independent time difference between the inputs existed, the binaural receptive field would show a single, elongated ridge having a skewed orientation (Figure 4F), because a fixed delay causes a phase shift that is proportional to frequency. The actual binaural receptive fields (Figure 4C–E) do not have this simple form, revealing the complex, frequency-dependent, binaural tuning of the subthreshold inputs.
Figure 4. MSO neurons show complex ITD tuning.

(A) Cycle-averaged subthreshold input (as in Figure 3C), multiple frequencies tested. Lowest frequencies show multiple, interaurally matched, preferred latencies in the inputs from both ears. (B) Binaural tuning and its prediction from subthreshold inputs (as in Figure 3A), multiple frequencies tested. Spike count curves (black symbols) were normalized to the peak subthreshold potential (green lines) to facilitate comparing of their binaural tuning. (C–E) Binaural receptive fields for three MSO neurons (CF = 420, 680, 790 Hz). The peak subthreshold input is shown as a function of both IPD and stimulus frequency, thus combining IPD tuning and frequency tuning of the subthreshold input. Spacing of contours is 0.05 mV. (F) Simple ITD tuning of a hypothetical MSO cell tuned at 500 Hz having a constant, frequency-independent best ITD of 250 μs. The constant best ITD corresponds to a best IPD that is proportional to the stimulus frequency.
Linear summation of inputs from both ears
The ability to measure the inputs to the MSO neurons in vivo allowed us to test how inputs from both ears sum. To this end, we compared the measured averaged response during the beat cycle with the prediction from a purely linear interaction of the monaural contributions obtained by averaging across the respective ipsi- and contralateral tones (Figure 5A, Movie S1). The observed responses closely followed the linear prediction, which accounted for 97.9 % of the variance. The success of the linear prediction was a general finding, and was observed for both juxtacellular and whole-cell recordings (Figures 5B, S7). Careful inspection of the raw traces did not reveal fast, downward going events that specifically preceded the positive events, both in whole-cell and in juxtacellular recordings (Figures 2B, S3). Simultaneous juxta- and whole-cell slice recordings indicated that the resolution of the juxtacellular recordings allows detecting IPSPs with an amplitude <1 mV (Figure S2). We therefore did not find evidence for well-timed inhibition, nor for a substantial effect of the current sink presented by the non-stimulated dendrite. To further test this linearity, we compared the binaural beat response with the responses to monaural stimulation using the same tones as in the binaural beat stimuli (Figure 5C). Summing the monaural responses provided an excellent prediction of the binaural responses (Figure 5D), accounting for 95.5% of the variance. The small deviations are analyzed in Figure S7.
Figure 5. Inputs from both ears sum linearly.

(A) 2D representation of the subthreshold inputs (left), with eAPs indicated as white dots. Right panel is the prediction of a purely linear interaction obtained by adding the cycle averages of the two ears as shown in Figure 3D. Stimulus: 300/304-Hz, 70 dB-SPL binaural beat. Contour spacing 0.1 mV. CF: 680 Hz. (B) Histogram of variance explained by the linear prediction. Population data from 19 MSO cells. (C) Cycle-averaged input waveforms obtained with binaural stimulation (top row) and consecutive monaural presentation of the same tones (bottom row). (D) Prediction of the subthreshold input of panel A obtained by simply summing the waveforms obtained under monaural stimulation shown in panel C, bottom row. (E) Across-beat-cycle variance corresponding to the across-beat-cycle mean shown in panel A. Contour spacing 0.018 mV2. The thick white contour line demarcates the variance of spontaneous activity. Most of the time (64 %) during binaural-beat stimulation, the variance is below the spontaneous variance. (F) Across-tone-cycle variance obtained from monaural responses to 70-dB-SPL, 300/304 Hz, normalized to the spontaneous value. For both ears, the variance is periodically reduced to ~50% of the spontaneous value.
Lack of excitatory inputs contributes to low firing rates at “worst ITD”
Previous, extracellular recordings from MSO have shown that firing rate at the “worst ITD” is generally lower than the rates obtained by monaural stimulation of either ear, and can even drop below the spontaneous rate (Goldberg and Brown, 1969; Spitzer and Semple, 1995; Yin and Chan, 1990). We observed that subthreshold responses were highly stereotyped, repeating themselves each beat cycle. We therefore determined not only the mean subthreshold potential (Figure 5A), but also the variance across beat cycles (Figure 5E). The across-cycle variance varied systematically during the cycle. It was clearly larger when responses were large, but in between, during 64% of the beat cycle, it systematically dropped below the spontaneous level. At its absolute minimum, it amounted to only 5% of the spontaneous level. Especially since the inhibitory inputs are large and few (Couchman et al., 2010), the deep trough of the across-beat-cycle variance appears to signify an absence of excitatory inputs rather than the presence of well-timed inhibition. More examples are shown in Figure 6. The periodic reduction of the variance below the spontaneous value was observed in all 22 ITD-sensitive cells. Considering the excellent phase locking of SBCs (Joris and Smith, 2008), the most likely interpretation of this phase-locked variance trough is the periodic absence of SBC inputs at those instants where the silent intervals from both ears coincide. This hypothesis is supported by the observation that the periodic reduction of the variance (Figures 5E and 6E–H) became less pronounced for higher stimulus frequencies (Figure S8A), as expected from a decline of SBC phase locking. We also determined the variance across stimulus cycles during monaural stimulation. For both ipsi- and contralateral stimulation, the minimum variance during the cycle was ~50% of the spontaneous level (Figure 5F), consistent with the periodic absence of synaptic inputs from the stimulated ear. Apparently, in this cell the input from each ear contributed ~50% of the total variance of the spontaneous activity. The periodic reduction of variance below spontaneous levels upon monaural stimulation of either ear was a general finding (546/559 recordings; all 18 cells monaurally tested, including two cells recorded in whole-cell mode). Again, the reduction of activity during the unfavorable part of the stimulus cycle became less pronounced with increasing frequency (Figure S8B). We conclude that, most likely, the low firing rate at worst ITD is primarily due to the absence of spontaneous excitatory inputs, whose random timing leads to “accidental coincidences” under monaural stimulation (Colburn et al., 1990).
Figure 6. Variance in the response to binaural beats during the beat cycle.

In each column the upper and lower graphs show the mean subthreshold input and its variance, respectively. (A–D) Mean subthreshold input as a function of both monaural phases of the binaural beat stimulus in 4 different MSO neurons (cf. Figure 3D). CFs: 680, 430, 300, 480 Hz. (E–H) Associated variance (cf. Figure 5E). (A, E) 200/204-Hz, 80 dB SPL. (B, F) 200/204-Hz, 50 dB SPL. (C, G) 300/304-Hz, 60 dB SPL. (D, H) 500/504-Hz, 50 dB SPL. The fraction of time that the variance shown in panels E–H was below the spontaneous value was 71%, 71%, 78%, and 72%, respectively. The minimum values of the variance over the beat cycle were 5%, 16%, 6%, and 6% of their respective spontaneous values.
Inputs from both ears have similar risetimes and EPSP-AP delays
We next tested the predictions of two other models suggesting that ITD tuning is not primarily determined by the timing of the excitatory inputs. Firstly, we did not find evidence for an asymmetry in the risetimes of ipsi- and contralateral responses (Figure 7A; a similar lack of asymmetry was observed for the whole-cell data), in contrast to a slice study, which found that the slopes of EPSPs evoked by ipsi- or contralateral stimulation differed substantially (Jercog et al., 2010). Secondly, we did not find evidence for an interaural asymmetry in the delay between EPSPs and action potentials (Figure 7B), which could shift ITD tuning (Zhou et al., 2005).
Figure 7. Interaural symmetry of recorded waveforms.
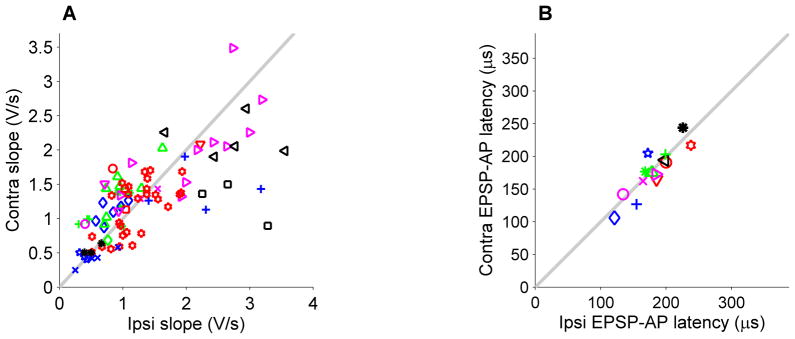
(A) Cycle-averaged ipsilaterally and contralaterally evoked EPSPs have similar risetimes. For each binaural beat response, the steepest slopes of the cycle-averaged subthreshold input (cf. Figures 3B, C; 5C, F) were determined, using either the ipsilateral or the contralateral stimulus frequency. Peak-to-peak values of both cycle-averaged subthreshold responses had to exceed twice the RMS of the spontaneous activity in order to be included, yielding n = 89 recordings, 19 cells (juxtacellular recordings). The ipsi/contra pairs of steepest slopes are shown as a scatter plot, each cell indicated by a different symbol. The mean pair-wise difference (ipsi minus contra) was 0.05 ± 0.45 V/s (p > 0.43, Student’s T-test). (B) EPSP-AP latencies in monaural responses. For the 14 cells for which monaural responses to both ears were available (1 whole-cell, 13 juxtacellular recordings), we compared the latency between EPSPs and APs (cf. Figure 1E, F) and compared them between ipsilateral and contralateral tones. Each symbol represents the average of all monaurally evoked APs of one cell. The mean difference (ipsi minus contra) across cells was 5 ± 16 μs. A Student’s T-test revealed no significant difference between ipsi- and contralaterally evoked EPSP-AP latencies (p > 0.47; n = 14 cells).
Nonlinear input-output relation helps in coincidence detection
The remarkably linear interaction between the inputs from both ears raises the question how the output of these cells can have such good sensitivity to ITD. Figure 8A illustrates how subthreshold monaural inputs can interact to trigger a spike. Binaural stimulation at best ITD evoked on average more than 3 times as many spikes as the sum of monaurally evoked spike counts (Figure 8B; Goldberg and Brown, 1969; Spitzer and Semple, 1995; Yin and Chan, 1990). The subthreshold responses in our binaural recordings allowed us to study the relation between the averaged subthreshold potential and the instantaneous firing rate. This relation followed a power relation (Figure 8C), indicating that the nonlinear spike triggering mechanism helps the MSO neurons to be coincidence detectors.
Figure 8. Coincidence detection is realized by a nonlinear input-output relation.
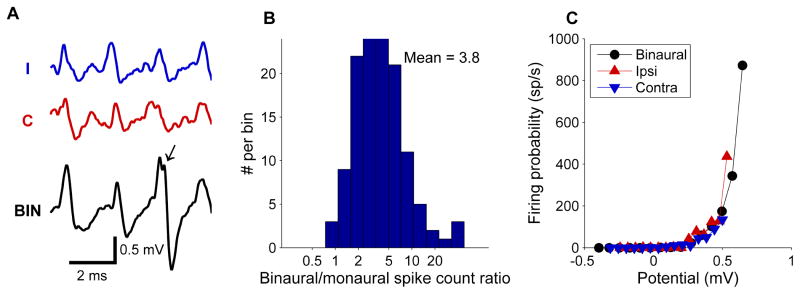
(A) Comparison of monaural responses (upper two traces) and binaural responses (lower trace). Frequencies were 500 Hz (ipsilateral) and 504 Hz (contralateral). All traces show a periodic (~2-ms) depolarization. The larger binaural responses are closer to the firing threshold and trigger an AP (arrow). CF: 680 Hz. (B) Histogram of the ratio of number of spikes evoked by binaural stimulation at best ITD to the sum of monaurally evoked spikes (n = 18 cells). The mean value of 3.8 indicates a sizeable binaural facilitation. (C) Instantaneous firing rate as a function of the averaged subthreshold potential derived separately for monaural and binaural stimulation, showing an expansive (“power-law”) relation.
DISCUSSION
The ability to measure the synaptic inputs to the MSO neurons allowed us to study how these neurons integrate information from both ears. We show here that ITD tuning of these neurons is determined by the timing of their excitatory inputs, that these fast excitatory inputs from both ears sum linearly, and that spike probability depends nonlinearly on the size of synaptic inputs.
Subthreshold events in the MSO
We used a juxtacellular approach to record from MSO neurons in vivo. In contrast to earlier studies in gerbil (Brand et al., 2002; Day and Semple, 2011; Pecka et al., 2008; Spitzer and Semple, 1995), we used a ventral approach, which made it easier to map where the MSO cell layer was located. The use of field potentials (Galambos et al., 1959; Mc Laughlin et al., 2010) was critical for determining the cell layer. Within the somatic layer, all cells were excited by both ears, whereas several previous studies found that many cells were inhibited by one ear (Barrett, 1976; Caird and Klinke, 1983; Goldberg and Brown, 1968, 1969; Hall, 1965; Moushegian et al., 1964). Even though our sample size was limited, and there may be species differences, this suggests that some of the reported heterogeneities in the properties of MSO neurons are caused by differences in response properties between MSO neurons within and outside of the somatic layer (Guinan et al., 1972; Langford, 1984; Tsuchitani, 1977). The recordings from the MSO neurons were characterized by the presence of clear subthreshold responses, even in the absence of sounds, and by the presence of low-amplitude spikes. The observation that the spontaneous events could be picked up even in the juxtacellular recordings is partly due to their low membrane resistance, which is caused by the presence of Ih and low-threshold K+ channels already open at rest (Khurana et al., 2012; Khurana et al., 2011; Mathews et al., 2010; Scott et al., 2005). In agreement with this, the resistive coupling measured in simultaneous juxtacellular and whole-cell recordings was much larger than in principal neurons of the MNTB, whereas the capacitive coupling was similar (Lorteije et al., 2009). The small size of the somatic action potential is in agreement with slice recordings (Scott et al., 2005), and is caused by the restricted backpropagation of the axonal action potential to the soma (Scott et al., 2007). The high spontaneous event rates of at least 500 events/s were in agreement with average spontaneous firing rates of SBCs of ~56 sp/s (Kuenzel et al., 2011) and the estimate of minimally 4–8 SBCs innervating each gerbil MSO neuron (Couchman et al., 2010). The EPSP kinetics largely matched results obtained with slice recordings. Half widths of EPSPs in juxtacellular recordings were somewhat smaller than in adult slice recordings (~0.55 ms; Scott et al., 2005), to which the capacitive component in the juxtacellular recordings may contribute, whereas the intracellularly recorded EPSPs had a half width that was somewhat larger than of EPSPs in slice recordings, to which both dispersion in sound-evoked events and the relatively large series resistances may have contributed.
Variability of EPSP-AP delays
The EPSP-AP delay was remarkably variable and was on average about 200 μs, which is larger than the physiological ITD range of the gerbil. Similar delays have been observed in a slice study (Scott et al., 2007). This delay consists of the travel time of EPSP to initial segment, spike initiation and the backpropagation of the AP to the soma, which is physiologically less relevant. The EPSP-AP delay depended systematically on EPSP amplitude (Scott et al., 2007); larger EPSPs resulted in smaller EPSP-AP delays, in agreement with the idea that the EPSP-AP delay of EPSPs that are barely suprathreshold contribute considerably to jitter, as was also found in the SBCs, which form the excitatory inputs to the MSO neurons (Kuenzel et al., 2011).
Linear summation of inputs from both ears
The ability to measure the inputs to the MSO neurons in vivo allowed us to test how inputs from both ears sum. We found that the interaction between the inputs from both ears was remarkably linear. The ipsilateral EPSP did not depend on the phase of the contralateral EPSP (and vice versa).
Our data are in good agreement with experiments in neocortical and hippocampal slices, in which a general finding was that distant inputs sum linearly, whereas inputs on the same dendritic branch interact nonlinearly (Cash and Yuste, 1999; Gasparini and Magee, 2006; Polsky et al., 2004; Tamás et al., 2002). Linear summation was also observed in an in vivo study in visual cortex (Jagadeesh et al., 1993). Apparently, in our in vivo experiments the somatic depolarization by the inputs of either ear was not large enough to create a substantial loss of driving force for the inputs from the other ear. The exact cellular mechanisms underlying the remarkable linear behavior of the MSO neurons remain to be investigated, but slice studies have suggested that the interplay of the different voltage-dependent ion channels in the MSO neurons can actively linearize the interaction between binaural inputs (Khurana et al., 2011; Scott et al., 2010).
Implications of linear summation
In a simulation study (Agmon-Snir et al., 1998), it has been proposed that the segregation of the inputs from both ears to opposite dendrites favors binaural inputs over monaural inputs by two different mechanisms. Firstly, inputs from the same ear would tend to sum nonlinearly, because the local depolarization will reduce driving force. Secondly, it would be more difficult for monaural inputs to reach threshold owing to the current sink of the non-stimulated dendrite. The activation of potassium channels might contribute to this non-linear interaction as well (Grau-Serrat et al., 2003; Mathews et al., 2010). The linearity of the summation argues against a prominent role of these mechanisms. Our results do not allow us to infer to what extent inputs sum sublinearly at a single dendrite. However, our results do suggest that the current sink imposed by the non-stimulated dendrite is not very large, since the size of the EPSP from one ear did not depend measurably on the phase of the stimulation to the other ear, and thus on the membrane potential of the other dendrite.
A similar argument can be put forward against the theory that well-timed (phase locked), contralateral, inhibition originating from the MNTB delays the time point at which the action potential threshold is reached (Brand et al., 2002; Pecka et al., 2008). This theory provides an elegant explanation for the observation that best ITDs typically show a bias for contralateral lead, which we also observed in the present study. This theory also predicts a significant phase-dependent influence of the sound from one ear on the response to the sound presented to the other ear, since well-timed inhibition should interact with excitation even if it is entirely of the shunting type. In contrast to these predictions, we found that the timing of the input from either ear is unaffected by the phase of the input from the other ear. Our results therefore suggest that the timing of the inhibitory input from either ear is not sufficiently precise to allow it to shift the ITD tuning (Joris and Yin, 2007; Zhou et al., 2005). This argument still holds true in the presence of inhibition from both ears. We cannot entirely exclude that the use of anesthetics may have influenced the timing precision of the inhibition. Effects of ketamine/xylazine on subcortical auditory processing are typically mild (Smith and Mills, 1989; Ter-Mikaelian et al., 2007), and both bushy cells (Kuenzel et al., 2011) and primary neurons of the MNTB (Hermann et al., 2007; Kopp-Scheinpflug et al., 2008) in gerbil show considerable spontaneous activity even under ketamine/xylazine anesthesia. Decreased inhibition has been reported in the dorsal cochlear nucleus (Navawongse and Voigt, 2009). However, the original evidence favoring well-timed inhibition was also obtained under ketamine/xylazine anesthesia (Brand et al., 2002; Pecka et al., 2008). Another possible confounder is that most of the inhibition is somatic, and may have been disrupted when we made recordings. However, somatic inhibitory responses in the MSO are not disrupted by positive pressures at least ten fold higher than what we used during approach of cells for juxtacellular recordings (Couchman et al., 2012).
Possible role of inhibition in MSO
The presence in the MSO of strong glycinergic inhibitory inputs originating from both the ipsi- (LNTB) and contralateral ear (MNTB) is well established, but its function has been debated (reviewed in Grothe et al., 2010). Because of the linearity of the interaction between both ears, a role of well-timed inhibition in shifting the best ITD (Brand et al., 2002; Pecka et al., 2008) seems unlikely. The low variance at the worst ITD suggests that it is the periodic absence of excitatory input rather than phase-locked inhibition that sets the firing rate during the worst ITD. A possible role for inhibition is that it may improve the dynamic range of the MSO neurons, similar to its proposed role in the nucleus laminaris (Yamada et al., 2013), the avian equivalent of the MSO, and in the SBCs (Kuenzel et al., 2011). This role is in agreement with the strong increase in spontaneous activity, clear broadening of ITD tuning and strongly reduced effect of ITD on spike rate observed upon application of the glycine receptor antagonist strychnine (Brand et al., 2002; Pecka et al., 2008) and the relatively slow kinetics of glycinergic synaptic potentials compared to the glutamatergic synaptic potentials (Magnusson et al., 2005).
Lack of contribution of MSO neurons to internal delays
Apart from the lack of evidence for a role of well-timed inhibition, we also did not find support for the two other models that propose that MSO neurons contribute to the creation of internal delays. The suggestions that interaural asymmetries in synaptic potentials (Jercog et al., 2010) or cellular morphology (Zhou et al., 2005) may contribute to ITD tuning of MSO cells are contradicted by our observation that the slopes of subthreshold inputs were similar for both ears (Figure 7A), in agreement with recent slice studies (Fischl et al., 2012; Roberts et al., 2013), and we obtained a similar result for the EPSP-AP latencies (Figure 7B). The interaural symmetry of EPSP-AP latencies agrees with the observation that in the gerbil MSO axons typically emerge directly from the soma (Scott et al., 2005). Our data therefore indicate that ITD tuning depends critically on the exact timing of the excitatory inputs to the MSO neurons, and that the MSO neuron itself does not make a large contribution to the internal delay.
ITD tuning
ITD tuning was complex. Two features were remarkable. Firstly, at low sound frequencies we observed multiple preferred latencies in the responses for both ears. Most likely, this is inherited from the SBCs. Spike timing dependent plasticity has been suggested as a possible mechanism for the coincidence of these inputs (Gerstner et al., 1996), and our results suggest that, if it is, it can work for multiple preferred latencies, indicating a hitherto unknown complexity to the tuning of the MSO neurons. It should be noted that these multiple latencies were typically obtained at low frequencies and high intensities, so their contribution to natural stimuli remains to be established. Behaviorally, localization is poorer for pure tones than for more “natural”, wideband sounds. Future work using wideband stimulation is required to test how our findings generalize to a wider range of stimuli.
A second property that added to the complexity of the tuning was that a comparison of the inputs from both ears indicated that ITD tuning was frequency-dependent. This observation by itself argues against the original Jeffress model (Jeffress, 1948), in which a delay line was the only source for ITD tuning. Since we did not observe any evidence for a contribution of the MSO neurons themselves to the delay line, this is compatible with the idea that cochlear tuning disparities contribute to the creation of internal delays (Day and Semple, 2011; Joris et al., 2006).
Coincidence detection
The backbone of the Jeffress hypothesis is the presence of coincidence detectors, neurons that fire when inputs from both ears arrive at the same time (Jeffress, 1948). Experimental evidence for this hypothesis was obtained from recordings in which the ITD was systematically varied (Goldberg and Brown, 1969). A key finding was that the best ITD could be predicted from the preferred latencies of the monaural responses. Our data extend these findings in three ways. Firstly, we show that the best ITD can be well predicted from the timing of the monaural subthreshold responses. Secondly, we provide a simple explanation for the low firing rate during the worst ITD. The observation that during worst ITD the firing rates become lower than during the response to monaural stimulation in many cells was basically unexplained. Three possibilities have been put forward: a role for well-timed inhibition (Yin and Chan, 1990), a role for low-threshold potassium conductance which is activated during depolarizations (Grau-Serrat et al., 2003; Mathews et al., 2010) or the absence of active excitatory inputs because of good phase locking (Colburn et al., 1990). A variance analysis provided evidence favoring the latter possibility, although a specific role of inhibition, low-threshold potassium channels or a combination of the two in the very low firing rates during the worst ITD cannot be excluded. Thirdly, to function as good coincidence detectors, MSO neurons must have a clearly higher spike rate at the best ITD for binaural stimulation than the sum of the spike rates during monaural stimulation of the left and the right ear. We observed a supralinear relation between firing rate and the averaged subthreshold potential (Figure 8C), which is in agreement with the power-law relation between spike probability and membrane potential in other neurons (Silver, 2010). This nonlinear relation has the effect to greatly increase the probability that a spike is triggered when EPSPs from both ears arrive at the same time. Together, our results indicate that binaural facilitation in MSO neurons results from the nonlinear increase in spiking probability brought about by the linear sum of the inputs from the two ears.
EXPERIMENTAL PROCEDURES
Animal procedures
All experiments were conducted in accordance with the European Communities Council Directive (86/609/EEC) and approved by the institutional animal ethics committee. After brief exposure to isoflurane, a total of 11 young-adult Mongolian gerbils (84 ± 7 days postnatal; 50–70 g) were injected intraperitoneally with a ketamine-xylazine mixture (65/10 mg/kg). Anaesthesia was monitored with the hind limb withdrawal reflex and additional ketamine-xylazine was given to maintain anaesthesia. Rectal temperature was maintained between 36.5 and 37.5 °C with a homeothermic blanket system (Stoelting Co., Wood Dale, Ill.). Both pinnae were surgically removed. We used a ventral approach to reach the MSO. Animals were supine-positioned, with their heads immobilized by a metal pedestal glued to the dorsal skull. Skin and soft tissue overlaying the trachea were removed and the trachea was intubated. Animals continued breathing independently. The right bulla was opened fully using a forceps; a hole was made in the left bulla to prevent pressure buildup in the left middle ear. Based on cranial landmarks, a ~1 mm diameter craniotomy was created by carefully scraping the bone between the bulla and the brainstem with a small handheld drill, exposing the brain surface slightly laterally from the MSO. Dura, arachnoids and pia mater were removed locally.
Histology
In some experiments, recording locations were marked with biocytin (0.5%) which was added to the pipette solution, or with post-recording injection of saturated Alcian Blue at the recording position (Figure S1). In these experiments, animals were sacrificed with a lethal dose of Nembutal and subsequently perfused intracardially with saline, followed by a 4% paraformaldehyde solution. Brains were further processed as described in Horikawa and Armstrong (1988) with minor modifications. Histology confirmed MSO as the recording location in 6 of 6 animals.
In vivo electrophysiology
Thick-walled borosilicate glass micropipettes with filament had a resistance of 3.5–6 MΩ when filled with recording solution. Pipettes were filled with Ringer solution for juxtacellular recordings, which contained NaCl 135, KCl 5.4, MgCl2 1, CaCl2 1.8, HEPES 5 mM; for whole-cell recordings the pipette contained (in mM): 138 K-gluconate, 8 KCl, 0.5 EGTA, 10 HEPES, 10 Na2Phosphocreatine, 4 MgATP, 0.3 NaGTP (pH 7.2 with KOH). Electrodes were typically inserted laterally (and ventrally) from the cell layer and advanced in dorsomedial direction at an angle of 20–30 degrees with the vertical. The thin somatic layer (Rautenberg et al., 2009) was identified based on the polarity reversal of the local field potential response (‘neurophonics’) during alternating monaural click stimuli to the left and right ear (Figure S1; Biedenbach and Freeman, 1964; Clark and Dunlop, 1968; Galambos et al., 1959).
Pipettes had a high positive pressure (>300 mbar) when crossing the brain surface, which was lowered to 10–30 mbar when approaching the cell layer (located at 400–1000 μm from the surface). Juxtacellular (loose-patch) or whole-cell recordings were made by slowly advancing the pipette while monitoring both its resistance and the presence of EPSP or spike activity. For juxtacellular recordings, pressure was released if a neuron was approached, and slight negative pressure was briefly applied while moving the electrode another 2 to 10 μm towards the cell until pipette resistance increased to a value of typically 30 MΩ. Because physical contact with a cell is essential for the large size of the juxtacellular potentials (Lorteije et al., 2009), we consider it very unlikely that another, nearby cell contributed significantly to the measured potentials. A further argument supporting good unit isolation was that the shortest eAP interval that we observed in any of the juxtacellular recordings was >1 ms, as expected from recordings from single neurons obeying the refractory period. Details of the whole-cell in vivo recordings are described in Supplemental Experimental Procedures.
Data were acquired with a MultiClamp 700B patch-clamp amplifier and pCLAMP 8 software (Axon Instruments). Further details are described in Supplemental Experimental Procedures.
Slice electrophysiology
Dual somatic whole cell and juxtacellular recordings were made at 37 °C from MSO neurons in 200 μm horizontal slices prepared from P29–46 gerbils as described previously (Scott et al., 2005). Slices were bathed in ACSF containing (in mM): 125 NaCl, 25 glucose, 25 NaHCO3, 2.5 KCl, 1.25 NaH2PO4, 1.5 CaCl2, 1.5 MgSO4. Whole cell recording electrodes were filled with (in mM): 115 K-gluconate, 4.42 KCl, 0.5 EGTA, 10 HEPES, 10 Na2Phosphocreatine, 4 MgATP, 0.3 NaGTP. Juxtacellular recording electrodes were filled with the same solution used for in vivo juxtacellular recordings. Juxtacellular seal resistance averaged 24 ± 7 MΩ. EPSPs were evoked by local stimulation of excitatory afferents in the presence of 1 μm strychnine. IPSPs were generated via conductance clamp (Toro-8 digital signal processing board, Cambridge Conductance software) simulation of an inhibitory conductance with a double exponential waveform (time constants = 0.28 ms rise, 1.85 ms decay) and reversal potential of −85 mV. Current steps were delivered through the whole cell electrode. Data were acquired using a MultiClamp 700B amplifier and custom algorithms in IGOR Pro. EPSP data were analyzed by binning both whole cell and juxtacellular responses according to the peak EPSP amplitude measured in the whole cell recording (0.2–0.6 mV bins), then averaging the responses in each bin. Similarly, IPSP data were averaged according to the simulated conductance, and current step data were averaged according to the amplitude of the current step. Comparisons between whole cell and juxtacellular recordings were made using these average responses. Capacitive and resistive coupling constants were estimated as described previously (Lorteije et al., 2009).
Auditory stimulation
Auditory stimuli were generated using custom MATLAB software. Stimuli were generated using a TDT2 system (PD1, Tucker Davis Technologies) and presented in a close-field configuration to the animal with Shure speakers (frequency range 22 Hz to 17.5 kHz) attached to the ear canal via a small tube. The correct stimulus levels and phases were attained by calibrating the drivers in situ at the level of the tympanic membrane using the microphone housed in the probe. The transfer characteristics of the probe were taken into account. All stimuli were generated at a rate of 48.8 kHz.
Binaural beat stimuli consisted of a pair of pure tones, one presented to each ear. The frequencies presented to the ipsilateral ear varied between 100 Hz and 1600 Hz in 100-Hz steps; in two experiments the step size was reduced to 50 Hz. The frequencies presented to the contralateral ear were always 4 Hz above that of the ipsilateral tone. The tones were presented simultaneously to the two ears, lasted 6 or 9 s, including 3-ms cos2 onset and offset ramps, and were separated by 1500-ms silent intervals. The initial stimulus level was 60 or 70 dB SPL. If time permitted, additional recordings were performed using additional intensities between 10 and 80 dB SPL in 10 dB steps, and monaural responses were obtained by setting the amplitude of the tone presented to either ear to zero.
Detailed analysis of in vivo recordings
Acceptance criteria, windowing and conditioning of the responses, detection of APs and EPSPs, periodicity analysis (Figures 3C, D; 4A; 5A, C, D, F) and extraction of metrics (vectors strength, CF, instantaneous firing rate) are detailed in Supplemental Experimental Procedures.
Supplementary Material
Acknowledgments
This work was supported by an FP6 European Union grant (EUSynapse) and by the Dutch Fund for Economic Structure Reinforcement (FES, 0908 ‘NeuroBasic PharmaPhenomics project’) (J.G.G.B.), and NIH grants DC006788 and DC011403 (N.L.G.).
Footnotes
Publisher's Disclaimer: This is a PDF file of an unedited manuscript that has been accepted for publication. As a service to our customers we are providing this early version of the manuscript. The manuscript will undergo copyediting, typesetting, and review of the resulting proof before it is published in its final citable form. Please note that during the production process errors may be discovered which could affect the content, and all legal disclaimers that apply to the journal pertain.
References
- Agmon-Snir H, Carr CE, Rinzel J. The role of dendrites in auditory coincidence detection. Nature. 1998;393:268–272. doi: 10.1038/30505. [DOI] [PubMed] [Google Scholar]
- Ashida G, Carr CE. Sound localization: Jeffress and beyond. Curr Opin Neurobiol. 2011;21:745–751. doi: 10.1016/j.conb.2011.05.008. [DOI] [PMC free article] [PubMed] [Google Scholar]
- Barrett TW. Superposition of binaural influences on single neuron activity in the medial superior olive elicited by electrical stimulation of the osseous spiral laminae. Brain Res Bull. 1976;1:209–228. doi: 10.1016/0361-9230(76)90071-x. [DOI] [PubMed] [Google Scholar]
- Beckius GE, Batra R, Oliver DL. Axons from anteroventral cochlear nucleus that terminate in medial superior olive of cat: observations related to delay lines. J Neurosci. 1999;19:3146–3161. doi: 10.1523/JNEUROSCI.19-08-03146.1999. [DOI] [PMC free article] [PubMed] [Google Scholar]
- Biedenbach MA, Freeman WJ. Click-evoked potential map from the superior olivary nucleus. Am J Physiol. 1964;206:1408–1414. doi: 10.1152/ajplegacy.1964.206.6.1408. [DOI] [PubMed] [Google Scholar]
- Brand A, Behrend O, Marquardt T, McAlpine D, Grothe B. Precise inhibition is essential for microsecond interaural time difference coding. Nature. 2002;417:543–547. doi: 10.1038/417543a. [DOI] [PubMed] [Google Scholar]
- Caird D, Klinke R. Processing of binaural stimuli by cat superior olivary complex neurons. Exp Brain Res. 1983;52:385–399. doi: 10.1007/BF00238032. [DOI] [PubMed] [Google Scholar]
- Cash S, Yuste R. Linear summation of excitatory inputs by CA1 pyramidal neurons. Neuron. 1999;22:383–394. doi: 10.1016/s0896-6273(00)81098-3. [DOI] [PubMed] [Google Scholar]
- Clark GM, Dunlop CW. Field potentials in the cat medial superior olivary nucleus. Exp Neurol. 1968;20:31–42. doi: 10.1016/0014-4886(68)90122-2. [DOI] [PubMed] [Google Scholar]
- Colburn HS, Han Y-A, Culotta CP. Coincidence model of MSO responses. Hear Res. 1990;49:335–346. doi: 10.1016/0378-5955(90)90112-3. [DOI] [PubMed] [Google Scholar]
- Couchman K, Grothe B, Felmy F. Medial superior olivary neurons receive surprisingly few excitatory and inhibitory inputs with balanced strength and short-term dynamics. J Neurosci. 2010;30:17111–17121. doi: 10.1523/JNEUROSCI.1760-10.2010. [DOI] [PMC free article] [PubMed] [Google Scholar]
- Couchman K, Grothe B, Felmy F. Functional localization of neurotransmitter receptors and synaptic inputs to mature neurons of the medial superior olive. J Neurophysiol. 2012;107:1186–1198. doi: 10.1152/jn.00586.2011. [DOI] [PubMed] [Google Scholar]
- Day ML, Semple MN. Frequency-dependent interaural delays in the medial superior olive: implications for interaural cochlear delays. J Neurophysiol. 2011;106:1985–1999. doi: 10.1152/jn.00131.2011. [DOI] [PubMed] [Google Scholar]
- Fischl MJ, Combs TD, Klug A, Grothe B, Burger RM. Modulation of synaptic input by GABAB receptors improves coincidence detection for computation of sound location. J Physiol (Lond) 2012;590:3047–3066. doi: 10.1113/jphysiol.2011.226233. [DOI] [PMC free article] [PubMed] [Google Scholar]
- Freygang WH, Jr, Frank K. Extracellular potentials from single spinal motoneurons. J Gen Physiol. 1959;42:749–760. doi: 10.1085/jgp.42.4.749. [DOI] [PMC free article] [PubMed] [Google Scholar]
- Funabiki K, Ashida G, Konishi M. Computation of interaural time difference in the owl’s coincidence detector neurons. J Neurosci. 2011;31:15245–15256. doi: 10.1523/JNEUROSCI.2127-11.2011. [DOI] [PMC free article] [PubMed] [Google Scholar]
- Galambos R, Schwartzkopff J, Rupert A. Microelectrode study of superior olivary nuclei. Am J Physiol. 1959;197:527–536. doi: 10.1152/ajplegacy.1959.197.3.527. [DOI] [PubMed] [Google Scholar]
- Gasparini S, Magee JC. State-dependent dendritic computation in hippocampal CA1 pyramidal neurons. J Neurosci. 2006;26:2088–2100. doi: 10.1523/JNEUROSCI.4428-05.2006. [DOI] [PMC free article] [PubMed] [Google Scholar]
- Gerstner W, Kempter R, van Hemmen JL, Wagner H. A neuronal learning rule for sub-millisecond temporal coding. Nature. 1996;383:76–81. doi: 10.1038/383076a0. [DOI] [PubMed] [Google Scholar]
- Goldberg JM, Brown PB. Functional organization of the dog superior olivary complex: an anatomical and electrophysiological study. J Neurophysiol. 1968;31:639–656. doi: 10.1152/jn.1968.31.4.639. [DOI] [PubMed] [Google Scholar]
- Goldberg JM, Brown PB. Response of binaural neurons of dog superior olivary complex to dichotic tonal stimuli: some physiological mechanisms of sound localization. J Neurophysiol. 1969;32:613–636. doi: 10.1152/jn.1969.32.4.613. [DOI] [PubMed] [Google Scholar]
- Grau-Serrat V, Carr CE, Simon JZ. Modeling coincidence detection in nucleus laminaris. Biol Cybern. 2003;89:388–396. doi: 10.1007/s00422-003-0444-4. [DOI] [PMC free article] [PubMed] [Google Scholar]
- Grothe B, Pecka M, McAlpine D. Mechanisms of sound localization in mammals. Physiol Rev. 2010;90:983–1012. doi: 10.1152/physrev.00026.2009. [DOI] [PubMed] [Google Scholar]
- Guinan JJ, Jr, Norris BE, Guinan SS. Single auditory units in the superior olive complex II: Tonotopic organization and locations of unit categories. Int J Neurosci. 1972;4:147–166. [Google Scholar]
- Hall JL., 2nd Binaural interaction in the accessory superior-olivary nucleus of the cat. J Acoust Soc Am. 1965;37:814–823. doi: 10.1121/1.1909447. [DOI] [PubMed] [Google Scholar]
- Heffner RS, Heffner HE. Sound localization and use of binaural cues by the gerbil (Meriones unguiculatus) Behav Neurosci. 1988;102:422–428. doi: 10.1037//0735-7044.102.3.422. [DOI] [PubMed] [Google Scholar]
- Hermann J, Pecka M, von Gersdorff H, Grothe B, Klug A. Synaptic transmission at the calyx of Held under in vivo-like activity levels. J Neurophysiol. 2007;98:807–820. doi: 10.1152/jn.00355.2007. [DOI] [PubMed] [Google Scholar]
- Herz AVM, Gollisch T, Machens CK, Jaeger D. Modeling single-neuron dynamics and computations: a balance of detail and abstraction. Science. 2006;314:80–85. doi: 10.1126/science.1127240. [DOI] [PubMed] [Google Scholar]
- Horikawa K, Armstrong WE. A versatile means of intracellular labeling: injection of biocytin and its detection with avidin conjugates. J Neurosci Methods. 1988;25:1–11. doi: 10.1016/0165-0270(88)90114-8. [DOI] [PubMed] [Google Scholar]
- Jagadeesh B, Wheat HS, Ferster D. Linearity of summation of synaptic potentials underlying direction selectivity in simple cells of the cat visual cortex. Science. 1993;262:1901–1904. doi: 10.1126/science.8266083. [DOI] [PubMed] [Google Scholar]
- Jeffress LA. A place theory of sound localization. J Comp Physiol Psychol. 1948;41:35–39. doi: 10.1037/h0061495. [DOI] [PubMed] [Google Scholar]
- Jercog PE, Svirskis G, Kotak VC, Sanes DH, Rinzel J. Asymmetric excitatory synaptic dynamics underlie interaural time difference processing in the auditory system. PLoS biology. 2010;8:e1000406. doi: 10.1371/journal.pbio.1000406. [DOI] [PMC free article] [PubMed] [Google Scholar]
- Joris P, Yin TCT. A matter of time: internal delays in binaural processing. Trends Neurosci. 2007;30:70–78. doi: 10.1016/j.tins.2006.12.004. [DOI] [PubMed] [Google Scholar]
- Joris PX, Smith PH. The volley theory and the spherical cell puzzle. Neuroscience. 2008;154:65–76. doi: 10.1016/j.neuroscience.2008.03.002. [DOI] [PMC free article] [PubMed] [Google Scholar]
- Joris PX, Van de Sande B, Louage DH, van der Heijden M. Binaural and cochlear disparities. Proc Natl Acad Sci U S A. 2006;103:12917–12922. doi: 10.1073/pnas.0601396103. [DOI] [PMC free article] [PubMed] [Google Scholar]
- Karino S, Smith PH, Yin TCT, Joris PX. Axonal branching patterns as sources of delay in the mammalian auditory brainstem: a re-examination. J Neurosci. 2011;31:3016–3031. doi: 10.1523/JNEUROSCI.5175-10.2011. [DOI] [PMC free article] [PubMed] [Google Scholar]
- Khurana S, Liu Z, Lewis AS, Rosa K, Chetkovich D, Golding NL. An essential role for modulation of hyperpolarization-activated current in the development of binaural temporal precision. J Neurosci. 2012;32:2814–2823. doi: 10.1523/JNEUROSCI.3882-11.2012. [DOI] [PMC free article] [PubMed] [Google Scholar]
- Khurana S, Remme MWH, Rinzel J, Golding NL. Dynamic interaction of Ih and IK-LVA during trains of synaptic potentials in principal neurons of the medial superior olive. J Neurosci. 2011;31:8936–8947. doi: 10.1523/JNEUROSCI.1079-11.2011. [DOI] [PMC free article] [PubMed] [Google Scholar]
- Kopp-Scheinpflug C, Tolnai S, Malmierca MS, Rübsamen R. The medial nucleus of the trapezoid body: comparative physiology. Neuroscience. 2008;154:160–170. doi: 10.1016/j.neuroscience.2008.01.088. [DOI] [PubMed] [Google Scholar]
- Kuenzel T, Borst JGG, van der Heijden M. Factors controlling the input-output relationship of spherical bushy cells in the gerbil cochlear nucleus. J Neurosci. 2011;31:4260–4273. doi: 10.1523/JNEUROSCI.5433-10.2011. [DOI] [PMC free article] [PubMed] [Google Scholar]
- Langford TL. Responses elicited from medial superior olivary neurons by stimuli associated with binaural masking and unmasking. Hear Res. 1984;15:39–50. doi: 10.1016/0378-5955(84)90223-5. [DOI] [PubMed] [Google Scholar]
- Lorteije JAM, Rusu SI, Kushmerick C, Borst JGG. Reliability and precision of the mouse calyx of Held synapse. J Neurosci. 2009;29:13770–13784. doi: 10.1523/JNEUROSCI.3285-09.2009. [DOI] [PMC free article] [PubMed] [Google Scholar]
- Magnusson AK, Kapfer C, Grothe B, Koch U. Maturation of glycinergic inhibition in the gerbil medial superior olive after hearing onset. J Physiol (Lond) 2005;568:497–512. doi: 10.1113/jphysiol.2005.094763. [DOI] [PMC free article] [PubMed] [Google Scholar]
- Maier JK, Klump GM. Resolution in azimuth sound localization in the Mongolian gerbil (Meriones unguiculatus) J Acoust Soc Am. 2006;119:1029–1036. doi: 10.1121/1.2159429. [DOI] [PubMed] [Google Scholar]
- Mardia KV, Jupp PE. Directional statistics. Chichester, UK: Wiley; 2000. [Google Scholar]
- Mathews PJ, Jercog PE, Rinzel J, Scott LL, Golding NL. Control of submillisecond synaptic timing in binaural coincidence detectors by Kv1 channels. Nat Neurosci. 2010;13:601–609. doi: 10.1038/nn.2530. [DOI] [PMC free article] [PubMed] [Google Scholar]
- Mc Laughlin M, Verschooten E, Joris PX. Oscillatory dipoles as a source of phase shifts in field potentials in the mammalian auditory brainstem. J Neurosci. 2010;30:13472–13487. doi: 10.1523/JNEUROSCI.0294-10.2010. [DOI] [PMC free article] [PubMed] [Google Scholar]
- Moushegian G, Rupert A, Whitcomb MA. Brain-stem neuronal response patterns to monaural and binaural tones. J Neurophysiol. 1964;27:1174–1191. doi: 10.1152/jn.1964.27.6.1174. [DOI] [PubMed] [Google Scholar]
- Navawongse R, Voigt HF. Single neuron recordings in dorsal cochlear nucleus (DCN) of awake gerbil. Hear Res. 2009;255:44–57. doi: 10.1016/j.heares.2009.05.004. [DOI] [PubMed] [Google Scholar]
- Ohlemiller KK, Echteler SM. Functional correlates of characteristic frequency in single cochlear nerve fibers of the Mongolian gerbil. J Comp Physiol A. 1990;167:329–338. doi: 10.1007/BF00192568. [DOI] [PubMed] [Google Scholar]
- Pecka M, Brand A, Behrend O, Grothe B. Interaural time difference processing in the mammalian medial superior olive: the role of glycinergic inhibition. J Neurosci. 2008;28:6914–6925. doi: 10.1523/JNEUROSCI.1660-08.2008. [DOI] [PMC free article] [PubMed] [Google Scholar]
- Polsky A, Mel BW, Schiller J. Computational subunits in thin dendrites of pyramidal cells. Nat Neurosci. 2004;7:621–627. doi: 10.1038/nn1253. [DOI] [PubMed] [Google Scholar]
- Rautenberg PL, Grothe B, Felmy F. Quantification of the three-dimensional morphology of coincidence detector neurons in the medial superior olive of gerbils during late postnatal development. J Comp Neurol. 2009;517:385–396. doi: 10.1002/cne.22166. [DOI] [PubMed] [Google Scholar]
- Roberts MT, Seeman SC, Golding NL. A mechanistic understanding of the role of feedforward inhibition in the mammalian sound localization circuitry. Neuron. 2013 doi: 10.1016/j.neuron.2013.04.022. accepted for publication. [DOI] [PMC free article] [PubMed] [Google Scholar]
- Scott LL, Hage TA, Golding NL. Weak action potential backpropagation is associated with high-frequency axonal firing capability in principal neurons of the gerbil medial superior olive. J Physiol (Lond) 2007;583:647–661. doi: 10.1113/jphysiol.2007.136366. [DOI] [PMC free article] [PubMed] [Google Scholar]
- Scott LL, Mathews PJ, Golding NL. Posthearing developmental refinement of temporal processing in principal neurons of the medial superior olive. J Neurosci. 2005;25:7887–7895. doi: 10.1523/JNEUROSCI.1016-05.2005. [DOI] [PMC free article] [PubMed] [Google Scholar]
- Scott LL, Mathews PJ, Golding NL. Perisomatic voltage-gated sodium channels actively maintain linear synaptic integration in principal neurons of the medial superior olive. J Neurosci. 2010;30:2039–2050. doi: 10.1523/JNEUROSCI.2385-09.2010. [DOI] [PMC free article] [PubMed] [Google Scholar]
- Seidl AH, Rubel EW, Harris DM. Mechanisms for adjusting interaural time differences to achieve binaural coincidence detection. J Neurosci. 2010;30:70–80. doi: 10.1523/JNEUROSCI.3464-09.2010. [DOI] [PMC free article] [PubMed] [Google Scholar]
- Silver RA. Neuronal arithmetic. Nat Rev Neurosci. 2010;11:474–489. doi: 10.1038/nrn2864. [DOI] [PMC free article] [PubMed] [Google Scholar]
- Smith DI, Mills JH. Anesthesia effects: auditory brain-stem response. Electroencephalogr Clin Neurophysiol. 1989;72:422–428. doi: 10.1016/0013-4694(89)90047-3. [DOI] [PubMed] [Google Scholar]
- Spitzer MW, Semple MN. Neurons sensitive to interaural phase disparity in gerbil superior olive: diverse monaural and temporal response properties. J Neurophysiol. 1995;73:1668–1690. doi: 10.1152/jn.1995.73.4.1668. [DOI] [PubMed] [Google Scholar]
- Tamás G, Szabadics J, Somogyi P. Cell type- and subcellular position-dependent summation of unitary postsynaptic potentials in neocortical neurons. J Neurosci. 2002;22:740–747. doi: 10.1523/JNEUROSCI.22-03-00740.2002. [DOI] [PMC free article] [PubMed] [Google Scholar]
- Ter-Mikaelian M, Sanes DH, Semple MN. Transformation of temporal properties between auditory midbrain and cortex in the awake Mongolian gerbil. J Neurosci. 2007;27:6091–6102. doi: 10.1523/JNEUROSCI.4848-06.2007. [DOI] [PMC free article] [PubMed] [Google Scholar]
- Tsuchitani C. Functional organization of lateral cell groups of cat superior olivary complex. J Neurophysiol. 1977;40:296–318. doi: 10.1152/jn.1977.40.2.296. [DOI] [PubMed] [Google Scholar]
- Yamada R, Okuda H, Kuba H, Nishino E, Ishii TM, Ohmori H. The cooperation of sustained and phasic inhibitions increases the contrast of ITD-tuning in low-frequency neurons of the chick nucleus laminaris. J Neurosci. 2013;33:3927–3938. doi: 10.1523/JNEUROSCI.2377-12.2013. [DOI] [PMC free article] [PubMed] [Google Scholar]
- Yin TCT, Chan JCK. Interaural time sensitivity in medial superior olive of cat. J Neurophysiol. 1990;64:465–488. doi: 10.1152/jn.1990.64.2.465. [DOI] [PubMed] [Google Scholar]
- Zhou Y, Carney LH, Colburn HS. A model for interaural time difference sensitivity in the medial superior olive: interaction of excitatory and inhibitory synaptic inputs, channel dynamics, and cellular morphology. J Neurosci. 2005;25:3046–3058. doi: 10.1523/JNEUROSCI.3064-04.2005. [DOI] [PMC free article] [PubMed] [Google Scholar]
Associated Data
This section collects any data citations, data availability statements, or supplementary materials included in this article.