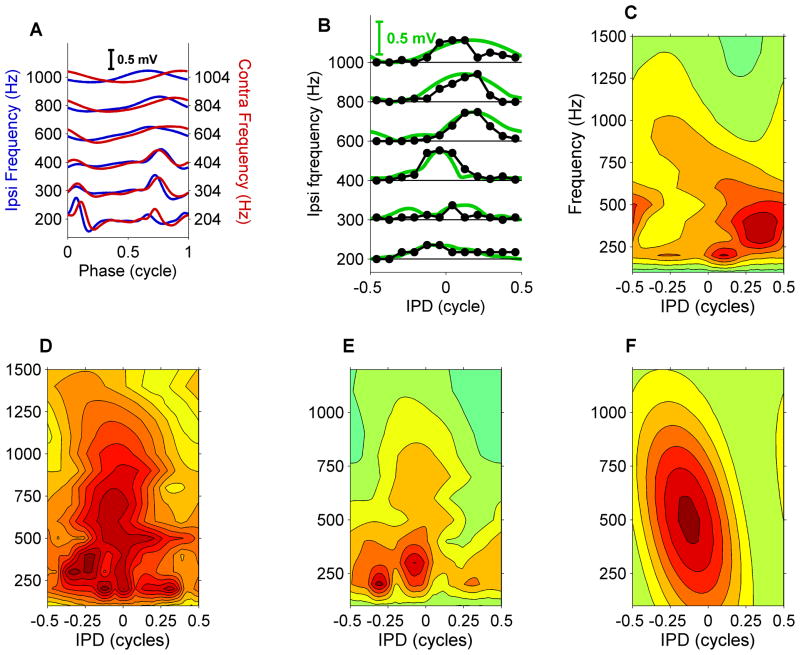
Figure 4. MSO neurons show complex ITD tuning.
(A) Cycle-averaged subthreshold input (as in Figure 3C), multiple frequencies tested. Lowest frequencies show multiple, interaurally matched, preferred latencies in the inputs from both ears. (B) Binaural tuning and its prediction from subthreshold inputs (as in Figure 3A), multiple frequencies tested. Spike count curves (black symbols) were normalized to the peak subthreshold potential (green lines) to facilitate comparing of their binaural tuning. (C–E) Binaural receptive fields for three MSO neurons (CF = 420, 680, 790 Hz). The peak subthreshold input is shown as a function of both IPD and stimulus frequency, thus combining IPD tuning and frequency tuning of the subthreshold input. Spacing of contours is 0.05 mV. (F) Simple ITD tuning of a hypothetical MSO cell tuned at 500 Hz having a constant, frequency-independent best ITD of 250 μs. The constant best ITD corresponds to a best IPD that is proportional to the stimulus frequency.

