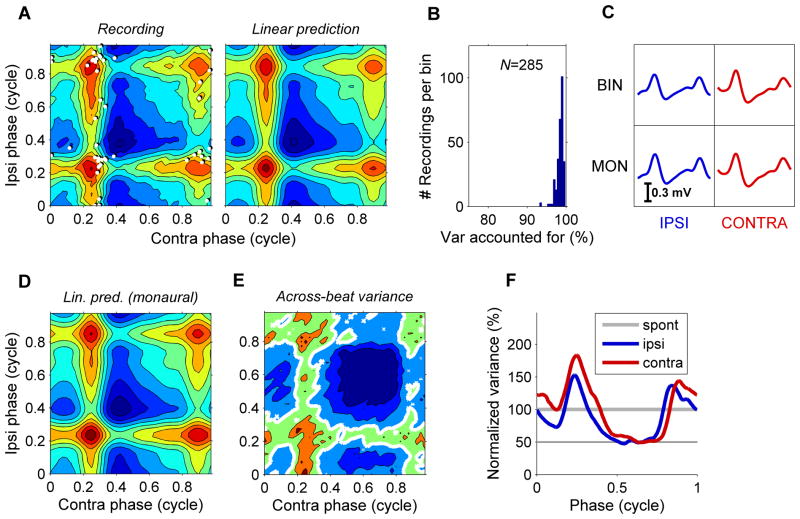
Figure 5. Inputs from both ears sum linearly.
(A) 2D representation of the subthreshold inputs (left), with eAPs indicated as white dots. Right panel is the prediction of a purely linear interaction obtained by adding the cycle averages of the two ears as shown in Figure 3D. Stimulus: 300/304-Hz, 70 dB-SPL binaural beat. Contour spacing 0.1 mV. CF: 680 Hz. (B) Histogram of variance explained by the linear prediction. Population data from 19 MSO cells. (C) Cycle-averaged input waveforms obtained with binaural stimulation (top row) and consecutive monaural presentation of the same tones (bottom row). (D) Prediction of the subthreshold input of panel A obtained by simply summing the waveforms obtained under monaural stimulation shown in panel C, bottom row. (E) Across-beat-cycle variance corresponding to the across-beat-cycle mean shown in panel A. Contour spacing 0.018 mV2. The thick white contour line demarcates the variance of spontaneous activity. Most of the time (64 %) during binaural-beat stimulation, the variance is below the spontaneous variance. (F) Across-tone-cycle variance obtained from monaural responses to 70-dB-SPL, 300/304 Hz, normalized to the spontaneous value. For both ears, the variance is periodically reduced to ~50% of the spontaneous value.

