

Complete sequencing of higher eukaryotic genomes yielded the surprise that despite hundreds of millions of years of evolutionary separation and strikingly different sizes and body plans, diverse organisms contain nearly the same number of genes! Gene prediction is ≈30,000 for human (1), slightly lower for other animals (2), including 13,600 for the fruit fly Drosophila melanogaster, 18,400 for the nematode worm Caenorhabditis elegans, and 26,000 for the flowering plant Arabidopsis thaliana (3). In contrast to the modest variation in gene number, eukaryotic genome size varies over 5 orders of magnitude (4), a paradoxical feature that was noted long before genes were cloned. Even within a single species, that of maize (Zea mays), genome size varies 50% (5). Further, variation in genome size does not follow any taxonomic logic: large genomes are found in some “simple” eukaryotic algae and small genomes in advanced organisms. Nor does genome size correlate with lifespan: both the ephemeral annual plant Arabidopsis and the long-lived peach tree have tiny genomes (6). Now that we know that higher eukaryotes encode approximately the same number of genes, noncoding DNA must explain the diversity of genome sizes. Indeed, a majority of the ≈3,000-Mb human genome is composed of inactive retrotransposons (RTEs) and other noncoding repetitive sequences, whereas the ≈100-Mb genomes of D. melanogaster, C. elegans, and A. thaliana contain only a low percentage of such sequences. Simplistically, the spacing of genes could explain genome size, with tight packing in small genomes and numerous repetitive noncoding elements resulting in wide spacing in large genomes. In this issue of PNAS, Fu et al. (7) report that in the ≈2,500-Mb maize genome, two-thirds of which is composed of RTEs, there is a 32-kb region containing 10 genes with an average intergenic spacing of less than 1 kb. Their report demonstrates that extreme heterogeneity in gene spacing can exist within a single genome, because in other regions 10- to 70-kb stretches of RTEs separate neighboring genes (8).
Evolution of Genome Size
To put the findings of Fu et al. (7) in context we must consider how genome size and gene spacing evolve. As with any genetic character, genome size evolves through the interplay between mutation and natural selection. Gene or whole genome duplications (polyploidization), insertions of organellar or viral DNA, microsatellite and heterochromatin expansions, and transposon insertions all add DNA to nuclear genomes. On the other side of the equation, deletions, often involving repetitive elements, remove DNA. Ultimately, length mutations affect genome size only to the extent those events can pass through the sieve of natural selection (9).
Length mutation types differentially affect genome structure, because some are global and some are local in modulating genome size. RTEs are a prime example of a global force increasing genome size: a single element can be copied into thousands, which then insert throughout the genome. Other forces, such as expansion or diminution of a microsatellite, a block of heterochromatin, or tandemly duplicated genes are more parochial in their action, affecting only a few sequences at particular sites. Polyploidization, a major force in plant genome evolution, affects all sequences, but changes their number rather than altering the length of genes or intergenic DNA.
The Big Bang of Transposition Produces an Expanding Universe in the Maize Genome
Maize provides a spectacular illustration of the power and importance of two mechanisms of genome size evolution: polyploidization and transposon expansion. A common progenitor of maize and sorghum existed ≈20 million years ago (Mya) (Fig. 1); about 11.5 Mya ago, two derivative species hybridized, doubling genome size on the track to modern maize. Within the past 6 million years, maize-specific RTEs have amplified episodically to further double genome size relative to sorghum; today up to 80% of the maize genome is RTEs (10). In a 225-kb region near Adh1, there are nine genes; however, RTEs comprise 74% of the sequence and tell a tale of periodic insertions during the past 6 million years, nearly always into even older RTEs (10, 11) (Fig. 2). In contrast, the orthologous 78-kb region of sorghum contains no RTEs but has the same nine genes in the same order, plus five additional genes (12). Similarly, sh2 and a1 are 140 kb apart in maize but 7-fold closer in sorghum (13).
Figure 1.
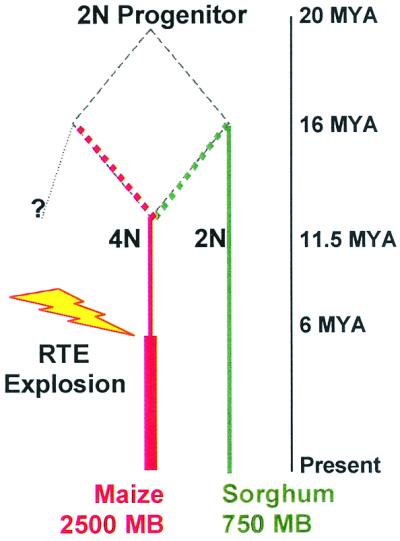
Key events that shaped the modern maize genome. The current hypothesis (10) posits that 20 Mya a diploid (2N) grass progenitor separated into two lineages, one of which led directly to Sorghum bicolor (green lineage). Hybridization occurred about 11.5 Mya between two species, one derived from the green lineage about 16 Mya, to form a tetraploid (4N) species that gave rise to maize (red lineage). During the past 6 million years, repeated bursts of RTE amplification generated about half of the modern maize genome.
Figure 2.

Nearly all RTE insertions are into even older RTEs. A portion of a maize chromosome is illustrated, with genes depicted as black bars; pink arrowheads denote MITEs. RTE age is illustrated by both color (recently amplified RTEs are intense and more ancient RTEs are pale) and shape (the oldest RTEs are shown as colored bars along the chromosome backbone, with triangles of varying widths depicting younger RTEs with a diversity of lengths). Note that the genes of maize are untouched by RTE expansion. This pattern could arise because RTEs avoid genes as insertion sites or because natural selection eliminates the nonfunctional alleles caused by RTE insertion.
How does this turbulent history of the maize genome affect gene spacing? RTE explosions have dispersed up to tens of thousands of copies periodically over the last few million years, but it is unlikely that RTE insertions were specific to any particular sequences or genomic regions. All sequences should have been subjected to the expansion force of transposition. The naïve expectation is that all intergene distances would grow equally and be just like the 240-kb Adh1 region (8). With about 50,000 genes expected (based on recent polyploidization, it should be twice the number of Arabidopsis), maize genes should be about 50 kb apart. Surrounding bz1, however, genes exhibit a 50-fold reduction in average spacing (7).
Although unpredicted, upon reflection these results are not entirely surprising. For any particular region the expansion of RTEs depends not only on the probability of RTE insertion but also on the probability that natural selection allows fixation of that insertion in the population. The primary hurdle for an RTE is the existence of essential genes, because insertions there are often highly deleterious and eliminated. Because the ancestral genome of maize must have had some, even minimal, clumpiness in gene distribution, it follows that the initial RTE expansion should be more efficient in gene-poor regions than in gene-rich regions. A transpositional big bang does not affect all gene distances equally—the large distances get larger more quickly than the small ones, accentuating any preexisting clumpiness. What's more, this is a runaway process. Once the first RTE inserts into a region, it provides a stretch of nondeleterious insertion sites for new RTEs, in effect seeding a local RTE explosion. This means that growth of large gene distances accelerates over time, necessarily producing extreme differences in gene spacing visible today.
The bz region studied by Fu et al. (7) may represent an extreme example of RTE exclusion. Multiple, nested RTEs located at the right and left borders of the 10-gene bz region are a stark example of the power of RTE amplification [see figure 1 in Fu et al. (7)]. Was the gene-rich region so compact in the ancestral genome that not a single RTE insertion could occur within it without severely affecting fitness? If true, extreme compactness protected these genes from the RTE invasion that started 6 Mya, resulting in a doubling of maize genome size (12).
Experimental Analysis of Causes Underlying Compact Gene Spacing
Our hypothesis can be easily tested. Recent polyploidization predicts that there are two paralogous regions for most maize genes, a feature confirmed by high-density molecular mapping (13). The bz region on chromosome 9S is repeated on chromosome 2 (http://nucleus.agron.missouri.edu/cMap/cMap.html). These two regions have had a separate history for more than 11.5 Mya, predating the recent RTE explosions (Fig. 1). What is the gene spacing in the paralogous region on chromosome 2? Is it ultra-compact like the 9S bz interval, without RTEs? Or did at least one RTE insertion occur, followed by others to create an island of RTEs of varying ages, mirroring more typical chromosome regions? As long as there are at least a few nondeleterious sites, successive RTE expansions have a finite probability of inserting into this region. What we would not predict for the paralogous region is the presence of a single, ancient RTE without additional RTE invasions into it. Additionally, we predict that the bz region in small genome relatives of maize such as sorghum also would be more compact than the average gene region of that species. The magnitude of the compactness would probably be not as spectacular as it is in maize, but nevertheless it should be discernible.
It is also plausible that these 10 genes in the maize bz interval are selected for close proximity. This does not seem likely, as these gene lack obvious shared expression patterns or participation in a biochemical pathway. To test for this possibility, it would be necessary to compare multiple examples within the maize genome and between maize and sorghum. If paralogous gene clusters within maize exhibit region-specific spacing and the spacing in orthologous sorghum genes parallels in a predictable fashion, we would conclude that it is less likely that selection for local gene spacing determines close spacing. We consider it far more likely that periodic RTE expansions, tempered locally by the tolerance for insertions, were bound to produce an extremely uneven distribution of gene densities across the maize genome.
In contrast to RTEs, which reside outside of genes, the also abundant miniature inverted repeat transposons (MITEs) are commonly clustered near maize genes and even occur within the noncoding portions of genes [Fig. 2; see also figure 1 in Fu et al. (7)]. MITEs are rarely inserted into the RTE islands of the genome. MITEs and other DNA transposons (as opposed to RTEs, which have an RNA intermediate in their life cycle) appear to insert preferentially into coding regions (14); given their small size of 100–300 bases, MITE insertion may not even disrupt gene expression (15).
In considering the maize genome based on current evidence, we see that there are clusters of genes much like galaxies in the universe separated by large regions of “dark matter” composed mainly of RTE. Like dark matter among the stars, the impact of RTE is profound but indirect in shaping the organization of the visibly important genes, the bright stars of the nuclear genome. It is also becoming evident that random processes, including the chance for an initial RTE insertion to be close to a gene and the periodic nature of RTE explosions are responsible for much of the organization of the maize genome.
Acknowledgments
This work is supported by National Institutes of Health Grant GM49681 (to V.W.), National Science Foundation Grant IBN98–72657 (to V.W.), and a Stanford University OTL Award (to D.A.P.).
Footnotes
See companion article on page 8903.
References
- 1.Baltimore D. Nature (London) 2001;409:814–816. doi: 10.1038/35057267. [DOI] [PubMed] [Google Scholar]
- 2.Rubin G M, Yandell M D, Wortman J R, Miklos G L G, Nelson C R, Hariharan I K, Fortini M E, Li P W, Apweiler R, Fleischmann W, et al. Science. 2000;287:2204–2215. doi: 10.1126/science.287.5461.2204. [DOI] [PMC free article] [PubMed] [Google Scholar]
- 3.The Arabidopsis Genome Initiative. Nature (London) 2000;408:796–815. doi: 10.1038/35048692. [DOI] [PubMed] [Google Scholar]
- 4.Gregory T R. Biol Rev Camb Philos Soc. 2001;76:65–101. doi: 10.1017/s1464793100005595. [DOI] [PubMed] [Google Scholar]
- 5.Rayburn A L, Price H J, Smith J D, Gold J R. Am J Bot. 1985;72:1610–1617. [Google Scholar]
- 6.Bennett M D, Leitch I J. Ann Bot. 1995;76:113–176. [Google Scholar]
- 7.Fu H, Park W, Yan X, Zheng Z, Shen B, Dooner H K. Proc Natl Acad Sci USA. 2001;98:8903–8908. doi: 10.1073/pnas.141221898. . (First Published July 3, 2001; 10.1073/pnas.141221898) [DOI] [PMC free article] [PubMed] [Google Scholar]
- 8.SanMiguel P, Tikhonov A, Jin Y-K, Motchoulskaia N, Zakharov D, Melake-Berhan A, Springer P S, Edwards K J, Lee M, Avramova Z, Bennetzen J L. Science. 1996;274:765–768. doi: 10.1126/science.274.5288.765. [DOI] [PubMed] [Google Scholar]
- 9.Petrov D A. Trends Genet. 2001;17:23–28. doi: 10.1016/s0168-9525(00)02157-0. [DOI] [PubMed] [Google Scholar]
- 10.SanMiguel P, Gaut B S, Tikhonov A, Nakajima Y, Bennetzen J L. Nat Genet. 1998;20:43–45. doi: 10.1038/1695. [DOI] [PubMed] [Google Scholar]
- 11.Gaut B S, Le Thierry d'Ennequin M, Peek A S, Sawkins M C. Proc Natl Acad Sci USA. 2000;97:7008–7015. doi: 10.1073/pnas.97.13.7008. [DOI] [PMC free article] [PubMed] [Google Scholar]
- 12.Tikhonov A P, SanMiguel P J, Nakajima Y, Gorenstein N M, Bennetzen J L, Avramova Z. Proc Natl Acad Sci USA. 1999;96:7409–7414. doi: 10.1073/pnas.96.13.7409. [DOI] [PMC free article] [PubMed] [Google Scholar]
- 13.Wilson W A, Harrington S E, Woodman W L, Lee M, Sorrells M E, McCouch S R. Genetics. 1999;153:453–473. doi: 10.1093/genetics/153.1.453. [DOI] [PMC free article] [PubMed] [Google Scholar]
- 14.Walbot V. Annu Rev Plant Physiol Plant Mol Biol. 1992;43:49–82. [Google Scholar]
- 15.Wessler S R, Bureau T E, White S E. Curr Opin Genet Dev. 1995;5:814–821. doi: 10.1016/0959-437x(95)80016-x. [DOI] [PubMed] [Google Scholar]