

Abstract
To enhance new bone formation for the treating of patients with osteopenia and osteoporosis, various mechanical loading regimens have been developed. Although a wide spectrum of loading frequencies is proposed in those regimens, a potential linkage between loading frequencies and locations of loading-induced bone formation is not well understood. In this study, we addressed a question: Does mechanical resonance play a role in frequency dependent bone formation? If so, can the locations of enhanced bone formation be predicted through the modes of vibration? Our hypothesis is that mechanical loads applied at a frequency near the resonant frequencies enhance bone formation, specifically in areas that experience high principal strains. To test the hypothesis, we conducted axial tibia loading using low, medium, or high frequency to the mouse tibia, as well as finite element analysis. The experimental data demonstrated dependence of the maximum bone formation on location and frequency of loading. Samples loaded with the low frequency waveform exhibited peak enhancement of bone formation in the proximal tibia, while the high frequency waveform offered the greatest enhancement in the midshaft and distal sections. Furthermore, the observed dependence on loading frequencies was correlated to the principal strains in the first five resonance modes at 8.0 to 42.9 Hz. Collectively, the results suggest that resonance is a contributor to the frequencies and locations of maximum bone formation. Further investigation of the observed effects of resonance may lead to the prescribing of personalized mechanical loading treatments.
Keywords: tibia, loading, resonance frequency, bone mineral density, finite element analysis, strain
Introduction
Osteoporotic diseases and conditions lead to the deterioration of the skeleton and increased risk of bone fracture, and are a major public health concern (Harvey et al. 2010; Kanis et al. 2012; van den Bergh et al. 2012). Many of these conditions, such as space flight and bed rest-related disuse osteoporosis, are initiated by lack of normal mechanical loading during everyday activities (Huang et al. 2003; Lau and Guo 2011). Previous studies have determined that dynamic mechanical loading modalities, such as whole-body vibration, bone bending, axial loading, and joint loading, are potential treatment methods for increasing bone mass in patients afflicted with a condition marked by bone loss (Zhang et al. 2006; Ozcivici et al. 2010; Grimston et al. 2012; Silva et al. 2005). Depending on the modality, a wide range of frequencies of loading have been implemented in bone loading studies. These frequencies commonly correspond closely to a physiological frequency, such as that of walking or running, in an effort to closely mimic deformations achieved during these activities (Donahue et al. 2001; Hsieh and Turner 2001). Various studies have investigated the role loading frequency plays in bone remodeling and formation, and results indicate that maximum bone formation differs depending on loading frequencies and targeted locations of bones (Hsieh and Turner 2001; Zhang et al. 2007; Kameo et al. 2011; Tanaka et al. 2003; Warden and Turner 2004). However, the mechanism of this observed frequency dependence remains unknown.
The aim of this study was to evaluate a biomechanical mechanism underlying the observed dependence of bone formation on loading frequency. We addressed a question: Does resonance play a role in frequency dependent bone formation? If so, can the locations of enhanced bone formation be explained through the modes of vibration of the tibia? Since bone is a relatively stiff material and has a low damping ratio (Chattah et al. 2009), we hypothesized that mechanical loads applied at a frequency near a resonant frequency enhance bone formation, specifically in areas that experience higher first and third principal strains due to the effects of resonance. When loading is applied to such a material at or near its resonant frequencies, additional energy is absorbed and the material tends to vibrate at greater amplitude than when loading is applied at other frequencies. These vibrations propagate through the material in specific ways, or modes, based on the geometry and characteristics of the material. Finite element (FE) analysis can be used to predict the resonant frequencies and corresponding modes of vibration of an object (Guo et al. 2009; Taylor et al. 2002; Kim and Hwang 2006), in addition to expected displacements and strains during vibration.
Many factors may determine the frequencies and modes of vibration of the tibia. Material properties and geometry of the bone, along with the assumed boundary conditions, are important aspects (Hight et al. 1980). In addition, the complex composition and organization of the tibia may also contribute to its frequency response. The tibia is composed of a shell of dense, stiff cortical bone that is thinnest on the outside of each epiphysis and thickest throughout the diaphysis. Inside the epiphysis a matrix of less dense, weaker trabecular bone is present. An epiphyseal plate is found at the border between the each epiphysis and diaphysis, which consists of hyaline cartilage. Each type of tissue likely contributes to the frequency response of the tibia.
To test the hypothesis, experimental and numerical methods were employed. Dynamic axial loading using composite waveforms of low, medium, or high frequency was applied to the lower hindlimb of mice, and volumetric bone mineral density (vBMD) and histomorphometry were used to quantify loading-induced bone formation. Since axial loading has been shown to produce the greatest anabolic effects in cortical bone, especially near the midshaft where bending-induced stresses are largest (Weatherholt et al. 2013; De Souza et al. 2005), this experiment focuses on cortical bone formation. To evaluate the experimental data, numerical simulations using a FE model were conducted. A three-dimensional model of the cortical bone component of the murine tibia was constructed using μCT imaging and modal analysis was performed to investigate the resonant frequencies and modes of vibration. Displacements and principal strains (first and third) during vibration were determined, and linkages between observed experimental data and predicted computational results were then evaluated.
Materials and Methods
Seventeen mice (C57BL/6 male, ~13 weeks old) were used in this study. Experimental procedures were approved by the Indiana University Animal Care and Use Committee and were in compliance with the Guiding Principles in the Care and Use of Animals endorsed by the American Physiological Society.
Axial tibia loading
The mouse was placed in an anesthetic induction chamber to cause sedation and then mask-anesthetized using 2.0% isoflurane (Fig. 1A). Axial loading was applied to the right tibia daily for two weeks using a voltage-regulated loading device (ElectroForce 3100, Bose, Inc.). The left tibia of each mouse was used as a non-loaded contralateral control. The loading condition consisted of a 7 N (peak-to-peak force) composite waveform comprised of a series of sinusoidal waves from a low, medium, or high frequency group (Fig. 1B). The low frequency group, consisting of 6 animals, was exposed to a loading waveform that began at 1 Hz and increased consecutively by a 1 Hz increment to 17 Hz. The medium group covered the range of 18 Hz to 34 Hz (1 Hz increment) and utilized 5 animals. Six animals underwent high frequency loading, which consisted of a loading waveform beginning at 35 Hz and increasing consecutively by a 1 Hz increment to 51 Hz. Each composite waveform consisted of one cycle of each frequency (from minimum to maximum) in the group combined consecutively at the peak of each wave. To ensure continuity, the composite waveform immediately following was reversed. Each loading group received 200 repetitions of each frequency in the low, medium, or high range daily.
Figure 1.

Mechanical loading regimen and configuration. (A) Tibia axial loading configuration. (B) Graphical representation of the low frequency, medium frequency, and high frequency loading waveforms applied axially to the tibiae of mice. (C) Power spectrum of the loading waveforms.
Peripheral quantitative computed tomography (pQCT)
To determine vBMD, pQCT was employed (XCT Research SA Plus, software 5.40; Norland- Stratec Medizintechnik GmbH, Birkenfel, Germany). Tibiae from loaded and non-loaded limbs were harvested and fixed in 10% neutral buffered formalin. Sections at 8%, 33%, 50%, and 66% of the length of the bone from the proximal end were scanned at five consecutive cross-sections with a sectional distance of 0.4 mm, where each section was 260 m in thickness with a voxel size of 70 m (source current: 300 μA; source voltage: 50 kV; 105 μ Cu filter). Scans were analyzed for total density at a threshold of 710 mg/cm3 using manufacturer provided software. Data was presented as the change in vBMD (ΔvBMD), which is defined as the difference in vBMD between the loaded (right) and the non-loaded control (left) tibiae, such that ΔvBMD = loaded − non-loaded.
Bone histomorphometry
To study locations of maximum bone formation due to axial loading, 0.6% calcein (30 mg/kg body mass; Sigma Chemical Co., St. Louis, MO) and 1.0% alizarin (50 mg/kg body mass; Sigma Chemical Co., St. Louis, MO) were injected 8 and 3 days prior to euthanasia, respectively. After euthanasia, specimens were dehydrated in a series of graded alcohols and embedded in 99% methyl methacrylate with 3% dibutyl phthalate (Aldrich Chemical Co., Milwaukee, WI). Transverse sections (20 – 30 μm in thickness) at 8% and 66% locations along the length of the tibia were removed using a diamond-embedded wire saw (Histo-saw, Delaware Diamond Knives, Wilmington, DE) (Martinez et al. 2010; Robling et al. 2008; Warden et al. 2005). After polishing the surface, sections were mounted on standard microscope slides. Total perimeter, endocortical perimeter, single-labeled perimeter, double-labeled perimeter, and double-labeled area were measured, and the ratio of labeled surface to total bone surface (LS/BS) (Parfitt et al. 1987) was determined using OsteoMeasureXP analysis software (version 3.2, OsteoMeasure, Inc., Decatur, IL) on an Olympus fluorescent microscope (model BX53F, Olympus America Inc., Center Valley, PA). Data was presented as the change in LS/BS (ΔLS/BS), which is defined as the difference in LS/BS between the loaded (right) and the non-loaded control (left) tibiae, such that ΔLS/BS = loaded − non-loaded.
Finite element (FE) model
MicroCT images of an isolated tibia were produced using a Scanco VivaCT 40 imaging machine (Scanco Medical AG) and reconstructed into a 3D mesh using MIMICS 13.1 (Materialise, Inc.) (Fig. 4A). The 3D mesh consisted of approximately 10000 tetrahedral units and was imported into COMSOL Multiphysics software (version 4.2, COMSOL, Inc.). In order to closely simulate physiological conditions, two boundary conditions were set by “pinning” the bone at the ends by restricting the movement of tetrahedral units on the surface of the knee joint and ankle joint. Material properties of cortical bone, such as Poisson’s’ ratio, Young’s modulus, and density, were obtained from literature and pQCT data (Chattah et al. 2009; Fortis et al. 2004; Roderic 1998). Values used for these constants were 0.35, 8.9 GPa, and 1,167 kg/m3 for Poisson’s ratio (ν), Young’s modulus (E), and density (ρ), respectively. A builtin eigenfrequency solver was used to determine the first five frequencies and modes of vibration of the tibia model. Post-processing of the model data allowed determination of distributions of first and third principal strains for each of the vibrational modes.
Figure 4.
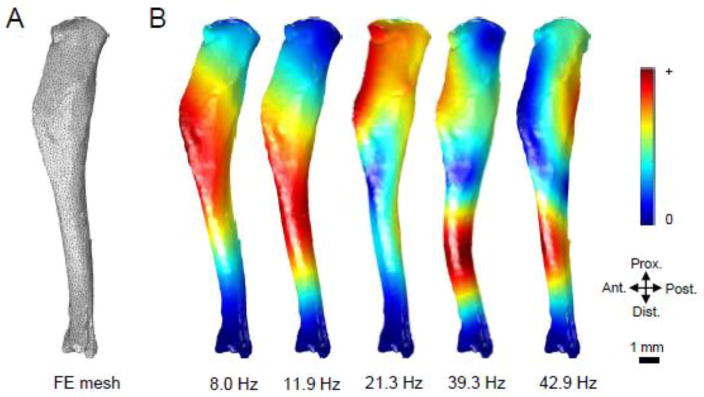
Modal analysis using finite element methods to determine the resonant frequencies and modes of vibration of the tibia. (A) A FE mesh of the cortical component of the tibia was produced using μCT imaging. Material properties of the cortical bone (E = 8.9 GPa; ν = 0.35; ρ = 1,167 kg/m3) and boundary conditions were set to mimic physiological conditions. (B) The first five resonant frequencies were predicted to be 8.0 Hz, 11.9 Hz, 21.3 Hz, 39.3 Hz, and 42.9 Hz. Displacement distributions demonstrate areas of maximum motion during vibration, where red zones denote larger displacements.
In order to quantify the locations of maximum principal strain predicted by the FE model, an average strain was calculated at the 8% and 66% level for each of the first five vibrational modes of the tibia. In each location, the sum of the principal strain value at each node of the FE mesh was divided by the total number of nodes in the section to obtain an average strain within that section. The relative strain between locations was calculated by dividing the average principal strain in the 8% location by the average principal strain in the 66% location. This ratio was calculated for each the first and third principal strain distributions.
Statistical considerations
The mean and standard deviation of all data were calculated, and the Student’s t-test was used to determine statistical significance. Since all comparisons were made between different loading groups, an unpaired two-tailed t-test was utilized. P-values of less than 0.05 (*) were determined to be significant, with p-values of less than 0.01 (**) denoting a higher level of significance.
Results
Axial loading was subjected to the tibiae of mice at a low, medium, and high frequency range (Fig. 1B). Spectral analysis of the loading waveform in each group verified that the focus of each signal was applied to the intended frequency range in each loading group (Fig. 1C).
Volumetric BMD was used to quantify bone formation in the loaded samples (Fig. 2). Difference in vBMD (ΔvBMD) was defined as the average vBMD of contralateral control (left tibiae) samples subtracted from the average vBMD of the loaded samples (right tibiae). Little change in vBMD was seen at the 8% location in samples loaded with a medium frequency waveform. However, an increase in vBMD of 109.9 ± 67.1 mg/cm3 in the low frequency group and a decrease in vBMD of 28.5± 33.9 mg/cm3 in the high frequency group were seen at this tibia location, a statistically significant difference (p<0.01). At the 33% mark, increases in vBMD of 48.6 ± 19.6 mg/cm3, 31.0 ± 25.4 mg/cm3, and 21.6 ± 11.7 mg/cm3 in response to low, medium, and high frequency waveforms, respectively, were observed. In the distal section of the bone, the trend of larger vBMD gains in the low frequency group that was seen in the 8% through 33% tibia locations was reversed. A small increase in vBMD due to a low frequency waveform at the 50% location was seen, but a statistically larger increase of 42.9 ± 4.7 mg/cm3 was noted in the high frequency group (p<0.05). At the 66% location, a decrease in vBMD of 47.6 ± 25.0 mg/cm3 was observed in the low frequency group, while a small, but significantly different increase in vBMD was noted in response to a high frequency waveform (p<0.01).
Figure 2.

Difference in vBMD was determined between non-loaded and loaded samples at 8%, 33%, 50%, and 66% of the tibia’s length. Medium and high frequency responses were compared to the low frequency response using a two-tailed Student’s t-test to determine statistical significance.
To distinguish the exact locations of observed bone formation in loaded samples, bone histomorphometry was utilized using calcein and alizarin labeling. Non-loaded control samples, in addition to low and high frequency loaded samples, were analyzed at 8% and 66% of the tibia’s length. Representative histomorphometric sections demonstrate that low and high frequency provided maximum bone stimulation in the 8% and 66% locations, respectively, when compared to a non-loaded contralateral control (Fig. 3A–B). Specifically, low frequency loading was found to produce the largest enhancement of bone formation in the medial quadrants of the 8% cross section, while a smaller degree of stimulation was observed in the posterior-lateral quadrant of the 66% cross section. Most bone formation was noted on the periosteum in each low frequency-loaded section. High frequency loading provided maximum stimulation in the periosteal posterior-medial and anterior-lateral quadrants of the 66% cross section, and some stimulation was also noted in posterior portions of the endosteum. The 8% cross section, while experiencing less bone formation than the 66% section, showed maximum stimulation on the anterior face of the periosteum and sections of the posterior-lateral quadrant of the endosteum.
Figure 3.

Bone histomorphometry. (A) Representative histomorphometric images of the 8% and 66% cross sections. Calcein (green) and alizarin (red) labeling was used to visualize areas of maximum bone formation in response to no loading, low frequency loading, and high frequency loading. (B) Zoomed regions of interest showing labeling in the periosteum on the medial face of the 8% and 66% cross sections. The letter labels are: P – posterior; A – anterior; M – medial; and L – lateral. (C) The change in ratio of labeled surface to bone surface (ΔLS/BS) was determined at the 8% and 66% locations in response to low and high frequency loading waveforms. Statistical significance was determined between the low and high frequency response at the 8% location and the high frequency responses at each location using a two-tailed Student’s t-test.
Percent change in LS/BS was determined to quantify the observed frequency dependence in bone formation. In the proximal tibia (8% length) the percent increase in LS/BS was 20.9 ± 3.8% in samples loaded at a low frequency, and 9.6 ± 4.9% in samples loaded at a high frequency, a statistically significant difference (p<0.01) (Fig. 3C). At 66% of the bone’s length, the increase in LS/BS in loaded samples was 18.6 ± 4.3% and 25.8 ± 8.7% at low and high frequencies, respectively. A statistically significant increase in percent change in LS/BS was found between samples subjected to a high frequency load at 8% and 66% of the tibia length (p<0.01).
Modal analysis using FE modeling was utilized to determine the first five resonant frequencies and vibrational modes of a tibia model. These frequencies were found at 8.0 Hz, 11.9 Hz, 21.3 Hz, 39.3 Hz, and 42.9 Hz for modes 1 through 5, respectively. Displacement distributions were modeled in order to obtain a visualization of the movement experienced by the tibia during vibration at each frequency (Fig. 4B). Red colors demonstrate areas subjected to a higher peak displacement, while blue colors showed displacements near zero. The mode of vibration corresponding to the first two frequencies exhibited bending across the entire bone, where peak displacement is found near the 33% distal mark in mode 1 and the midshaft in mode 2. Peak displacements in Modes 3 through 5 provide evidence of more than one axis of bending. For example, Modes 4 and 5 showed small displacements near the proximal end, but larger movement was seen near the 66% distal mark.
FE analysis was used to demonstrate the distributions of first principal strains during vibration at the first five resonant frequencies (Fig. 5A–D). Blue colors designate locations predicted to experience strains close to zero, while red areas are predicted to experience larger positive (tensile) strains. The first two modes, vibrating at a frequency of 8.0 Hz and 11.9 Hz, were subjected to the highest levels of first principal strains near the proximal end, with slightly smaller values seen near the midshaft and distal end. The third mode, which vibrates at 21.3 Hz, saw peak first principal strains near the midshaft and 66% mark. The fourth and fifth modes (39.3 and 42.9 Hz, respectively) each showed peak first principal strain values near the 50% and 66% marks, with lower values demonstrated proximally. Each mode showed a small region of higher strain near the distal end of the bone beyond the 66% mark. Cross sections at the 8% and 66% locations demonstrate first principal strain distributions within the cortical bone for each of the first five modes (Fig. 5E). The first through third modes were predicted to experience the largest areas of high first principal strain at the 8% location, primarily in the posterior-lateral quadrant. The fourth and fifth modes experienced lower magnitude strains at this location. In the 66% location cross section, the predicted position of peak first principal strain varied between vibrational modes, but the second through fifth modes were expected to experience the highest magnitude strain.
Figure 5.

Distribution of first principal strains in the first five vibration modes of the tibia. Red coloring represents areas of greater positive (tensile) strains, while blue coloring denotes areas experiencing very little strain. (A) Posterior surface. (B) Lateral surface. (C) Anterior surface. (D) Medial surface. (E) Cross sections of the tibia from each vibrational mode were analyzed at 8% and 66% locations. The letter labels are: P – posterior; A – anterior; M – medial; and L – lateral.
The third principal strain distributions in the first five vibration modes of the tibia were also studied using FE analysis (Fig. 6A–D). Red colors represent areas that were predicted to undergo negative (compressive) third principal strains, while blue colors denote locations where strains are near zero. In the first two vibrational modes predicted by the FE model, peak third principal strains were in the ends and midshaft of the tibia, with very little strain near the 33% mark. The third, fourth, and fifth modes were predicted to show smaller magnitudes of third principal strain in the proximal end of the bone, but larger magnitude strains in the 33% to 66% marks. In the fourth and fifth modes, the peak second principal strain was predicted near the 66% location, but significant strains were also found near the 33% mark. Cross sections demonstrate third principal strain distributions in the cortical bone at 8% and 66% locations (Fig. 6E). Peak third principal strains were predicted in the anterior-lateral quadrant of the 8% location in the first vibrational mode. The second through fifth modes were expected to experience lower magnitude strains. At the 66% location, the maximum strains were expected in the posterior-medial quadrant of the higher modes, with the lower modes showing smaller magnitudes of strain.
Figure 6.

FE analysis of third principal strains in the first five vibration modes of the tibia. Red coloring represents areas of greatest compressive strains, while blue coloring denotes areas experiencing strain near zero. (A) Posterior surface. (B) Lateral surface. (C) Anterior surface. (D) Medial surface. (E) Cross sections of the tibia from each vibrational mode were analyzed at 8% and 66% locations. The letter labels are: P – posterior; A – anterior; M – medial; and L – lateral.
The relative principal strain at the 8% location to the 66% location was calculated for each of the vibrational modes to quantify locations of maximum first and third principal strains (Fig. 7). Predicted strains in the 8% section were approximately 20% and 30% greater than strains predicted in the 66% section of the lowest mode for the first and third principal strain, respectively. The ratio dropped to approximately 1 in the second mode for each the first and third principal strains, and continued to fall consecutively in the third through fifth modes. In the third and fourth modes, the expected first and third principal strains at the 8% location were approximately 40% to 60% of those at the 66% location. In the fifth mode, strains at the 66% location were predicted to be approximately 4-fold larger than at the 8% location for each the first and third modes.
Figure 7.
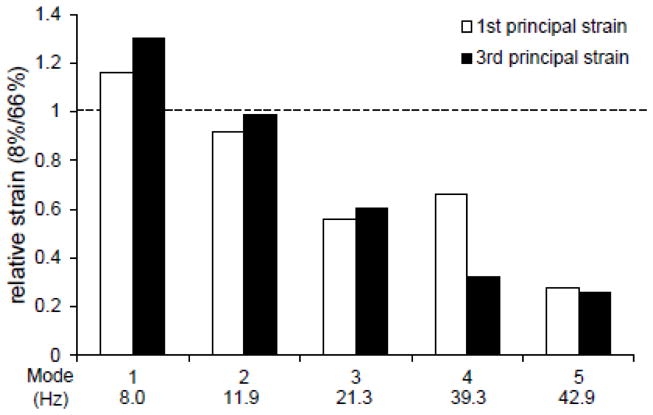
Relative strain between 8% and 66% locations in the first five vibrational modes of the tibia. First and third principal strain values at each node of the FE mesh in the 8% and 66% cross sections were summed then divided by the total number of nodes. Data shown represents a ratio of the average strain at the 8% location to that of the 66% location for each vibrational mode.
Discussion
The experimental data demonstrated a dependence of the maximum bone formation on location and frequency of loading. Samples loaded with the low frequency waveform exhibited peak enhancement of bone formation in the proximal (8–33%) locations of the tibia, while the high frequency waveform offered the greatest enhancement in the midshaft (50%) and distal (66%) sections. In the midshaft and distal sections, this trend was reversed, and largest increases in bone formation were observed when a high frequency load was applied. These results suggest that the proximal section responds most strongly to low frequency loading (1–17 Hz), while medium (18–34 Hz) and high (35–51 Hz) frequency loading provide successively diminished beneficial effects. The midshaft and distal sections respond strongest to high frequency loads, with low and medium frequency loads providing a smaller anabolic effect.
Modal analysis using FE modeling provided a correlation between the experimental results and the vibrational modes. The first five resonant frequencies were predicted to be 8.0, 11.9, 21.3, 39.3, and 42.9 Hz, and distributions of first and third principal strains were determined. The average first and third principal strains at the 8% mark were predicted to be at least 20% greater than strains at the 66% mark in the first vibrational mode, and approximately 4-fold less in the fifth mode. Since areas of higher first and third principal strains are expected to exhibit more bone formation, a link to experimental data was detected. FE predictions show that mechanical loading in the range of the lower frequency group, corresponding to the frequencies of vibration of the first two resonant modes, should provide maximum enhancement of bone formation in the proximal tibia. Higher frequency loading, which encompasses the fourth and fifth predicted resonant modes, is expected to provide the greatest enhancement of bone formation in the midshaft and distal sections of the bone.
FE analysis also provided a correlation between predicted principal strains and maximum bone formation within the 8% and 66% cross sections. In the 66% cross section, for instance, peak third principal strain was predicted in the posterior-medial quadrant, approximately the same area that experienced the most bone growth following high frequency loading. Peak first principal strain was predicted in the anterior-lateral quadrant, an area that also experienced bone growth in response to high frequency loading. While correlations were not as strong in the 8% cross section, a link between bone formation due to low frequency loading in the medial quadrants and principal strains predicted in the proximal-medial quadrant of the first mode was observed. The weaker correlation at the 8% level may be due to small variations in geometry between the bone used for the representative histomorphometry section and the bone used to construct the FE model. These variations may alter strain distributions and resulting bone formation.
When a periodic load is applied at or near one of an object’s resonant frequencies, it tends to absorb more energy and oscillate at greater amplitudes than at other loading frequencies. In the case of the tibia, loading at frequencies near the resonant frequencies of the bone may be causing more energy to be dissipated and larger displacements in certain areas of the bone than loading at other frequencies with equal amounts of force. This may lead to increased strain rates, amplified intramedullary fluid flow, increased fluid shear stresses on bone cells, and enhanced cellular response in areas that absorb the most energy (Warden et al. 2004; Zhang et al. 2007; Kwon et al. 2012). Compressive strain on the medial face of the midshaft of the tibia due to a 7 N axial load at 2 Hz has been shown to be approximately 1,250 με (Weatherholt et al. 2013; De Souza et al. 2005). In addition to resonance, other factors likely contribute to the observed frequency dependence of maximum bone formation. For example, bone is a vascularized organ with a network of neurons. Mechanical loading is known to affect blood circulation as well as neuronal signaling (Lam et al. 2010; Sample et al. 2008). Therefore, loading-induced bone formation cannot be attributed solely to biomechanical factors.
Because of the effects of damping in surrounding tissues, it is expected that transmission of the loading force through surrounding tissues, such as skin, muscle, and joint tissue, may modify the frequencies at which the tibia resonates (Kim and Hwang 2006; Tsuchikane et al. 1995; Dodge et al. 2012). In addition, frequencies of vibration may vary among individual animals based on slight alterations in size or proportion. To allow for potential variations in actual resonant frequencies, a composite loading waveform was developed. This waveform allowed for many frequencies of loading to be applied in a single loading session in each a low, medium, and high frequency range, increasing the likelihood of loading near a resonant frequency. Similar experiments have been performed using axial loading at the frequencies of 20 to 150 Hz to investigate the frequency response of the murine tibia (Christiansen et al. 2008). This work differs from the current experiment due to the boundary conditions and loading waveforms.
The current study has limitations in the experimental data and the computational results. First, bone formation was analyzed at six positions using X-ray imaging and two positions using histomorphometry. A more comprehensive study could provide a better comparison between the experimental and computational results. Second, although cortical bone is a major structural component of the tibia and sensitive to load-driven bone formation (Weatherholt et al. 2013; De Souza et al. 2005), the overall frequency response cannot be solely attributed to cortical bone. Future studies may incorporate not only cortical bone but also trabecular bone and growth plates, as well as surrounding tissues such as muscle, skin, and joints. Third, experimental evaluation of the resonant frequencies can be conducted using a vibration table that is capable of sensing a transfer of resonance energy. For the resonance frequencies of the mouse femur, the reported difference between the predicted and experimentally determined values was approximately 15% for the lowest frequency at ~ 20 Hz (Kim et al. 2006).
Mechanical properties of bone, such as Young’s modulus, may vary depending on global factors, such as age and gender, in addition to local factors caused by anisotropy in the bone structure. For this reason, the sensitivity of the FE model to variations in Young’s modulus was determined. An increase in Young’s modulus of 10% was found to raise the resonant frequency of the first mode 4.9%, while a decrease in Young’s modulus of 10% dropped the first resonant frequency 5.1%. This represents a non-linear relationship that is more sensitive to lower values of Young’s modulus.
In this study, we demonstrate that resonance may be a significant contributor to the frequencies and locations of maximum bone formation during axial loading of the tibia. To our knowledge, this is the first study to investigate the link between an observed frequency-dependence of bone formation due to mechanical loading and mechanical resonance of the loaded bone. Further investigation of the observed effects of resonance may lead to the prescribing of personalized mechanical loading treatments for patients afflicted with low bone mass. In this study we employed a mouse tibia as a model system, but resonance frequencies of human bones differ (Hight et al. 1980; Hobatho et al. 1991). By using resonance analysis to target specific bones or areas of bones for maximum stimulatory effects, the number of cycles and required force for treatment may be decreased, lessening the burden of treatment.
Acknowledgments
This study was in part supported by the grant NIH R01 AR052144.
Footnotes
The authors report no conflicts of interest.
References
- Chattah NL, Sharir A, Weiner S, Shahar R. Determining the elastic modulus of mouse cortical bone using electronic speckle pattern interferometry (ESPI) and micro computed tomography: a new approach for characterizing small-bone material properties. Bone. 2009;45(1):84–90. doi: 10.1016/j.bone.2009.03.664. [DOI] [PubMed] [Google Scholar]
- Christiansen BA, Bayly PV, Silva MJ. Constrained tibial vibration in mice: a method for studying the effects of vibrational loading of bone. J Biomech Eng. 2008;130(4):044502. doi: 10.1115/1.2917435. [DOI] [PMC free article] [PubMed] [Google Scholar]
- De Souza RL, Matsuura M, Eckstein F, Rawlinson SCF, Lanyon LE, Pitsillides AA. Non-invasive axial loading of mouse tibiae increases cortical bone formation and modifies trabecular organization: A new model to study cortical and cancellous compartments in a single loaded element. Bone. 2005;37:810–818. doi: 10.1016/j.bone.2005.07.022. [DOI] [PubMed] [Google Scholar]
- Dodge T, Wanis M, Ayoub R, Zhao L, Watts NB, Bhattacharya A, Akkus O, Robling A, Yokota H. Mechanical loading, damping, and load-driven bone formation in mouse tibiae. Bone. 2012;51(4):810–818. doi: 10.1016/j.bone.2012.07.021. [DOI] [PMC free article] [PubMed] [Google Scholar]
- Donahue SW, Jacobs CR, Donahue HJ. Flow-induced calcium oscillations in rat osteoblasts are age, loading frequency, and shear stress dependent. Am J Physiol Cell Physiol. 2001;281(5):C1635–41. doi: 10.1152/ajpcell.2001.281.5.C1635. [DOI] [PubMed] [Google Scholar]
- Fortis AP, Kostopoulos V, Panagiotopoulos E, Tsantzalis S, Kokkinos A. Viscoelastic properties of cartilage-subchondral bone complex in osteoarthritis. J Med Eng Technol. 2004;28(5):223–6. doi: 10.1080/03091900410001676003. [DOI] [PubMed] [Google Scholar]
- Grimston SK, Watkins MP, Brodt MD, Silva MJ, Civitelli R. Enhanced periosteal and endocortical responses to axial tibial compression loading in conditional connexin43 deficient mice. PLoS One. 2012;7(9):e44222. doi: 10.1371/journal.pone.0044222. [DOI] [PMC free article] [PubMed] [Google Scholar]
- Guo LX, Zhang M, Zhang YM, Teo EC. Vibration modes of injured spine at resonant frequencies under vertical vibration. Spine. 2009;34(19):E682–688. doi: 10.1097/BRS.0b013e3181b1fdf4. [DOI] [PubMed] [Google Scholar]
- Harvey N, Dennison E, Cooper C. Osteoporosis: impact on health and economics. Nat Rev Rheumatol. 2010;6(2):99–105. doi: 10.1038/nrrheum.2009.260. [DOI] [PubMed] [Google Scholar]
- Hight TK, Piziali RL, Nagel DA. Natural frequency analysis of a human tibia. J Biomech. 1980;13(2):139–147. doi: 10.1016/0021-9290(80)90188-8. [DOI] [PubMed] [Google Scholar]
- Hobatho MC, Darmana R, Pastor P, Barrau JJ, Laroze S, Morucci JP. Development of a three-dimensional finite element model of a human tibia using experimental modal analysis. J Biomech. 1991;24(6):371–383. doi: 10.1016/0021-9290(91)90026-j. [DOI] [PubMed] [Google Scholar]
- Hsieh YF, Turner CH. Effects of loading frequency on mechanically induced bone formation. J Bone Miner Res. 2001;16(5):918–924. doi: 10.1359/jbmr.2001.16.5.918. [DOI] [PubMed] [Google Scholar]
- Huang TH, Lin SC, Chang FL, Hsieh SS, Liu SH, Yang RS. Effects of different exercise modes on mineralization, structure, and biomechanical properties of growing bone. J Appl Physiol. 2003;95(1):300–307. doi: 10.1152/japplphysiol.01076.2002. [DOI] [PubMed] [Google Scholar]
- Kameo Y, Adachi T, Hojo M. Effects of loading frequency on the functional adaptation of trabeculae predicted by bone remodeling simulation. J Mech Behav Biomed Mater. 2011;4(6):900–908. doi: 10.1016/j.jmbbm.2011.03.008. [DOI] [PubMed] [Google Scholar]
- Kanis JA, Oden A, McCloskey EV, Johansson H, Wahl DA, Cooper C. A systematic review of hip fracture incidence and probability of fracture worldwide. Osteoporos Int. 2012;23(9):2239–2256. doi: 10.1007/s00198-012-1964-3. [DOI] [PMC free article] [PubMed] [Google Scholar]
- Kim KJ, Hwang IK. Prediction of resonance characterisitics of the forearm bones using finite element analysis. J Musculoskeletal Res. 2006;10(4):205–15. [Google Scholar]
- Kim YH, Byun CH, Oh TY. Effect of Osteoporosis on Natural Frequencies in Mouse Femur: Vibration Test and Micro-CT Based Finite Element Analysis. Key Eng Mater. 2006;326–328:851–854. [Google Scholar]
- Kwon RY, Meays DR, Meilan AS, Jones J, Miramontes R, Kardos N, Yeh JC, Frangos JA. Skeletal adaptation to intramedullary pressure-induced interstitial fluid flow is enhanced in mice subjected to targeted osteocyte ablation. PLoS One. 2012;7(3):e33336. doi: 10.1371/journal.pone.0033336. [DOI] [PMC free article] [PubMed] [Google Scholar]
- Lakes R. Viscoelastic Solids. CRC Press; Boca Raton: 1999. [Google Scholar]
- Lam H, Brink P, Qin YX. Skeletal nutrient vascular adaptation induced by external oscillatory intramedullary fluid pressure intervention. J Orthop Surg Res. 2010;5:18. doi: 10.1186/1749-799X-5-18. [DOI] [PMC free article] [PubMed] [Google Scholar]
- Lau RY, Guo X. A review on current osteoporosis research: with special focus on disuse bone loss. J Osteoporos. 2011;2011:293808. doi: 10.4061/2011/293808. [DOI] [PMC free article] [PubMed] [Google Scholar]
- Martinez MD, Schmid GJ, McKenzie JA, Ornitz DM, Silva MJ. Healing of non-displaced fractures produced by fatigue loading of the mouse ulna. Bone. 2010;46(6):1604–1612. doi: 10.1016/j.bone.2010.02.030. [DOI] [PMC free article] [PubMed] [Google Scholar]
- Ozcivici E, Luu YK, Rubin CT, Judex S. Low-level vibrations retain bone marrow’s osteogenic potential and augment recovery of trabecular bone during reambulation. PLoS One. 2010;5(6):e11178. doi: 10.1371/journal.pone.0011178. [DOI] [PMC free article] [PubMed] [Google Scholar]
- Parfitt MA, Drezner MK, Glorieux FH, Kanis JA, Malluche H, Meunier PJ, Ott SM, Recker RR. Bone Histomorphometry: Standardization of Nomenclature, Symbols, and Units. J Bone Miner Res. 1987;2(6):595–610. doi: 10.1002/jbmr.5650020617. [DOI] [PubMed] [Google Scholar]
- Robling AG, Niziolek PJ, Baldridge LA, Condon KW, Allen MR, Alam I, Mantila SM, Gluhak-Heinrich J, Bellido TM, Harris SE, Turner CH. Mechanical stimulation of bone in vivo reduces osteocyte expression of Sost/sclerostin. J Biol Chem. 2008;283(9):5866–5875. doi: 10.1074/jbc.M705092200. [DOI] [PubMed] [Google Scholar]
- Sample SJ, Behan M, Smith L, Oldenhoff WE, Markel MD, Kalscheur VL, Hao Z, Miletic V, Muir P. Functional adaptation to loading of a single bone is neuronally regulated and involves multiple bones. J Bone Miner Res. 2008;23(9):1372–1381. doi: 10.1359/jbmr.080407. [DOI] [PMC free article] [PubMed] [Google Scholar]
- Sawakami K, Robling AG, Ai M, Pitner ND, Liu D, Warden SJ, Li J, Maye P, Rowe DW, Duncan RL, Warman ML, Turner CH. The Wnt co-receptor LRP5 is essential for skeletal mechanotransduction but not for the anabolic bone response to parathyroid hormone treatment. J Biol Chem. 2006;281(33):23698–23711. doi: 10.1074/jbc.M601000200. [DOI] [PubMed] [Google Scholar]
- Silva MJ, Brodt MD, Hucker WJ. Finite element analysis of the mouse tibia: estimating endocortical strain during three-point bending in SAMP6 osteoporotic mice. Anat Rec A Discov Mol Cell Evol Biol. 2005;283(2):380–390. doi: 10.1002/ar.a.20171. [DOI] [PubMed] [Google Scholar]
- Tanaka SM, Alam IM, Turner CH. Stochastic resonance in osteogenic response to mechanical loading. FASEB J. 2003;17(2):313–314. doi: 10.1096/fj.02-0561fje. [DOI] [PubMed] [Google Scholar]
- Taylor WR, Roland E, Ploeg H, Hertig D, Klabunde R, Warner MD, Hobatho MC, Rakotomanana L, Clift SE. Determination of orthotropic bone elastic constants using FEA and modal analysis. J Biomech. 2002;35(6):767–773. doi: 10.1016/s0021-9290(02)00022-2. [DOI] [PubMed] [Google Scholar]
- Tsuchikane A, Nakatsuchi Y, Nomura A. The influence of joints and soft tissue on the natural frequency of the human tibia using the impulse response method. Proc Inst Mech Eng H. 1995;209(3):149–155. doi: 10.1243/PIME_PROC_1995_209_337_02. [DOI] [PubMed] [Google Scholar]
- van den Bergh JP, van Geel TA, Geusens PP. Osteoporosis, frailty and fracture: implications for case finding and therapy. Nat Rev Rheumatol. 2012;8(3):163–172. doi: 10.1038/nrrheum.2011.217. [DOI] [PubMed] [Google Scholar]
- Warden SJ, Robling AG, Sanders MS, Bliziotes MM, Turner CH. Inhibition of the serotonin (5-hydroxytryptamine) transporter reduces bone accrual during growth. Endocrinology. 2005;146(2):685–693. doi: 10.1210/en.2004-1259. [DOI] [PubMed] [Google Scholar]
- Warden SJ, Turner CH. Mechanotransduction in the cortical bone is most efficient at loading frequencies of 5–10 Hz. Bone. 2004;34(2):261–270. doi: 10.1016/j.bone.2003.11.011. [DOI] [PubMed] [Google Scholar]
- Weatherholt AM, Fuchs RK, Warden SJ. Cortical and trabecular bone adaptation to incremental load magnitudes using the mouse tibial axial compression loading model. Bone. 2013;52(1):372–379. doi: 10.1016/j.bone.2012.10.026. [DOI] [PMC free article] [PubMed] [Google Scholar]
- Zhang P, Su M, Liu Y, Hsu A, Yokota H. Knee loading dynamically alters intramedullary pressure in mouse femora. Bone. 2007;40(2):538–543. doi: 10.1016/j.bone.2006.09.018. [DOI] [PMC free article] [PubMed] [Google Scholar]
- Zhang P, Su M, Tanaka SM, Yokota H. Knee loading stimulates cortical bone formation in murine femurs. BMC Musculoskelet Disord. 2006;7:73. doi: 10.1186/1471-2474-7-73. [DOI] [PMC free article] [PubMed] [Google Scholar]
- Zhang P, Tanaka SM, Sun Q, Turner CH, Yokota H. Frequency-dependent enhancement of bone formation in murine tibiae and femora with knee loading. J Bone Miner Metab. 2007;25(6):383–391. doi: 10.1007/s00774-007-0774-8. [DOI] [PMC free article] [PubMed] [Google Scholar]