Abstract
A new method of compensating for tissue-fraction and count-spillover effects, which requires tissue segmentation only within a small volume surrounding the primary lesion of interest, was evaluated for SPECT imaging. Tissue-activity concentration estimates are obtained by fitting the measured projection data to a statistical model of the segmented tissue projections. Multiple realizations of two simulated human-torso phantoms, each containing 20 spherical “tumours”, 1.6 cm in diameter, with tumour-to-background ratios of 8:1 and 4:1, were simulated. Estimates of tumour- and background-activity concentration values for homogeneous as well as inhomogeneous tissue activities were compared to standard SUV metrics on the basis of accuracy and precision. For perfectly registered, high-contrast, superficial lesions in a homogeneous background without scatter, the method yielded accurate (<0.4% bias) and precise (<6.1%) recovery of the simulated activity values, significantly outperforming the SUV metrics. Tissue inhomogeneities, greater tumour depth and lower contrast ratios degraded precision (up to 11.7%), but the estimates remained almost unbiased. The method was comparable in accuracy but more precise than a well-established matrix inversion approach, even when errors in tumor size and position were introduced to simulate moderate inaccuracies in segmentation and image registration. Photon scatter in the object did not significantly affect the accuracy or precision of the estimates.
Keywords: Maximum-likelihood estimation, partial-volume correction, partial-volume effect, count spillover, tissue crosstalk, resolution recovery, PET, SPECT, OSEM
1. Introduction
Emission tomography systems are, in principle, capable of providing quantitative measures of tracer concentrations in vivo, as long as appropriate image reconstruction methods are used in conjunction with accurate corrections for image-degrading physical effects (Zaidi and Erwin, 2007). While some corrections are routinely applied in the clinic, corrections for partial-volume and count-spillover effects remain particularly challenging to implement, despite the fact that these are generally well-understood phenomena (Rousset et al., 2007, Soret et al., 2007). The partial-volume effect, also called the “tissue-fraction effect” arises from the sampling of a continuous signal into a discrete voxel grid, in which the value of any given voxel could represent the mean counts from more than one tissue type. The count “spillover” phenomenon results from the limited spatial resolution of the imaging system which causes counts to be blurred from inside a structure of interest to outside (“spill-out”), or from outside to inside (“spill-in”). These effects have been shown to cause large biases (Keyes, 1995, Boellaard et al., 2004) in standard indices used to characterize uptake, such as the Standardized Uptake Value (SUV). As the use of quantitative emission tomography to, for example, monitor tumour response to therapy, is becoming more widespread in the clinic, correction for these effects is crucial, especially for quantifying activity within small structures in the presence of high surrounding background activity.
The use of iterative reconstruction algorithms such as Maximum Likelihood Expectation Maximization (MLEM) (Shepp and Vardi, 2007) and Ordered Subsets Expectation Maximization (OSEM) (Hudson and Larkin, 2002) which incorporate accurate models of all contributions to image blurring should, in principle, compensate for partial volume and spillover. Unfortunately, in clinical practice, it is usually not possible to run these algorithms for as many iterations as required to produce a substantial improvement. Furthermore, the noise amplification (Barrett et al., 1994) and edge-artefacts (Snyder et al., 2007) seen when using a large number of iterations can outweigh the improvement brought about by accurate modeling. Although some of these challenges can be significantly abated using advanced reconstruction methods, such as region-based MLEM (Carson, 1986), or methods that incorporate region-dependent penalty functions (Baete et al., 2004), most clinical systems are equipped only with standard MLEM and OSEM reconstruction algorithms. Clinicians typically run the reconstruction for only a few iterations, and considerable resolution blurring remains in the reconstructed image even when an accurate resolution model of the system is used.
Corrections for these resolution and sampling effects are theoretically possible if both the distribution of tissue components in the patient and the spatial resolution of the imaging system are known. Precalculated “recovery coefficients” (Hoffman et al., 1979) based on the known size, shape and locations of a set of standard objects (e.g., spheres) have been used to some extent in tumour imaging (Geworski et al., 2000, Hickeson et al., 2002, Avril et al., 1997). The advent of hybrid imaging systems like SPECT-CT scanners led to the use of registered anatomical images for accurate delineation of volumes-of-interest, with the assumption that the anatomical shape of the volume corresponds to its metabolically active area. This prompted the development of the Geometric Transfer Matrix (GTM) (Rousset et al., 1998) method for correction, which extended the recovery-coefficient concept to account for spillover among multiple structures. Region-based (Tohka and Reilhac, 2008, Kirov et al., 2008, Teo et al., 2007) and voxel-based (Boussion et al., 2006, Labbé et al., 1996, Meltzer et al., 1996, Meltzer and Frost, 1994, Muller-Gartner et al., 1992) corrections for sampling and resolution effects using anatomical images are an active area of research, making robust algorithms for co-registration (Hutton and Braun, 2003) of the images (in the case of sequential hybrid imaging systems) and segmentation of the tissue volumes (Zaidi et al., 2006) critical (Frouin et al., 2002, Quarantelli et al., 2004) for accurate quantitation.
For the work presented here, we have evaluated a new approach (Moore et al., 2012) to compensate for both partial-volume and spillover effects that can, potentially, be integrated into the image-analysis framework currently used in the clinic. The method requires the segmentation of tissues within a small volume approximately centered on a tumour or other lesion of primary interest. Activity estimates for each tissue within the small volume are obtained by fitting a model to ’raw’ projection data, for which the statistical noise is known and uncorrelated. We have previously evaluated this method (Moore et al., 2012) for a multiple-pinhole microSPECT system. For the current work, the technique was applied to a simulated clinical SPECT system, and validation results from a multiple-sphere phantom are presented. The performance of the volume-of-interest activity estimator (VOIest) was compared to that of the perturbation-based Geometric Transfer Matrix (pGTM) (Du et al., 2005a) estimator for objects in homogeneous tissue backgrounds, under a range of conditions that could be expected in typical SPECT studies (such as reasonable segmentation and image registration errors). VOIest was also evaluated for objects in inhomogeneous (“lumpy”) tissue backgrounds (Rolland and Barrett, 1992). The influence of photon scatter in the object on the precision and bias of VOIest estimates was also studied using realistic Monte-Carlo simulations.
2. Methods
2.1. Local, projection-based fitting approach
Theory
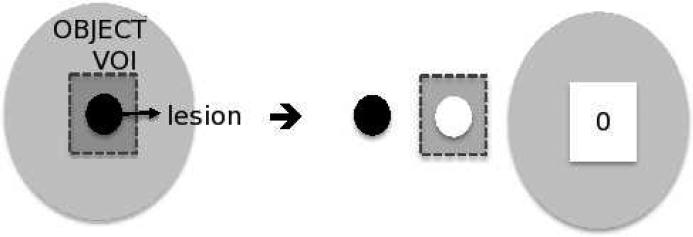
Consider J functionally distinct tissue compartments, including the lesion-of-interest, within a small volume-of-interest (VOI) delineated on the object as shown in Figure 1 for J = 2. The measured emission projection counts, λ, can be modeled as the sum of the projection counts from each of the J segmented tissue compartments (containing unit-activity concentration), scaled by their respective activity concentrations, plus the counts from the global background outside the VOI. This model is shown in Equation 1 where the label, i, runs over all projection bins. A is the vector of the unknown (true) activities of the J compartments. pj is the set of projected, resolution-blurred tissue shape functions. g(k)out represents the contributions to the projections from the background outside the VOI.
| (1) |
Assuming that (1) the activity within the J compartments is uniform, (2) a high-resolution, local segmentation of the compartments can be obtained using a registered anatomical image, (3) projections of the individual compartments can be separately computed from unit-activity tissue templates, incorporating all relevant physical effects, and (4) an accurate, low-noise projection through all of the activity outside of the VOI can be obtained from a reconstructed image of the object, then the true activity concentration values A can be determined by fitting the noisy measured projection data to the model in Equation 1 (Moore et al., 2012).
Figure 1.
Illustration of image model: The grey box outlines the volume-of-interest (VOI) on the object (made up of J=2 compartments), the lesion-of-interest and a soft tissue background. The two segmented compartments are forward projected to obtain pj=1 and pj=2, while g(k)out is obtained by forward projecting across the reconstructed image volume at iteration k, with all voxels within the VOI set to zero.
The joint likelihood of measuring a given projection data set, n, is given by the product of the Poisson probability density function (Equation 2) for each measured projection ray, i, over all rays traversing the volume-of-interest. Vector A is determined by maximizing the log likelihood (Equation 3) for the expected value λi.
| (2) |
| (3) |
Taking derivatives of ln(L) with respect to each of the J values of Aj and setting the results to zero, one can obtain the J equations shown in Equation 4, where j and j’ denote the segmented tissue compartments. We can then solve for the J unknown tissue-activity concentrations by inverting the matrix formed by the elements within the square parentheses in Equation 4, as shown in Equation 5.
| (4) |
| (5) |
Since the estimates (VOIest) are computed in projection space, it is straightforward to incorporate knowledge of the noise properties of the data into the fitting procedure. If the assumption of uniform activity uptake within the tumour and local background is reasonable, then the solution to this model by matrix inversion should simultaneously provide corrected estimates of the J activity concentration values within the VOI.
Implementation
The pij in Equation 5 is obtained by forward-projecting each of the J segmented tissue volumes within the VOI (from the registered, high-resolution anatomical image). The global background g(k)out is computed by forward projection across the reconstructed image volume, with the VOI zeroed, after the kth iteration of the reconstruction (Moore et al., 2012). The optimal value of k depends, in general, on the imaging task, and was determined for our phantom by iterating until the estimates of A changed by <0.05%. For a Poisson process, the λ(k)i are estimates of the noise variance along projection ray, i. For radioactive sources yielding relatively high numbers of counts per projection ray, this variance can be well approximated by the measured data, n, a technique used commonly in many least-squares fitting problems. Alternatively, the variance estimates at the kth iteration, λ(k)i, can be initialized to the value of the measured data, and updated in a separate iterative procedure using the most recent estimates of the activity concentration values, A, and the global background estimates, g(k)out. The iterative procedure to estimate λ(k)i is fast, achieving convergence within 2-3 iterations.
In clinical practice, where co-registered SPECT and CT images are routinely acquired, the implementation of this algorithm would involve the following steps:
Step1: Segment a small volume-of-interest (containing specific tissues-of-interest) from the registered CT image.
Step 2: Obtain “ideal” projections by projecting downsampled (to SPECT resolution), segmented volumes through an accurate forward model incorporating all physical effects.
Step 3: Mask VOI-area from reconstructed image at the selected iteration number, and re-project through the same forward model.
Step 4: Apply Equation 5 to estimate A.
2.2. Perturbation-based geometric transfer matrix approach
The GTM method (Rousset et al., 1998) is a correction approach that is known to provide estimates that are quantitatively more accurate than conventionally-used standard uptake values. It is based on fitting the reconstructed image data, rather than the projection data. The principles of the approach are summarized here, using the same notation used to derive the VOIest equations, and the reader is referred to the original publication for a detailed description. The GTM is a JxJ matrix Wjj’, whose elements correspond to the fraction of signal emanating from compartment j detected in j’. Thus, the diagonal elements of the GTM are the recovery coefficients for each structure, and the off-diagonal elements are the spillover coefficients. The measured values for each of the compartments are expressed as a linear combination of the unknown true values A and the GTM. Solving this system of J equations for J unknowns gives the corrected values for vector A. To obtain the elements of Wjj’, each segmented tissue mask, obtained from an anatomical image registered to the emission image, is projected and reconstructed individually, so as to obtain the fraction of counts emanating from that compartment which were detected in each of the other compartments.
The main feature that distinguishes VOIest from the GTM approach is that the former requires only local segmentation of a few tissues surrounding the tissue-of-interest. Furthermore, the GTM correction is performed in image space and does not account for the structure of the image noise. In any case, this would be complicated to model as the noise is correlated by the reconstruction algorithm. In order to compare the performance of these two approaches, we implemented the pGTM method developed by Du et al. (Du et al., 2005b). This was developed as an extension of the GTM approach to non-linear reconstruction algorithms such as ordered-subsets expectation maximization (OSEM) (Hudson and Larkin, 2002), for which the elements of the GTM depend on the non-linear and non-stationary reconstructed image resolution, which changes from iteration to iteration.
We compared the VOIest and pGTM approaches by computing corrected tumour-activity estimates for the numerical phantom, described in Section 2.3.
2.3. Numerical phantom
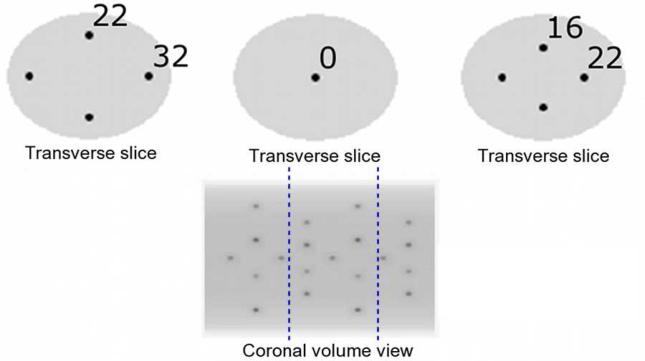
A torso-sized elliptical cylinder (27 cm minor, 35 cm major axis) was simulated with 20 spherical “tumours” filled with Technetium-99m (99mTc), each 1.6 cm in diameter, placed throughout the volume at 4 different radial distances as shown in Figure 2. The ideal spheres were modeled with 10 times higher spatial sampling, then down-sampled to the SPECT voxel size (4 mm), and placed in phantom locations which ensured a minimum separation of 5 sphere diameters between any two neighboring spheres. The simulated tumour-to-background contrast ratios were 8:1 and 4:1. Corresponding attenuation maps were generated similarly, assuming uniform water-equivalent attenuation at 140 keV throughout the phantom.
Figure 2.
Simulated torso-sized digital phantom. 20 hot spherical “tumours” were placed at least 5 sphere diameters apart at 5 radial distances from the central axis (0, 16, 22 (along the major axis), 22 (along the minor axis) and 32 voxels). The phantom used for the Monte-Carlo simulations described in Section 2.5 contained the 9 spheres between the blue dotted lines.
2.4. Analytic projector and reconstruction
Analytic forward- and back-projectors incorporating attenuation were used to simulate data from a parallel-hole SPECT system with a collimator hole length of 25 mm, hole size of 1.97 mm and septal thickness of 0.27 mm. Collimator parameters were selected to maximize sensitivity for a resolution value approximately equal to the tumour size at the center of the field-of-view (McQuaid et al., 2012). Distance-dependent collimator response was modeled for a non-circular orbit around the phantom. The width of the assumed Gaussian response at each source-collimator distance was given by the quadrature sum of the intrinsic detector resolution and the collimator resolution at that distance, where the collimator resolution included the approximation for single-septal penetration by utilizing a reduced, ‘effective’ collimator thickness (Keller, 1968, Beck and Gunter, 1985, Moore et al., 2005).
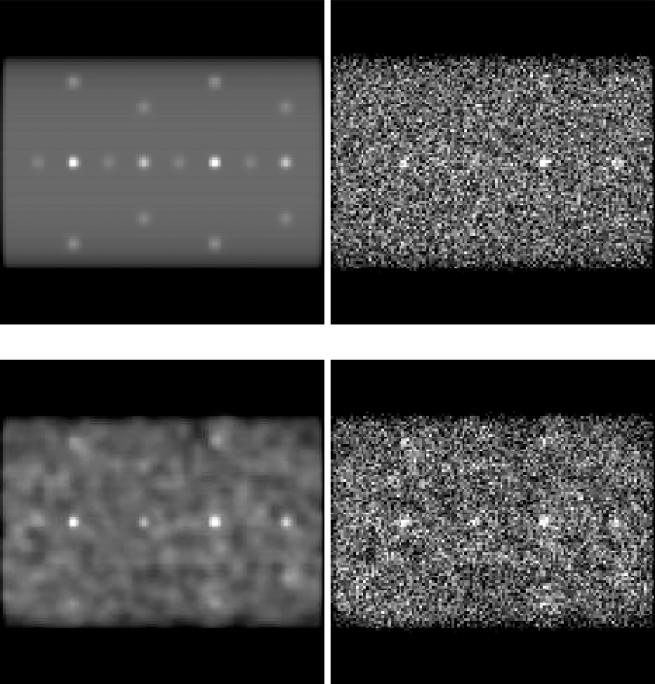
Both homogeneous and lumpy (Rolland and Barrett, 1992) backgrounds were simulated, using Gaussian-shaped lumps of 20 mm FWHM. Ten noise realizations, with an average of 30M counts each, were generated of a simulated acquisition of 120 blurred, attenuated projections. This is within the range of counts expected for patient studies using a collimator with the specifications modeled. Figure 3 shows the original projection, as well as projections with added Gaussian lumps and Poisson noise. Images were reconstructed using OSEM (Hudson and Larkin, 2002) with 10 subsets of 12 projections each, for up to 80 iterations. No post-reconstruction filtering was used. The effects of photon scatter were not modeled in these phantoms, but were included in the Monte-Carlo simulations described in the following sub-section.
Figure 3.
Projections of simulated torso phantom. Top, left: Original projection. Top, right: Projection with Poisson noise. Bottom, left: Projection with Gaussian lumps. Bottom, right: Projection with Poisson noise and Gaussian lumps
2.5. Monte-Carlo forward projector
In order to evaluate activity-estimation performance in the presence of photon scatter, a Monte-Carlo (MC)-based forward-projector (de Vries et al., 1990) was used to simulate data from the same parallel-hole SPECT system described above. To reduce simulation time, only the 9 spheres shown between the blue dotted lines in Figure 2 were simulated. These 9 spheres spanned the full range of radial distances in the original phantom. The MC simulator included all the details of photon transport (including Compton scatter and coherent scatter) in the object, collimator and detector. At each of 120 projection angles, essentially noise-free projections were obtained by using several standard variance reduction techniques to simulate 600-million 99mTc decays, with a starting decay photon energy of 140.5 keV. Projections were binned into two energy windows; the photopeak window (126-154 keV) and a lower-energy scatter window (92 - 126 keV) for scatter estimates. All projections were scaled by a constant factor in order to yield 30M total counts in the photopeak window with a 20% scatter fraction. This was equivalent to the number of counts simulated for the analytical projections. Ten noise realizations were generated by adding uncorrelated Poisson noise deviates to the scaled projections.
During OSEM reconstruction, scatter correction was performed by adding Triple Energy Window (TEW) scatter estimates (Ogawa et al., 1991) to the forward projections at each iteration. The TEW method was selected because of its widespread use in nuclear medicine clinics for scatter correction of SPECT studies. The scatter estimate was obtained by scaling the counts from the low-energy scatter window to the average number of simulated scattered counts within the photopeak window. Back-projection was performed using the same analytical projector used previously.
Scatter in the phantom and all camera components was also incorporated into the VOIest projection model, by using the MC program to forward project each of the J unit activity tissue volumes required to obtain pij, and to re-project the counts from outside the VOI (gout(k)). In order to simulate essentially noise-free projections for these cases, over 1000 decays were simulated per phantom voxel, using variance reduction techniques, and the resulting projections were scaled down to the correct values.
2.6. Evaluation
Metrics
Tumour activity concentration estimates obtained using the VOI approach were evaluated on the basis of bias and precision. Estimation bias was calculated as the relative difference of the mean estimated value and the simulated value (truth). For scatter-free simulated data, the mean estimated value was obtained over 10 noise realizations of 20 tumours, to obtain 200 statistically independent tumour activity estimates for each condition. Precision was calculated as the relative standard deviation over the same 200 tumours. When performance was analyzed separately for tumours at different radial distances from the central axis of the phantom, the mean and standard deviation were estimated over 10 noise realizations of 4 tumours (40 estimates) at each distance.
VOIest algorithm performance
The activity concentration values estimated using VOIest were evaluated against two conventional voxel-based estimators related to the SUV. SUVavg was calculated as the mean reconstructed voxel value over the entire tumour, and SUVpeak was the mean over 8 central voxels within each reconstructed tumour. The degree of improvement in tissue activity estimated using VOIest could vary based on several factors, such as the number of iterations, k, prior to reprojection of the global background, and the size, shape and activity of the object-of-interest due to object dependence of the reconstruction algorithm (Liow and Strother, 1993). In order to find suitable parameters for our phantom, convergence of the activity estimates at two simulated contrast levels was studied in homogeneous as well as lumpy backgrounds. Based on the results discussed in Section 3, for all subsequent studies, images were reconstructed for 10 iterations to obtain gout. Dependence of the estimates on the radial location of the tumour was also investigated by evaluating the algorithm's performance separately for different radial positions.
pGTM algorithm performance
The pGTM approach was used to estimate the activity concentration values of 4 tumours placed along the central axis of the phantom with 8:1 contrast. This is the most challenging location for tumour-activity estimation, because these sphere images are degraded the most by system spatial resolution, and they are also more highly attenuated in comparison to the other spheres. The size of the GTM for this problem was 5×5 for 5 unknown compartments, i.e. these 4 tumours plus the background compartment which consisted of the rest of the phantom. First, images were reconstructed with a 10% perturbation applied simultaneously to the 4 tumours. This allowed us to populate 4 diagonal elements of the GTM (i.e., those which contain the fractions of tumour counts that are reconstructed in the same tumours), as well as spill-out from the tumours to the background compartment. Since the tumours in the phantom were placed far enough apart that they could not contribute to the signal detected from the other tumours, the remaining off-diagonal elements involving the tumours were set to zero. Next, a 10% perturbation was applied to the background compartment, to obtain values for the final diagonal element (corresponding to the fraction of counts originating from and detected within the background compartment), and the spill-in from the background to each of the tumours. The product of the inverse of the GTM and the measured region values yielded the pGTM-corrected activity values for the 4 tumours and the background. Estimation bias and precision were calculated over 10 noise realizations and compared against VOIest as a function of iteration number. We compared the two approaches using a two-tailed Student t-test for paired samples. A two-tailed f-test was also performed to evaluate possible differences in precision.
Sensitivity to errors in segmentation (tumour-volume mismatch)
Anatomy-guided correction methods rely on segmentation algorithms to accurately delineate tumour volumes. To study the influence of segmentation errors on VOIest, we simulated four degrees of error ranging from −11% to +20% in tumour volume, encompassing a reasonable range of errors encountered in real studies (Zaidi et al., 2006). The performance of VOIest was evaluated by analyzing the bias and precision of the tumour estimates for the 8:1 contrast phantom as a function of the radial distance of the tumour from the central axis of the phantom. The sensitivity of pGTM to segmentation errors was also evaluated for the tumors located along the central axis of the phantom.
Sensitivity to errors in image registration (tumour-position mismatch)
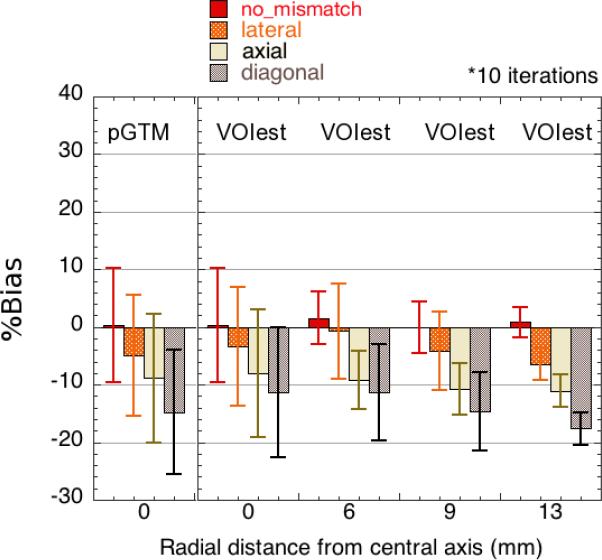
To evaluate the sensitivity of VOIest to possible spatial-registration errors between anatomic and functional imaging modalities, we introduced a shift error into our simulation. The anatomical image was translated by 4 mm (around 5 CT voxels) with respect to the SPECT image, to simulate a relatively large mismatch between the two image volumes. This translation was simulated in the lateral direction (x-shift), the axial direction (z-shift), and in both directions, corresponding to a diagonal translation. The bias and precision of the corrected tumour estimates for the 8:1 contrast phantom were evaluated as a function of the radial distance of the tumour from the central axis. The sensitivity of pGTM to registration errors was also evaluated for the tumors located along the central axis of the phantom.
Performance in the presence of photon scatter
Tumor-activity concentration estimates were obtained for MC-simulated “primary-only” projections as well as “primary + scatter” projections, reconstructed for 10 iterations. Estimates obtained using VOIest were compared to those obtained using SUVavg, as a function of the radial location of the tumor.
3. Results and Discussion
Overall algorithm performance
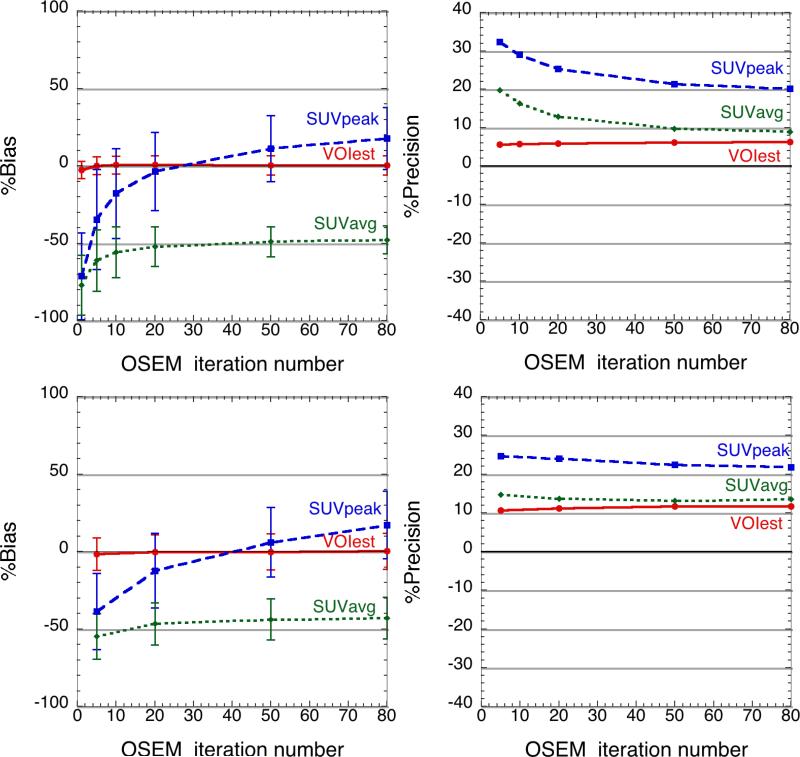
For perfectly registered spheres within a homogeneous, scatter-free background, VOIest approached a nearly unbiased value very quickly, after fewer than 10 OSEM iterations, and continued to converge toward the true value with increasing iterations. As shown in Figure 4, the VOIest method outperformed the conventional SUV estimators in terms of accuracy as well as precision. For a tumour-to-background contrast ratio of 8:1 (Figure 4, top), at 50 OSEM iterations when the SUVavg has plateaued, the bias in VOIest is 0.4%, compared to 11.0% for SUVpeak and −48.8% for SUVavg. The precision of VOIest at this point was 6.1%, compared to 21.3% and 9.7% for SUVpeak and SUVavg, respectively. The lower contrast ratio of 4:1 (Figure 4, bottom) degrades the precision (11.7% at 50 iterations) of VOIest, but the estimate converges, albeit more slowly, to the accurate value. The overall error in VOIest was dominated by precision (Figure 4, right), which arises mostly from the Poisson noise in the raw projection data.
Figure 4.
Comparison of tumour-activity concentration estimates using VOI est, SUVpeak and SUVavg. Estimation accuracy (left) and precision (right) are compared for all three estimators at tumour-to-background contrast ratios of 8:1 (top) and 4:1 (bottom) . Means and standard deviations (error bars) were computed over 200 statistically independent tumours.
Influence of background tissue inhomogeneity
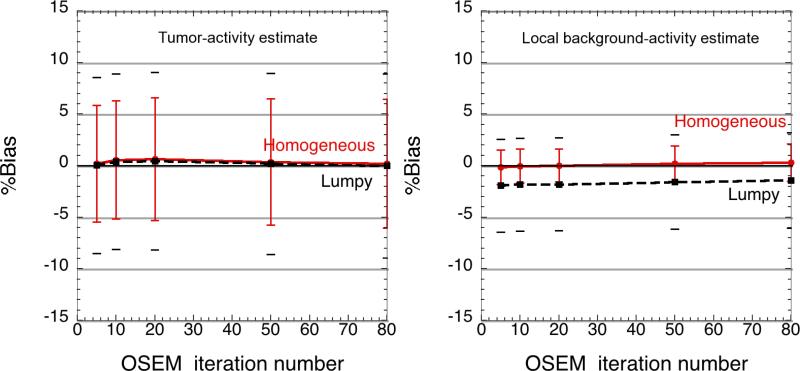
Simultaneous estimation of tumour and (average) background activity within lumpy backgrounds led to increased relative standard deviation of the estimates (8.5% at 10 iterations, compared to 5.7% in homogeneous backgrounds, (Figure 5), but VOIest outperformed the SUV metrics. Figure 5 (right) shows that the background activity estimate was also robust, although the incorrect assumption of homogeneous background activity concentration led to a mean underestimation of the background activity concentration by about 3%.
Figure 5.
Comparison of estimator performance in homogeneous and lumpy backgrounds: The tumour activity estimates (left) showed <1% bias in both cases, but the precision degraded slightly in lumpy backgrounds. The local background estimate (right) was negatively biased (<3%) when estimating the activity concentration in lumpy backgrounds, using the incorrect assumption of uniform background activity concentration. The inner (red) and outer (black) error bars denote the precision of the activity estimates in the homogeneous and lumpy backgrounds respectively.
Comparison of performance with pGTM
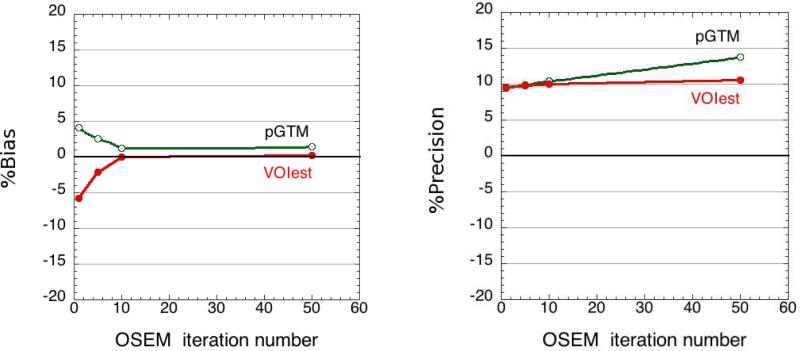
Both VOIest and pGTM yielded considerably more accurate and precise activity concentration estimates, compared to the SUV metrics, for the 4 tumours located along the central axis of the phantom. The two approaches are similar in that the measured data (in the case of VOIest) or reconstructed image (in the case of pGTM) are modeled as the sum of activities from the constituent tissues. Also, the underlying image reconstruction algorithm (MLEM or OSEM) used in both approaches is based on maximizing the likelihood of a Poisson process. Hence, as expected from Figure 6 (left), there was no significant difference (p>0.33) between the activity estimates obtained using the two approaches. At 10 iterations, there was no significant difference (p=0.7) in the precision, but at 50 iterations, a possible difference was observed (p<0.09). (The one-tailed f-test probability that the precision of pGTM estimates was worse than that of VOI at 50 iterations did achieve significance, with p<0.05). A possible explanation is that although the two approaches yielded equally accurate activity estimates, the pGTM approach solves a set of deterministic linear equations using perturbation-based estimates of the various spillover factors among the different regions. Neither the noise variance nor the spatial noise covariance within the defined regions of interest is directly used to weight the terms contributing to the solution. The VOIest approach, on the other hand, explicitly models the noise as an uncorrelated Poisson process in projection space, and the activity estimates are computed with appropriate noise-variance weighting of all terms (i.e., note λi appearing in the denominator of all terms in Equation 5). We believe that this difference in noise handling may explain why, in Figure 6 (right), the variance of pGTM activity estimates increased more rapidly with iteration number than did the variance of VOIest estimates.
Figure 6.
Comparison of VOIest and pGTM accuracy (left) and precision (right).
Dependence on tumour position
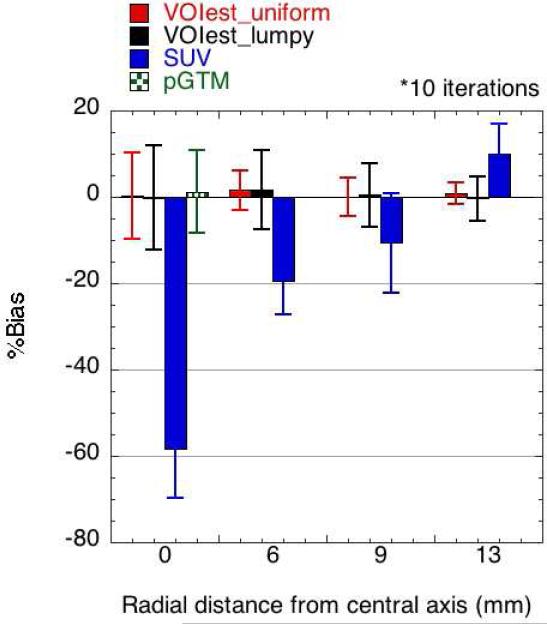
VOIest provided extremely accurate activity estimates for all tumour depths in the phantom after 10 iterations (Figure 7), especially compared to the SUV metric, which was highly biased, most notably for deeper tumours in the phantom, due to slower convergence at central locations. The precision of VOIest was worse for tumours located on the central axis because fewer counts were detected from those tumours due to attenuation. Figure 7 also shows the performance of the pGTM estimates, calculated for spheres along the central axis only, for comparison.
Figure 7.
Dependence of estimation performance on tumour position: The VOI estimator (k=10) achieved very low bias, essentially independent of the position of the tumour within the phantom. The SUV metric was strongly affected by the position-dependent rate of convergence of the OSEM reconstruction. The bias and precision of the pGTM estimates, which were only obtained for spheres along the central axis of the phantom, are also shown here for comparison. SUVavg is not shown, since the large bias (see Figure 4) would make visibility of the smaller bias values for the VOI and pGTM estimates difficult.
Sensitivity to errors in segmentation (tumour size)
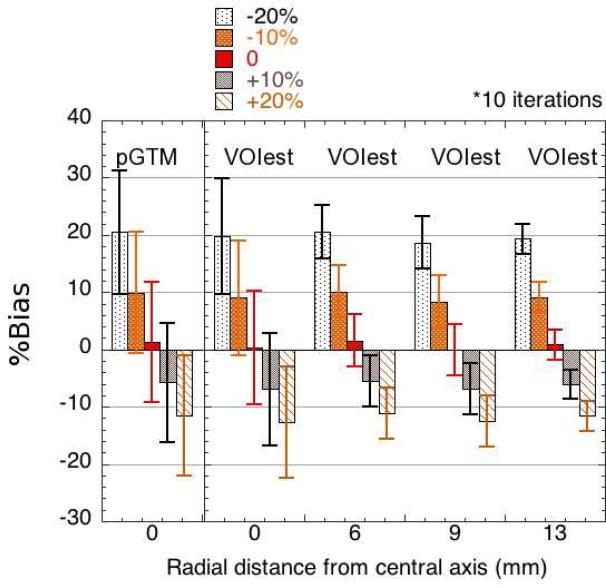
The sensitivity of the approach to realistic inaccuracies in segmentation is shown in Figure 8. VOIest and pGTM demonstrated comparable performance, in terms of accuracy as well as precision. The bias in the activity estimates was inversely proportional to the extent of the volume error, with a maximum bias of 20.6% associated with a 20% underestimation of tumour volume. In general, underestimation of tumour volume had a larger impact on the activity estimates than overestimation. The bias in the VOIest estimates was similar for all tumour locations. The precision of the estimates did not appear to be affected by segmentation errors.
Figure 8.
Sensitivity of VOI and pGTM to errors in assumed tumour volume, ranging from −20% to +20% (evaluated at k=10).
Sensitivity to errors in image registration (tumour location)
Figure 9 shows the robustness of the VOIest and pGTM approaches with respect to position-shift errors that could arise from inaccurate spatial registration between the locations of tumours segmented from the anatomical images and those from the SPECT images. For a 4-mm lateral shift, the average bias observed among spheres along the central axis of the phantom was −3.3% (VOIest) and −4.9% (pGTM). For an axial error of the same magnitude, the average bias was −7.9% (VOIest) and −8.9% (pGTM). This difference in the results for axial and lateral position mismatches could be explained by the fact that axial errors affect all projections, while lateral errors cannot be seen in projections perpendicular to the direction of the error. Diagonal errors were associated with a bias of −11.4% (VOIest) and −14.8% (pGTM).
Figure 9.
Sensitivity of VOIest and pGTM to spatial shift errors in lateral, axial and diagonal (combined axial and lateral) directions, which could arise from inaccurate spatial registration of the anatomical and SPECT image volumes (evaluated at k=10).
Performance in the presence of photon scatter
Table 1 compares the VOIest estimates for primary-only and primary + scatter data, for the MC simulations with photon scatter in the object. When scatter-correction was performed, we observed that the presence of scatter did not, on average, significantly affect the accuracy of the tumour-activity estimates obtained using VOIest. In the absence of scatter compensation, the estimates would have been biased positively by ~20%, on average, i.e., by the fraction of scattered events in our simulated data. Alternatively, one could subtract the TEW scatter estimates from the measured data and fit just the resulting primary component to the scatter-free model. This would reduce the bias, but it would also violate the assumption that the data are Poisson distributed, which could lead to degraded precision. Activity estimates for the tumor located at the axial and lateral center of the phantom had relatively poor precision, which possibly led to an apparent increase in bias. Tumors at that location would, in general, be the most affected by photon scatter in the object. Scatter compensation degraded the precision of the SUVavg estimates, while the precision of the VOIest estimates did not appear to be affected. Overall, VOIest significantly outperformed SUVavg for these data. The performance of pGTM in this case is expected to be similar to that of VOIest, based on results reported in (Du et al., 2005a), where the pGTM method was evaluated for SPECT data with reconstruction-based compensation for image degrading factors such as scatter.
Table 1.
%Bias and %Precision of VOIest for MC-simulated primary-only and primary + scatter projections (evaluated at k=10).
| Radial position (mm) | 0 | 6 | 9 | 13 | overall |
|---|---|---|---|---|---|
| (#tumours × #noise realizations) | 1 × 10 | 2 × 10 | 4 × 10 | 2 × 10 | 9 × 10 |
| VOIest %Bias (%Precision); primary only | 0.1 (13.2) | −1.9 (4.9) | −1.2 (5.9) | −1.4 (2.5) | −1.3 (6.3) |
| VOIest %Bias (%Precision); primary + scatter | −9.3 (9.2) | 3.2 (5.2) | 3.2 (5.1) | 0.1 (2.5) | 1.3 (6.5) |
| SUVavg %Bias (%Precision); primary only | −58.5 (14.4) | −36.1 (9.1) | −38.0 (10.1) | −45.6 (7.8) | −41.5 (15.3) |
| SUVavg %Bias (%Precision); primary + scatter | −65.3 (18.3) | −30.7 (10.1) | −36.6 (13.3) | −44.8 (10.5) | −40.3 (20.8) |
Known Limitations
The availability of an accurate segmentation algorithm is crucial to the success of VOIest in clinical practice. While the boundaries of some lesions, such as lung cancer or brain tumors, can be clearly delineated, certain soft-tissue tumors like pleural mesotheliomas invading adjacent organs (Armato et al., 2004, Yamamuro et al., 2007, Gerbaudo et al., 2011), or some head and neck malignancies (Schinagl et al., 2007) may not exhibit sufficient contrast to be clearly segmented. This is a known limitation of most recent partial volume compensation approaches (Soret et al., 2007), including pGTM, which rely on registered, high-resolution images. What differentiates our approach from the other approaches is the fact that only local segmentation is required for tissues within a small VOI. Thus, while segmentation of high resolution, low-contrast tumors will still be a challenge, clinicians can focus on a specific area of the image in an effort to improve segmentation of those lesions.
Future work
There are several factors, in addition to the limited ability to reliably discriminate among soft tissues in CT images, that could lead to segmentation and registration errors, such as statistical noise in the data, the type of patient imaging study being performed, the radiopharmaceutical being used, and several other patient-related factors such as tumor and background activity, nearby anatomic structures, etc. Other possible spatial errors include image magnification or scaling errors in all directions, as well as non-linear shift, rotational, and warping errors. A thorough evaluation of these issues is outside the scope of this paper, and will be carried out in future work.
Non-uniform tracer uptake, which generally cannot be detected by CT or MR imaging, was not studied in this work. The application of VOIest in such a situation would require either an accurate segmentation of functionally distinct tissues, or some other method of incorporating a priori knowledge of the inhomogeneities into the image model. Nevertheless, it seems likely that the method may still be fairly accurate in determining the average activity concentration over the tumour. Further work would be required to evaluate the performance of the estimators under conditions of nonuniform activity uptake within tumours.
4. Conclusions
A new method of correcting for both tissue-fraction and count spillover has been evaluated for SPECT imaging using a realistic simulated phantom to mimic human tumour imaging. The main advantage of the approach is that it requires tissue segmentation of a registered CT or MR image volume only within a small VOI surrounding a lesion of primary interest. In practice, this segmentation could be performed manually, automatically, or (more likely) semi-automatically, with guidance from a knowledgeable operator (e.g., a radiologist). Estimates of activity concentration in both tumour and local background tissues were obtained by fitting the measured data to a statistical image model in projection space, where the statistical noise properties of the data are spatially uncorrelated. Our results demonstrated an accurate and precise recovery of the simulated (true) values of tissue-activity concentration, showing that the VOIest method could successfully correct for the effects of partial volume and spillover effects, while significantly outperforming standard SUV-like metrics used in the clinic. Background-tissue inhomogeneity led to degraded precision, but absolute bias remained low. Photon scatter in the object did not significantly affect the accuracy or precision of the estimates, as long as the fitting procedure incorporated a model of the scatter. Although Monte Carlo simulations of the scatter contributions, especially in the case of the global background, can be prohibitively time-consuming, several variance reduction techniques (de Jong et al., 2001, Moore et al., 2006, Ouyang et al., 2008) can be used to accelerate the process. Approximate and rapid analytic scatter estimators can also be used, e.g., (Du et al., 2006). Alternatively, TEW scatter estimates can be subtracted prior to the fitting procedure, as discussed in Section 3. The performance of the algorithm was fairly independent of the location of the tumour. It was comparable in accuracy to, but somewhat more precise than, the pGTM-based approach, especially at higher iteration numbers, even in the presence of moderate inaccuracies in segmentation (underestimation of tumour size was more critical than overestimation) and registration (axial errors had larger impact than lateral errors).
Acknowledgments
This work was supported in part by NIH R01 grants EB000802 and EB001989.
References
- Armato S, Oxnard GR, MacMahon H, Starkey A, Vogelzang NJ, Kindler HL, Kocherginsky M. Measurement of mesothelioma on thoracic CT scans: A comparison of manual and computer-assisted techniques. Med. Phy. 2004;31(5):1105–16. doi: 10.1118/1.1688211. [DOI] [PubMed] [Google Scholar]
- Avril N, Bense S, Ziegler SI, Dose J, Weber W, Laubenbacher C, Romer W, Jonicke F, Schwaiger M. Breast imaging with fluorine-18-FDG PET: quantitative image analysis. J. Nucl. Med. 1997;38(8):1186. [PubMed] [Google Scholar]
- Baete K, Nuyts J, Laere KV, Paesschen WV, Ceyssens S, Ceuninck LD, Gheysens O, Kelles A, den Eynden JV, Suetens P, et al. Evaluation of anatomy based reconstruction for partial volume correction in brain FDG-PET. Neuroimage. 2004;23(1):305. doi: 10.1016/j.neuroimage.2004.04.041. [DOI] [PubMed] [Google Scholar]
- Barrett HH, Wilson DW, Tsui BM. Noise properties of the EM algorithm. i. theory. Phys. Med. Biol. 1994;39:833. doi: 10.1088/0031-9155/39/5/004. [DOI] [PubMed] [Google Scholar]
- Beck RN, Gunter DL. Collimator design using ray-tracing techniques. IEEE Trans. Nucl. Sci. 1985;32(1):865–9. [Google Scholar]
- Boellaard R, Krak NC, Hoekstra OS, Lammertsma AA. Effects of noise, image resolution, and ROI definition on the accuracy of standard uptake values: A simulation study. J. Nucl. Med. 2004;45(9):1519–1527. [PubMed] [Google Scholar]
- Boussion N, Hatt M, Lamare F, Bizais Y, Turzo A, Rest C, Visvikis D. A multiresolution image based approach for correction of partial volume effects in emission tomography. Phys. Med. Biol. 2006;51:1857. doi: 10.1088/0031-9155/51/7/016. [DOI] [PubMed] [Google Scholar]
- Carson RE. A maximum likelihood method for region-of-interest evaluation in emission tomography. J. Comput. Assist. Tomogr. 1986;10(4):654. doi: 10.1097/00004728-198607000-00021. [DOI] [PubMed] [Google Scholar]
- de Jong HW, Slijpen ET, Beekman FJ. Acceleration of monte carlo spect simulation using convolution-based forced detection. IEEE Trans. Nucl. Sci. 2001;48(1):58–64. [Google Scholar]
- de Vries DJ, Moore SC, Zimmerman RE, Mueller SP, Friedland B, Lanza RC. Development and validation of a monte carlo simulation of photon transport in an anger camera. IEEE Trans. Med. Imag. 1990;9(4):430–8. doi: 10.1109/42.61758. [DOI] [PubMed] [Google Scholar]
- Du Y, Tsui BM, Frey EC. Partial volume effect compensation for quantitative brain SPECT imaging. IEEE Trans. Med. Imag. 2005a;24(8):969. doi: 10.1109/TMI.2005.850547. [DOI] [PubMed] [Google Scholar]
- Du Y, Tsui BM, Frey EC. Model-based compensation for quantitative 123I brain SPECT imaging. Phys. Med. Biol. 2006;51:1269–82. doi: 10.1088/0031-9155/51/5/016. [DOI] [PubMed] [Google Scholar]
- Du Y, Tsui BMW, Frey EC. Partial volume effect compensation for quantitative brain spect imaging. IEEE Trans. Med. Imag. 2005b;24(8):969. doi: 10.1109/TMI.2005.850547. [DOI] [PubMed] [Google Scholar]
- Frouin V, Comtat C, Reilhac A, Gregoire MC. Correction of partial-volume effect for PET striatal imaging: fast implementation and study of robustness. J. Nucl. Med. 2002;43(12):1715. [PubMed] [Google Scholar]
- Gerbaudo V, Mamede M, Trotman-Dickenson B, Hatabu H, Sugarbaker D. Fdg pet/ct patterns of treatment failure of malignant pleural mesothelioma: relationship to histologic type, treatment algorithm, and survival. European Journal of Nuclear Medicine and Molecular Imaging. 2011;38:810–821. doi: 10.1007/s00259-010-1704-x. 10.1007/s00259-010-1704-x. [DOI] [PubMed] [Google Scholar]
- Geworski L, Knoop BO, de Cabrejas ML, Knapp WH, Munz DL. Recovery correction for quantitation in emission tomography: a feasibility study. European J. Nucl. Med. and Molecular Imaging. 2000;27(2):161. doi: 10.1007/s002590050022. [DOI] [PubMed] [Google Scholar]
- Hickeson M, Yun M, Matthies A, Zhuang H, Adam LE, Lacorte L, Alavi A. Use of a corrected standardized uptake value based on the lesion size on CT permits accurate characterization of lung nodules on FDG-PET. European J. Nucl. Med. and Molecular Imaging. 2002;29(12):1639. doi: 10.1007/s00259-002-0924-0. [DOI] [PubMed] [Google Scholar]
- Hoffman EJ, Huang SC, Phelps ME. Quantitation in positron emission computed tomography: 1. effect of object size. J. Comput. Assist. Tomogr. 1979;3(3):299. doi: 10.1097/00004728-197906000-00001. [DOI] [PubMed] [Google Scholar]
- Hudson HM, Larkin RS. Accelerated image reconstruction using ordered subsets of projection data. IEEE Trans. Med. Imag. 2002;13(4):601. doi: 10.1109/42.363108. [DOI] [PubMed] [Google Scholar]
- Hutton BF, Braun M. Software for image registration: Algorithms, accuracy, efficacy,. Seminars in Nuclear Medicine. 2003;33(3):180. doi: 10.1053/snuc.2003.127309. [DOI] [PubMed] [Google Scholar]
- Keller EL. Optimum dimensions for parallel-hole, multi-aperture collimators for gamma-ray cameras. J. Nucl. Med. 1968;9(6):233–5. [PubMed] [Google Scholar]
- Keyes JW., Jr SUV: standard uptake or silly useless value? J. Nucl. Med. 1995;36(10):1836. [PubMed] [Google Scholar]
- Kirov AS, Piao JZ, Schmidtlein CR. Partial volume effect correction in PET using regularized iterative deconvolution with variance control based on local topology. Phys. Med. Biol. 2008;53:2577. doi: 10.1088/0031-9155/53/10/009. [DOI] [PubMed] [Google Scholar]
- Labbé C, Froment JC, Kennedy A, Ashburner J, Cinotti L. Positron emission tomography metabolic data corrected for cortical atrophy using magnetic resonance imaging. Alzheimer Dis. Assoc. Disord. 1996;10(3):141. doi: 10.1097/00002093-199601030-00005. [DOI] [PubMed] [Google Scholar]
- Liow JS, Strother SC. The convergence of object dependent resolution in maximum likelihood based tomographic image reconstruction. Phys. Med. Biol. 1993;38:55. doi: 10.1088/0031-9155/38/1/005. [DOI] [PubMed] [Google Scholar]
- McQuaid S, Southekal S, Kijewski MF, Moore SC. Optimization of a parallel hole collimator for a SPECT lesion quantification task. Phys. Med. Biol. 2012 doi: 10.1088/0031-9155/56/21/014. In press. [DOI] [PMC free article] [PubMed] [Google Scholar]
- Meltzer CC, Frost JJ. Functional neuroimaging: technical foundations. Academic Press; San Diego: 1994. Partial volume correction in emission-computed tomography: focus on alzheimer disease. p. 163. [Google Scholar]
- Meltzer CC, Zubieta JK, Links JM, Brakeman P, Stumpf MJ, Frost JJ. MR-based correction of brain PET measurements for heterogeneous gray matter radioactivity distribution. J. Cereb. Blood Flow Metab. 1996;16(4):650. doi: 10.1097/00004647-199607000-00016. [DOI] [PubMed] [Google Scholar]
- Moore SC, Kijewski MF, Fakhri GE. Collimator optimization for detection and quantitation tasks: application to gallium-67 imaging. IEEE Trans. Med. Imag. 2005;24(10):1347–56. doi: 10.1109/TMI.2005.857211. [DOI] [PubMed] [Google Scholar]
- Moore SC, Ouyang J, Park M, Fakhri GE. Monte carlo-based compensation for patient scatter, detector scatter, and crosstalk contamination in in-111 spect imaging. Nucl. Instrum. and Meth. Phys. A. 2006;569:472–6. [Google Scholar]
- Moore SC, Southekal S, McQuaid SJ, Kijewski MF, Muller SP. Improved regional activity quantitation in nuclear medicine using a new approach to correct for tissue partial volume and crosstalk effects. IEEE Trans. Med. Imag. 2012 doi: 10.1109/TMI.2011.2169981. In press. [DOI] [PMC free article] [PubMed] [Google Scholar]
- Muller-Gartner HW, Links JM, Prince JL, Bryan RN, McVeigh E, Leal JP, Davatzikos C, Frost JJ. Measurement of radiotracer concentration in brain gray matter using positron emission tomography: MRI-based correction for partial volume effects. J. Cereb. Blood. Flow Metab. 1992;12(4):571. doi: 10.1038/jcbfm.1992.81. [DOI] [PubMed] [Google Scholar]
- Ogawa K, Harata Y, Ichihara T, Kubo A, Hashimoto S. A practical method for position-dependent compton-scatter correction in single photon emission ct. IEEE Trans. Med. Imag. 1991;10(3):408–12. doi: 10.1109/42.97591. [DOI] [PubMed] [Google Scholar]
- Ouyang J, Fakhri GE, Moore SC. Improved activity estimation with MC-JOSEM versus TEW-JOSEM in 111In SPECT. Med. Phys. 2008;35:2029–40. doi: 10.1118/1.2907561. [DOI] [PMC free article] [PubMed] [Google Scholar]
- Quarantelli M, Berkouk K, Prinster A, Landeau B, Svarer C, Balkay L, Alfano B, Brunetti A, Baron J, Salvatore M. Integrated software for the analysis of brain PET/SPECT studies with Partial-Volume-Effect correction. J. Nucl. Med. 2004;45(2):192. [PubMed] [Google Scholar]
- Rolland JP, Barrett HH. Effect of random background inhomogeneity on observer detection performance. JOSA A. 1992;9(5):649. doi: 10.1364/josaa.9.000649. [DOI] [PubMed] [Google Scholar]
- Rousset O, Rahmim A, Alavi A, Zaidi H. Partial volume correction strategies in PET. PET Clinics. 2007;2(2):235. doi: 10.1016/j.cpet.2007.10.005. [DOI] [PubMed] [Google Scholar]
- Rousset OG, Ma Y, Evans AC. Correction for partial volume effects in PET: principle and validation. J. Nucl. Med. 1998;39(5):904. [PubMed] [Google Scholar]
- Schinagl DA, Vogel WV, Hoffmann AL, van Dalen JA, Oyen WJ, Kaanders JH. Comparison of five segmentation tools for 18f-fluoro-deoxy-glucose-positron emission tomography-based target volume definition in head and neck cancer. International Journal of Radiation Oncology*Biology*Physics. 2007;69(4):1282–1289. doi: 10.1016/j.ijrobp.2007.07.2333. [DOI] [PubMed] [Google Scholar]
- Shepp LA, Vardi Y. Maximum likelihood reconstruction for emission tomography. IEEE Trans. Med. Imag. 2007;1(2):113. doi: 10.1109/TMI.1982.4307558. [DOI] [PubMed] [Google Scholar]
- Snyder DL, Miller MI, Thomas LJ, Politte DG. Noise and edge artifacts in maximum-likelihood reconstructions for emission tomography. IEEE Trans. Med. Imag. 2007;6(3):228. doi: 10.1109/TMI.1987.4307831. [DOI] [PubMed] [Google Scholar]
- Soret M, Bacharach SL, Buvat I. Partial-volume effect in PET tumor imaging. J. Nucl. Med. 2007;48(6):932. doi: 10.2967/jnumed.106.035774. [DOI] [PubMed] [Google Scholar]
- Teo BK, Seo Y, Bacharach SL, Carrasquillo JA, Libutti SK, Shukla H, Hasegawa BH, Hawkins RA, Franc BL. Partial-volume correction in PET: validation of an iterative postreconstruction method with phantom and patient data. J. Nucl. Med. 2007;48(5):802. doi: 10.2967/jnumed.106.035576. [DOI] [PubMed] [Google Scholar]
- Tohka J, Reilhac A. Deconvolution-based partial volume correction in Raclopride-PET and monte carlo comparison to MR-based method. Neuroimage. 2008;39(4):1570. doi: 10.1016/j.neuroimage.2007.10.038. [DOI] [PubMed] [Google Scholar]
- Yamamuro M, Gerbaudo VH, Gill RR, Jacobson FL, Sugarbaker DJ, Hatabu H. Morphologic and functional imaging of malignant pleural mesothelioma. European Journal of Radiology. 2007;64(3):356–366. doi: 10.1016/j.ejrad.2007.08.010. <ce:title>Pulmonary Functional Imaging</ce:title>
- Zaidi H, Erwin WD. Quantitative analysis in nuclear medicine imaging. J. Nuc. Med. 2007;48(8):1401. [Google Scholar]
- Zaidi H, Ruest T, Schoenahl F, Montandon ML. Comparative assessment of statistical brain MR image segmentation algorithms and their impact on partial volume correction in PET. Neuroimage. 2006;32(4):1591. doi: 10.1016/j.neuroimage.2006.05.031. [DOI] [PubMed] [Google Scholar]


