

Abstract
Magnetic resonance (MR) examinations of men with prostate cancer are most commonly performed for detecting, characterizing, and staging the extent of disease to best determine diagnostic or treatment strategies, which range from biopsy guidance to active surveillance to radical prostatectomy. Given both the exam's importance to individual treatment plans and the time constraints present for its operation at most institutions, it is essential to perform the study effectively and efficiently. This article reviews the most commonly employed modern techniques for prostate cancer MR examinations, exploring the relevant signal characteristics from the different methods discussed and relating them to intrinsic prostate tissue properties. Also, a review of recent articles using these methods to enhance clinical interpretation and assess clinical performance is provided.
Keywords: prostate cancer, multiparametric MRI, T2-weighted imaging, diffusion-weighted imaging, dynamic contrast-enhanced imaging, magnetic resonance spectroscopy
Introduction
Imaging of the prostate gland and associated diseases is traditionally performed by ultrasound, initially with trans-abdominal transducers later superseded by transrectal (TRUS) transducers. TRUS is the most common prostate imaging modality, and in the U.S. its primary role is to provide image guidance for biopsies and brachytherapy. As such, it provides excellent images of the gland, its boundaries, and the adjacent bladder, seminal vesicles, and anterior rectal wall. It does not, however, provide consistent or reliable information about prostate tissue or benign or malignant neoplasms and has a relatively minor role in the detection or staging of prostate cancer. Computed Tomography (CT) is a robust and commonly utilized modality for general pelvic imaging, but it too offers little prostate cancer-specific imaging information and has a limited role in staging, almost exclusively for assessing for potential metastases in the lymph nodes, soft tissues (liver, lung, etc.), or bones of men with high-risk prostate cancer. Recent work from Prasad et al. indicates that both CT and nuclear medicine bone scans are over-utilized in men with low-risk prostate cancer in the U.S. Medicare population (1).
Imaging of the prostate with magnetic resonance was first described in the mid-1980s with early publications describing the sub-structure visualization and characterization using T2-weighted imaging (T2WI) (2,3). Even with the low spatial resolution attained with the medium-field magnets and body coil technology employed at the time, it was immediately evident that MR could provide a unique and novel approach to imaging diseases of the prostate. The endorectal coil, also introduced in the mid-to-late 1980s (4,5), added significantly to the quality of prostate MRI by enhancing visualization of sub-glandular structures. Early reports illustrated moderate accuracies for the visualization of the neurovascular bundles (NVBs) and their invasion by prostate cancer (6). The advent of rapid T2WI with fast-spin echo (FSE) techniques in the early 1990s (7) provided the basic tools required for prostate cancer MRI staging examinations – fast T2WI with an endorectal coil (8). However, over time the goals of clinical imaging have changed, and the entire imaging community is shifting its emphasis towards combining anatomical/structural imaging with functional and molecular imaging tools.
In the context of prostate cancer, the last decade has seen a major increase in interest in the detection and characterization of focal prostate cancer (9) with exciting developments in diffusion-weighted imaging (DWI) and magnetic resonance spectroscopic imaging (MRSI), which show promise in allowing for better assessment of prostate cancer aggressiveness through correlation with low, intermediate, and high Gleason scores (10,11). Dynamic contrast-enhanced (DCE) imaging also holds much promise for better characterizing prostate cancer. In addition, there are ongoing efforts to combine MR methods in multiparametric formats to improve the performance characteristics of the detection and localization of prostate cancer. This can, in turn, provide targeted lesions for either biopsy or minimally-invasive surgical procedures. Other recent reviews of prostate MRI (12-14), including a recent meta-analysis of its clinical utility (15), are available.
In this review, we provide an update of the technical components currently employed for state-of-the-art prostate MR examinations, providing descriptions of how the imaging information obtained relates to prostate histopathology. We also review recent studies which expand clinical interpretation and assess clinical performance in multiparametric MRI.
Modern MRI Technical Specifications
MRI Scanner and Receiver Coils
Both 1.5- and 3-Tesla scanners are currently employed for prostate cancer diagnostic scans, with the latter becoming increasingly more available and generally preferred due to a higher signal-to-noise ratio (SNR), yielding advantages by offering better structural and functional detail (16). Current receiver coil technology includes pelvic phased-array coils with or without the addition of an endorectal coil. The endorectal coil adds approximately an order of magnitude to the available SNR (8,17,18) and also allows for the use of small fields-of-view (FOV) for some critical applications like DWI. Thus, the endorectal coil is highly preferred, even though it adds discomfort, time, and cost to the MR exam. Though rigid endorectal coils affixed to the gantry tables have been proposed and tested (19), the endorectal coils most typically used clinically are inflatable. They are equipped with a balloon filled with approximately 50 ml of air to fix the coil to the prostate and help minimize motion artifact. Some advocate filling the balloon with a perfluorocarbon fluid (20,21) or barium sulfate mixtures (22) commonly used for CT contrast exams to better match susceptibilities between the balloon and adjacent tissue. The matched susceptibility can reduce the spatial distortions associated with echo planar imaging (EPI) sequences used for DWI and also help minimize spectral linewidths and improve water suppression in MRSI. However, these enhanced balloon inflation techniques are challenging to execute in clinical practice and are not employed widely.
Some groups have recently found that utilizing 3T field strength provides sufficient image quality for significant discrimination between healthy tissue and cancer without an endorectal coil (23-29). However, the addition of an endorectal coil at 3T has also shown to significantly increase performance as compared to using only external body coils in several sequence parameters (18,30). The debate over whether higher field strength can eliminate the need for an endorectal coil is ongoing, to be answered in future 3T studies evaluating the performance of all sequence parameters, separately and in combination, with and without an endorectal coil.
A number of different pulse sequences are currently used for diagnostic prostate cancer MR exams. Table 1 specifies the exact parameters we currently use for localizer, T1-weighted imaging (T1WI), T2WI, DWI, and DCE imaging. Others may use slightly different parameters, so ranges for these parameters should be considered according to preference. A consensus discussion by a European committee (31), complete with recommendations for acquiring, interpreting, and reporting prostate MR examinations, provides good detail into the range of sequences and sequence parameters commonly employed.
Table 1.
Details of our prostate cancer staging MR examination as implemented on a 3 T scanner (General Electric Medical Systems, Milwaukee, WI). Some vendors use different pulse sequence names or report receiver bandwidths (BW) in Hz/pixel. All sequences listed utilize a body array coil along with an endorectal coil, except for the DWI modality, which employs only the endorectal coil. The T2-weighted sequence uses an echo train length of 19. The DWI sequence employs b values of 500 and 1400 s/mm2.
| 3 Plane Localizer | Parallel Imaging Calibration | T2 (3-plane) | Axial T1 Pre-Contrast | Axial DWI | Axial 3D DCE | Axial T1 Post-Contrast | Axial T1(Nodal Survey) | |
|---|---|---|---|---|---|---|---|---|
| Pulse Sequence | SSFSE | Gradient Echo | FRFSE-XL/NPW/Tailored RF | SPGR/NPW/EDR | SE-DW-EPI | SPGR/Asset/multi-phase | SPGR/NPW/EDR | SPGR/EDR |
| TR (ms) | 1673 | 3500 | 385 | 2500 | 3.6 | 385 | 225 | |
| TE (ms) | 80 | 102 | 6.2 | 65.7 | 1.3 | 6.2 | 3.3 | |
| Flip Angle (°) | 90 | 65 | 15 | 65 | 75 | |||
| BW (Khz) | ±83.3 | ±31.25 | ±31.25 | ±250 | ±62.5 | ±31.25 | ±31.25 | |
| FOV (cm) | 40 | 48 | 16 | 16 | 18*10.8 | 26 | 16 | 35-40 |
| Slice Thickness (mm) | 8 | 15 | 3 | 3 | 3 | 5 | 3 | 5 |
| Spacing (mm) | 0 | 0 | 0 | 0 | 0 | 1 | ||
| Frequency Direction | Unswap | Co – S/I Ax/Sg – A/P | A/P | R/L | A/P | A/P | A/P | |
| Matrix | 384 × 192 | 384 × 224 | 384 × 192 | 128 × 96 | 256 × 160 × 20 | 384 × 192 | 256 × 160 | |
| NEX | - | 2 | 1 | 12 | 0.5 | 1 | 0.5 |
Abbreviations: SSFSE= single shot fast spin echo; FRFSE-XL= fast recovery fast spin echo accelerated; RF = radio frequency; SPGR= spoiled gradient echo; SE-DW-EPI= spin-echo diffusion-weighted echo-planar-imaging; NPW = no phase-wrap; EDR = extended dynamic range; TR= repetition time; TE= echo time; BW=bandwidths; FOV=field of view; ETL = echo train length; NEX = number of excitations; Co = coronal; Ax/Sg = axial/sagittal; A/P = anterior/posterior; R/L = right/left.
Localizer Imaging
A localizer using three orthogonal planes should be used to obtain rapid, distortion-free images for a) ascertaining that the endorectal coil is in the correct position and b) proscribing slices and volumes for the diagnostic scans. Figure 1 shows proper and improper placement of the endorectal coil from a sagittal localizer acquired over a large FOV with a three-plane localizer utilizing a single-shot fast-spin echo (SSFSE) sequence. When in the proper position (Fig. 1b), the coil is flush with the prostate, resulting in the entire prostate gland appearing with high signal intensity. Of note, various methods have been proposed to correct for signal inhomogeneity in the prostate when imaged using an endorectal coil. Such methods typically either rely on modified acquisition protocols (32,33) or employ mathematical techniques to estimate the inhomogeneity of the field retrospectively (34,35).
Figure 1. MRI Localizer Imaging for Assessment of Endorectal Coil Placement.
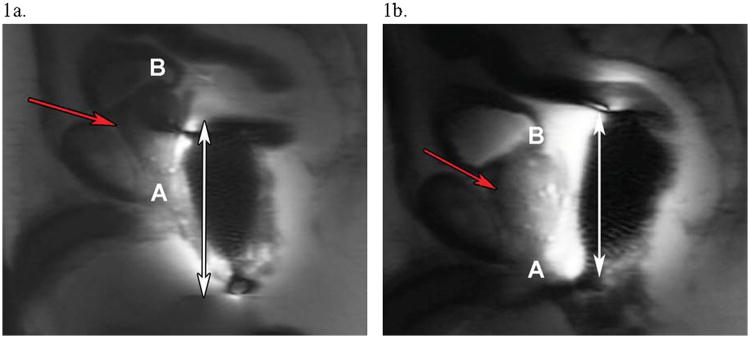
Sagittal localizing single-shot fast-spin echo (SSFSE) images to verify positioning of the endorectal coil prior to initiating diagnostic scanning. The top of the base (B) and the bottom of the apex (A) of the prostate are annotated for clarity. (a) Initially, the endorectal coil is low-lying, with its superior border lying posterior to the middle of the prostate gland (red arrow). The double-headed arrow highlights the area of signal hyperintensity, which only covers about two-thirds of the prostate in (a). (b) After repositioning of the coil, accurate coil placement is seen, as the entire prostate (red arrow) now shows a hyperintense signal, with the double-headed arrow now including the span of the entire prostate gland.
T1-Weighted Imaging
Classic spin-echo sequences, few (3 to 6) echo fast-spin echo (FSE) sequences, or 2D gradient echo sequences with large (> 50°) flip angles and TR periods (> 300 ms), are all acceptable for T1WI, the last being our current approach (Table 1). T1WI contrast in the healthy or diseased gland is generally quite small, with little subglandular structure observed. However, T1WI provides good contrast for observing blood products occurring as a consequence of biopsy sampling. The determination of the presence and location of hemorrhage is the principal reason for acquiring T1W images. Regions of hemorrhage appear as hyperintense regions on T1WI due to the shortening of T1 caused by the paramagnetic, iron-rich, blood by-products (36). Thus, when hypointensities appear on T2W images which are suggestive of cancer (see below), the T1W images must be consulted to definitively rule out hemorrhage in these locations, as these areas of hemorrhage will also appear as hypointensities on T2W images. As MR is used as a staging exam at many institutions, hemorrhagic lesions from biopsies performed even several months prior to the MR exam are common. Figure 2a depicts bright lesions (stars) within the gray, isointense background of typical T1WI of the gland that should not be mistaken for cancerous areas after increasing suspicion on T2WI (Fig. 2b).
Figure 2. Prostate Hemorrhage following Biopsy Complicates Cancer Detection on T2-Weighted Imaging.
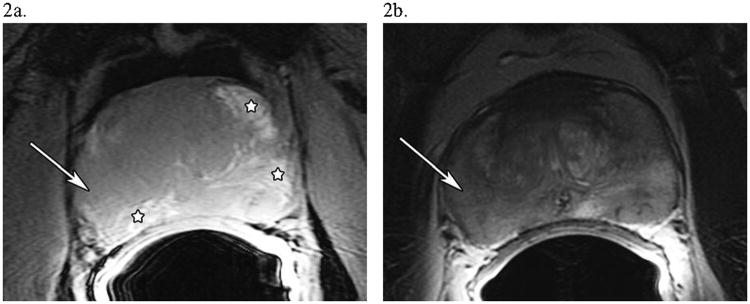
A 52 year-old man with PSA 5.8, Gleason 5+4=9, T2cN0M0 prostate cancer. (a) An axial T1-weighted image of the prostate showing possible areas of hemorrhage, which have a hyperintense signal (major hemorrhagic regions are starred). (b) An axial T2-weighted image of the prostate at the same level showing diffuse T2 signal hypointensity in the peripheral zone, indicating either tumor or hemorrhage. The white arrow in both (a) and (b) in the lateral region of the right side of the prostate shows an area suspicious for tumor, as there is T2-weighted signal hypointensity without T1-weighted signal hyperintensity.
T2-Weighted Imaging
Fast-spin echo T2WI provides high SNR and high spatial resolution images with significant T2 contrast that allows for the depiction of subglandular structures, including the peripheral zone (PZ), central gland (CG), and any suspicious lesions. The imaging is performed using anywhere from 12 to 24 echoes with echo spacings around 8 to 12 ms. Typical repetition times range from 2 to 4 s and effective echo times between 70 to 120 ms are employed. Small FOVs of 12 to 16 cm, with in-plane matrices of 384 × 224 (frequency × phase) and slice thicknesses around 3 mm with no gap, provide multi-slice whole-gland coverage with < 3 μl voxel volumes (Table 1). We perform such acquisitions in the axial, coronal, and sagittal planes, all for assessing extraglandular disease. The sagittal plane is the most useful for evaluating seminal vesicle invasion (SVI).
PZ tumors may appear as well-defined, hypointense foci or more subtle, slightly hypointense regions in T2W images. Once a focal lesion is detected, an evaluation of the overall stage of the tumor is required. The most important overall assessment is whether the tumor is confined to the gland (T-category ≤ T2) or extends beyond the gland (≥ T3). The high spatial resolution and sharp demarcation of the prostate capsule allows for assessments of extracapsular extension (ECE) and NVB invasion (NVBI) which, along with assessments of SVI, are critical diagnostic staging criteria. Figures 3a – g highlight all of these features, demonstrating a capsule-contained diffuse lesion (3a), SVI seen clearly on axial (3b) and sagittal (3c) acquisitions, ECE with likely SVI (3d), ECE with NVBI (3e), pelvic lymphadenopathy (3f), and a metastatic bone lesion (3g).
Figure 3. T2-Weighted Images of Critical Findings in Prostate Cancer.

(a) In a 61 year-old man with PSA 3.7, Gleason 3+3 =6, T2cN0M0 disease, an axial view of the prostate presenting a diffuse, capsule-contained peripheral zone (PZ) lesion with a “chalky” appearance. Notice how the PZ, usually hyperintense and clearly demarcated from the central gland (CG) which it surrounds, is now heterogeneous. (b, c) A different, 56 year-old man with PSA 9.3, Gleason 3+4=7, T3bN0M0 disease shows right-sided seminal vesicle invasion (white arrows) by tumor in axial (b) and sagittal (c) images. In the axial image (b), compare the hypointense, diseased right SV (white arrow) to the normal, hyperintense SV on the left (arrowhead). (d) In a 60 year-old man with PSA 134, Gleason 3+4=7, T4N0M0 disease, an axial image of the base of the prostate showing right-sided extracapsular extension (arrow) at 7 o'clock with probable involvement of the right SV (arrowheads). (e) In a 65 year-old man with PSA 40.1, Gleason 5+4=9, T4N1M1a disease, an axial view of the prostate displaying a large posterolateral right peripheral zone lesion (arrow) at 7 o'clock which invades the right neurovascular bundle. This lesion starkly contrasts with the normal NVB on the left (arrowhead). (f) From the same patient as (e), significant pelvic lymphadenopathy is present in an axial view at the level of the seminal vesicles, including this 1.5 × 1.3-cm, right posterior obturator node (arrow). (g) In a 75 year-old man with PSA 11.4, Gleason 4+4 = 8, T3aN0M1b prostate cancer, an axial view of the spine at L5 demonstrating a 1.5 × 1.1-cm metastatic bone lesion.
Diffusion-Weighted Imaging
The most common approach to DWI of the prostate, and other organs as well, is the single-shot spin-echo EPI sequence (37). This sequence employs a water-selective excitation and refocusing pulse to generate a spin echo from a selected slice at echo times on the order of 60 to 100 ms, depending on the degree of diffusion weighting desired, known as the b-factor. Diffusion sensitization gradients are applied before and after the refocusing pulse and the latter half of the spin-echo is sampled with distinctly phase-encoded multiple-gradient echoes to generate a low spatial resolution image in 40- to 60-ms acquisition durations. With DWI, each slice must be sampled with a baseline b0 image (when the b-factor = 0) and then sampled at one or several higher b-factors, typically in the 500 to 1400 s/mm2 range. Lower b-value scans show a combination of DWI and T2WI information, while higher b-value scans tend to show DWI effects alone (38). For each high b-factor sampled, it is recommended to acquire at least three images with the diffusion sensitization gradients oriented along three orthogonal directions so that a rotationally invariant trace image may be generated by taking the cubed root of the product of the three images. Combining high b-factor trace images with the baseline image via a ratio and logarithmic operation allows for calculation of the apparent diffusion coefficient (ADC) image, known also as the ADC map. This map is free of all T1, T2, and receiver coil sensitivities, and quantitative measurements of tissue water diffusion may be made from individual voxels, or regions-of-interest (ROIs), reported as the ROI's ADC in units of mm2/s.
The rapid, single-shot EPI acquisition helps avoid motion degradation of individual images, an important consideration when diffusion sensitization gradients are being applied to sensitize the images to microscopic motions associated with water diffusion. However, this also causes marked spatial distortions and low SNR encountered, particularly when increasing image matrix sizes to match spatial resolutions common to morphologic T2WI scans. In practice, we utilize 128 × 96 (frequency × phase) matrices with a FOV of approximately 18 cm and rely solely on the endorectal coil for signal to avoid the aliasing of extraglandular tissue into the desired FOV (Table 1). For reasons discussed in more detail below, cancerous lesions will generally have restricted diffusion with lower ADCs than surrounding healthy prostate tissue and so will appear hypointense on ADC maps but hyperintense on the diffusion-weighted, high b-value image (see Figure 4). The latter image also contains T2 weighting with the possibility of T2 shine-through (39), so both high and low b-value images, as well as the T2W image, are consulted when reading these exams.
Figure 4. Diffusion-Weighted Imaging of Prostate Cancer.

A 58 year-old man with PSA 16.4, Gleason 4+3=7, T3aN0M0 prostate cancer. On a previous biopsy of this patient, the right side of the prostate was graded as Gleason 4+3=7 (an intermediate grade). (a) A DW image showing a dominant lesion (boxed), evidenced by the increased signal, found on the posterior right side at 7 o'clock. (b) Concordantly, the ADC map, generated from the DWI data, shows a darkened signal, indicating restricted diffusion at the same level and region as in (a). (c) For comparison, the T2-weighted image at the same level, showing a hypointense lesion (boxed) in the same region of the gland as the dominant lesion seen in (a) and (b). The ADC value in the region of tumor is 680 × 10-6 mm2/s, while the ADC value in the less suspicious contralateral side of the prostate is 1150 × 10-6 mm2/s. Thus, both morphologic and quantitative diffusion imaging data support the biopsy finding of prostate cancer on the right side of the gland.
Histologic Correlation of T2WI and DWI
Since T2WI and DWI are valuable components for evaluating the prostate, it is important to understand how the signal characteristics observed for these modalities are related to specific tissue components (40-42). The prostate gland is commonly divided into the CG (containing both the central and transition zone (TZ)) and PZ, with most cancers (approximately 75 %) occurring in the PZ. Healthy PZ consists primarily of glandular lumen lined with secretory epithelium, all of which is embedded within a stromal matrix (40,42). With the exception of the secretory epithelia, macromolecular water content and free water content are low in stroma and high in luminal space in these normal structures. These characteristics result in relatively long T2 values and unrestricted water diffusion, e.g. high ADCs, in the PZ. However, Bourne et al. have demonstrated, using high-field (16 T) MR microscopic diffusion studies of fixed tissues, that the secretory epithelia within healthy PZ represents a compartment of highly restricted water diffusion, e.g. low ADC (42). Their findings possibly explain in vivo observations of two diffusion components within healthy PZ voxels when multiple b-factor measurements were made over an extended b-factor range reaching 3500 s/mm2 (43). More recently, detailed T2 studies of 16 healthy volunteers by Storas et al. (44) revealed that healthy PZ voxels in vivo also display at least two T2 components. The longer T2 component (T2 ∼ 890 ms) was attributed to fluid filled luminal spaces, and the shorter T2 component (T2 ∼ 65 ms) was credited to the connecting stromal tissue and/or epithelial components. The fraction of the fast and slow T2 components varied widely within both anatomic zones (PZ vs. CG) and among subjects, as expected given the biological heterogeneity readily observed in histologic tissue samples (42,44).
To summarize, healthy PZ tissue on T2WI and DWI appears as a region with both high T2 and high ADC. When luminal space and stromal matrix is lost to cancer, which consists of highly compacted cells, water diffusion becomes generally more restricted and macromolecular content increases. Water molecules encountering membrane boundaries and macromolecules within cancerous zones demonstrate observable decreases in both T2 (45-48) and ADC (48-50). Two recent studies by Wang et al. (51) and Gibbs et al. (25) utilized histological measurements of cancer cell density to obtain inverse relationships between prostate cancer tumor cellularity and ADC values.
Healthy CG contains not only the same tissue components as the PZ but also more smooth muscle cells within the stromal matrix and frequently regions of benign prostatic hyperplasia (BPH). There are two histological types of BPH – glandular and stromal. The former appear as hyperintense nodules and the latter appear as hypointense nodules, which can occasionally mimic the appearance of cancer. However, the typical stromal tissue is curvilinear or band-like as it permeates between the glandular elements of BPH. Since muscle tissue has one of the lowest T2 values, healthy CG appears more hypointense and heterogeneous than the surrounding PZ on T2WI of the normal prostate, making CG tumor detection more difficult.
Both the CG and the PZ can also contain regions of inflammatory cells in common conditions like chronic prostatitis (52). The inflammatory cells replace luminal spaces with scar formation due to thickening of the ductal walls and contribute to shorter T2 values and subsequently hypointense regions on T2WI (52). These are linear and typically radiate out from center. They can cause an overall decrease in PZ signal, diminishing the specificity of the T2WI signal alone for cancer. Finally, age-related changes in the prostate are well-known, and a study by Tamada et al. highlighted an overall increase in PZ ADC values with age as measured in a cross-sectional study of 114 healthy men between 21 and 81 years of age (53).
Dynamic Contrast-Enhanced Imaging
The goal of DCE imaging is to capture the passage of contrast material into and out of the prostate using T1WI with high temporal resolutions (between 5 to 10 s). This is accomplished on current scanners with 3D spoiled gradient echo (3D SPGR) sequences using very short TR periods of approximately 5 ms, which can acquire 256 × 160 × 20 3D matrix data at approximately 6- to 8-s intervals using parallel imaging factors of ∼ 2 (Table 1). We generally perform about 50 such acquisitions consecutively, with the contrast material automatically infused following ∼5 pre-contrast baseline acquisitions, resulting in DCE image acquisition lasting about 5 minutes. The 3D acquisitions are of lower spatial resolution compared to T2W anatomical images, as the goal is to generate signal vs. time curves from selected ROIs that adequately characterize the signal changes accompanying the distribution of the Gd contrast agent over the body tissues. The temporal resolution of typical DCE acquisitions is fast enough to capture the rapid increase of signal, or wash-in phase, occurring within the first 30 seconds of contrast administration. The temporal resolution is also sufficient to allow for a quantitative assessment of the rate that this signal enhances from the initial slope of the signal vs. time curves. The duration of the DCE imaging component is also long enough to characterize the slower rate at which contrast material leaves the tissue in the wash-out phase after achieving peak signal values.
The signal vs. time curve from any given voxel is sensitive to the underlying vascular properties of the tissue and its ability to absorb contrast agent from the vasculature into the interstitial space between cells (commercial MR contrast agents, as currently designed, do not enter cells), and then return from the interstitial space in the prostate to the vasculature as contrast material is removed from the blood by the kidneys. There are a number of approaches for examining the signal vs. time relationships in DCE, from qualitative assessment to more sophisticated, quantitative pharmacokinetic (PK) modeling. One of the qualitative approaches is to visually assess regions that enhance first, as these may be regions of cancer with a higher vascularity than neighboring healthy tissues. Empirical analyses of the signal vs. time curves may also be performed in which quantities such as the initial slope, the time-to-peak (TTP) parameter, the maximum signal enhancement, the wash-out slope, and the area under the curve after a specified time (AUCtime) are calculated and represented via voxel-by-voxel parameter maps. In such approaches, the raw signal should be converted into contrast agent concentration units, a step which is made to remove the influences of proton density and receiver coil sensitivities on the signal values and simplifies the observed changes to contrast agent effects on the water relaxation.
PK Modeling and Histologic Correlation to DCE Imaging
PK modeling of dynamic tissue Gd concentrations are generally based on two-compartment considerations and require additional information beyond the concentration vs. time curves (54,55). The two compartments are the plasma space of the vasculature and the interstitial space between prostate cells, into and out of which the contrast agent can leak. As discussed by Tofts et al. (54), the three primary parameters extracted from such models are Ktrans, the forward volume transfer constant of Gd between blood plasma and the interstitial space expressed in units of min-1, ve, the dimensionless fractional volume of interstitial or extracellular space per unit volume of tissue, and kep, the reverse reflux rate constant between extracellular space and plasma, also expressed in units of min-1 and related to the previous two parameters through the ratio Ktrans/ve.
As mentioned above, a proper calculation of these parameters requires additional information. First, pre-contrast T1 values throughout the prostate should be measured to allow for conversion of signal vs. time curves to Gd concentration vs. time curves. Commonly, the product of the repetition time, TR, and longitudinal relaxation, R1 = 1/T1, is such that TR × R1 ≪ 1. Furthermore, a linear relationship between R1 and Gd concentration is assumed. Thus, the ratio of signal at time point n, Sn, divided by baseline signal S0, is proportional to the Gd concentration c via
| [1] |
where R1,0 is the longitudinal relaxation rate in the absence of any Gd and r is the relaxivity of the agent (∼ 5 s-1/mM Gd for common Gd agents).
Eq [1] may be rewritten as follows
| [2] |
which explicitly demonstrates the need to form ratio images with respect to baseline and to measure pre-Gd R1,0 values in order to quantify c for subsequent pharmacokinetic analyses.
The PK parameters discussed also depend on knowledge of the concentration of the contrast agent in the plasma, known as the Arterial Input Function (AIF). The AIF can be measured specifically for individual patients from suitably situated vessels. However, in a standard clinical setting, the required temporal resolution may be difficult to achieve. Additionally, there are a range of factors that can affect the shape and amplitude of the AIF curve, such as the speed of contrast bolus injection, cardiac output, site of the vessel selected, range of pixels within a selected vessel, and partial volume effects. A more common approach to the AIF is to utilize a population-averaged AIF in the form of a bi-exponential decay, as described in the extended Tofts model (56). However, more recently, Parker et al. introduced a functional AIF that utilizes a first-pass peak, a re-circulation peak, and a wash-out period (57), which is thought to improve the reproducibility of the PK parameters. Notably, however, no significant difference between experimentally-derived individual AIF and population-averaged AIF was found for predicting prostate cancer biopsy results in one study (58).
Figure 5 shows a typical result from a DCE examination in which ROIs for unsuspicious tissue and suspected prostate cancer are noted on T2WI along with the corresponding Ktrans and ve maps, with the resultant normalized signal vs. time curves plotted below. It is clear that the suspected ROI enhances faster than a benign ROI in the PZ, a hallmark of the pathologic angiogenesis seen to accompany cancer.
Figure 5. Dynamic Contrast-Enhanced Imaging of Prostate Cancer.

The following images are from a 61 year-old man diagnosed with PSA 4.1, Gleason 4+4 = 8, T2cN0M0 prostate cancer. (a) An axial T2-weighted image of the prostate with an unsuspicious, high signal intensity region of PZ prostate (outlined in green). (b) An axial T2-weighted image of the prostate at a different level with a focal region of hypointense signal in the PZ suspicious for prostate cancer (outlined in red). (c) A Ktrans (forward volume transfer constant) map at the same level as the unsuspicious region in (a), showing low enhancement (blue indicates low enhancement) in the ROI. (d) In contrast, a Ktrans map for the same level as the suspicious region in (b) reveals focal enhancement (yellow and red indicate higher levels of enhancement). (e) A ve (the fraction of extracellular extravascular space) map for the unsuspicious region, indicating no increased fraction relative to the rest of the prostate. (f) The ve map for the suspicious region in (b) shows lower signal (light blue) in the ROI compared to the background prostate gland, as expected in prostate cancer. (g) Kinetic curves of gadolinium concentration versus time for the normal (green) and tumor (red) regions of interest. Overall, the region suspicious for tumor demonstrates lower signal intensity on T2-weighted imaging, higher Ktrans, lower ve, and greater enhancement (higher maximum concentration of contrast reached, as seen in the kinetic curves) as compared to the normal region of interest.
Magnetic Resonance Spectroscopic Imaging
1H MRS has provided the only metabolic information used in clinical prostate cancer studies to date. The methodology has evolved from single voxel samplings with the water-suppressed, stimulated echo acquisition mode (STEAM) sequences or point-resolved echo spectroscopy (PRESS) sequences to 3D spectroscopic acquisitions using a water-suppressed PRESS box to limit the acquired signal to the gland. Of note, the metabolites of interest in MRSI are in far less abundance than the solvent water molecules, as mM concentrations of a substance are being detected among the molar concentrations of water present. As a result, water suppression pulses must be applied prior to the three, orthogonal slab-selective pulses which define the PRESS box (59). Also, spectroscopic acquisitions are generally performed in the absence of gradients to allow for metabolite quantification. Thus, spatial localization in 3D requires the use of three nested, phase-encoding steps, making scan times even for small 3D matrices relatively long. For example, a recent multi-site clinical trial performed at 1.5 T (60) (discussed further below) utilized a 16 × 8 × 8 3D matrix with a 1 s TR to acquire metabolic data from about 7 mm3 voxels in a scan time of approximately 17 minutes. To be clinically viable, long acquisitions must be reduced, and methods have been introduced to address this. These include elliptical k-space sampling (61) and echo planar spectroscopic imaging (EPSI) methods in which frequency encoding and spectroscopic encoding are both performed during the acquisition period with the use of multiple gradient echoes (62,63) and parallel imaging algorithms combined with multiple coil arrays (64-66). Even though shorter acquisitions and higher field strengths can be anticipated in the future, the utility of 1H MRS as a clinical tool for prostate cancer localization or staging remains uncertain, as it depends on the clinical value placed on the metabolic information gleaned from such studies.
Histologic Correlation of MRSI
Within the healthy prostate, the most prominent spectroscopic signals arise from citrate methylene protons (Cit) and the methyl groups of creatine (Cr)- and choline (Cho)-containing compounds. Measured in part per million (ppm), these three resonances appear at approximately 3.2, 3.0, and 2.6 ppm with respect to the water resonance at 4.7 ppm. A high concentration of citrate is unique to the prostate, playing an important role in the normal physiological function of the gland (67). Voxel sizes used in MRS are much larger (on the order of 0.5-ml voxels) compared to imaging voxels which are typically in the μl-range, making accurate spatial localization problematic. In practice, spectral overlays, like those shown in Figure 6, are used, in which voxels and their corresponding spectra are viewed with respect to an underlying high spatial resolution T2W image. As a result, increases in Cho can be appreciated in comparison with the citrate signal along with the corresponding quantitative measure of the (Cho + Cr)/Cit ratio (discussed below).
Figure 6. MRS Imaging of Prostate Cancer.
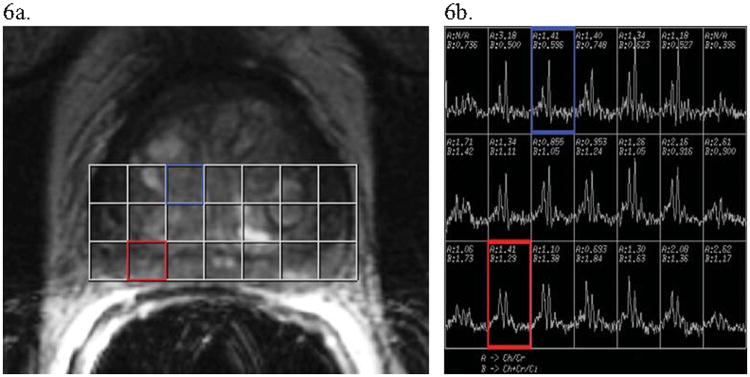
Images and post-image processing data from a man with biopsy-diagnosed prostate cancer. (a) An axial T2-weighted image of a prostate divided into voxels for MRS imaging analysis. (b) The MR spectra for choline+creatine (the first dominant “composite” peak from the left of each spectrum) and citrate (the second dominant peak from the left). The blue voxel incorporating unsuspicious central gland on T2-weighted imaging (a) shows a normal spectrum along with a normal (Cho+Cr)/Cit ratio, with much more citrate than choline+creatine present (see spectrum also boxed in blue in (b)). Alternatively, the red voxel contains peripheral zone prostate which has T2 hypointensity, making it suspicious for cancer (notably, the associated T1 image was negative for hemorrhage). The voxel's associated spectrum (boxed in red in (b)) shows a higher (Cho+Cr)/Cit ratio (approximately equal peaks) than seen in the unsuspicious blue voxel. This indicates a possible region of tumor in the red voxel's region, especially given the suspicious hypointense signal on T2-weighted imaging.
The citrate resonance is relatively unique since it can be represented as a strongly coupled AB system which yields a four-resonance quartet whose actual shape is sensitive to the precise timing delays between the RF pulses of the PRESS sequences. Importantly, quantum mechanical calculations have helped optimize the citrate spectral pattern in clinical MR studies (68,69). The Cr and Cho resonances, arising from uncoupled protons of methyl (CH3) groups, have simpler spectral patterns referred to as singlets. Quantitation of the areas underneath these three major metabolite signals permits calculation of a ratio (Cho + Cr)/Cit, which is often used as the quantitative biomarker for detecting cancer. As in most cancers examined with MRS, the choline-containing compounds associated with membrane production and degradation rise in quantity, resulting in an increased signal from Cho and the corresponding ratio (Cho + Cr)/Cit in regions of cancer infiltration. Again, the CG, with more smooth muscle cells and overall heterogeneity than the PZ, has proven to be a more difficult area to use the (Cho + Cr)/Cit ratio for cancer localization. Within the PZ, however, impressive early results were found using this quantitative ratio as a confirmative diagnostic tool (70-73). However, several years ago the researchers who first suggested the (Cho + Cr)/Cit ratio as a biomarker determined that an additional resonance from polyamines, primarily spermine, was present within the spectral region of the 3.0 to 3.2 ppm peak and was occasionally visible at 3.10 ppm (74). Similar to citrate, this resonance arises primarily in healthy tissue and so is expected to be reduced in prostate cancer regions. Shukla-Dave et al. recommended incorporating the polyamine resonance into the spectroscopic analysis along with the (Cho+Cr)/Cit ratio, though this has not been widely adopted (75). Nonetheless, the reported values for (Cho+Cr)/Cit ratios to date have contributions from the polyamine resonances, and further studies with multi-dimensional MRS sequences (76) may prove valuable in obtaining a more complete understanding of the 3.0 to 3.2 ppm spectral region. Additionally, the aforementioned issue of chronic prostatitis is also thought to be a confounder in MRSI data as its presence lowers the signal intensity, lowers the citrate concentration, and increases the choline concentration, inappropriately raising suspicion for cancer in benign tissue (52).
The Emergence of Quantitative Image Analysis
As sequences and analyses evolve, the information gathered is being used in either a qualitative or quantitative fashion. The T2W images acquired provide exquisite qualitative visualization of sub-glandular structures that can be used for immediate image interpretation. Since T2W images are a composite of multiple effects, including the T2-weighting specific echo time (TE), proton density (the number of water protons contributing to each voxel), residual T1-weighting reflected by the selected repetition time (TR), sensitivity of the receiver coil(s), main static field (Bo), and RF transmission (B1) inhomogeneity, the quantitative values of individual signal intensities in any given voxel have no specific meaning outside of their relation to their neighbors. However, if images are collected at more than one echo time, then estimates of T2 values (in ms) may be made for each voxel (45-47) and displayed as T2 maps with tissue-specific T2 values. T2 maps have largely been restricted to research settings, but the quantitative analysis of what are now largely qualitative acquisitions may prove beneficial in clinical settings.
In contrast to T2WI, quantitative evaluation of DWI is becoming standard in clinical practice. Notably, vendor-supplied software already processes the qualitative DW images, which are again an amalgam of not just diffusion effects but also T1, T2, and receiver coil(s) sensitivity(ies) effects, etc., to generate quantitative ADC maps, where measurements of voxel signal intensities yield estimates of tissue water diffusion coefficients in units of mm2/s. The generation of quantitative data like T2 or ADC values from multiple acquisitions allows for an evaluation of how specific a given T2 or ADC value in a region is for discriminating cancer from normal healthy tissue. Potentially, threshold values (77) of these parameters for use in tissue differentiation can be commonly utilized in clinical prostate MR exams.
Of course, any quantitative measurement is susceptible to error for any number of reasons, both instrumental and biological. For example, true T2 measurements rely on radio-frequency (RF) pulses that deliver perfect 90° and 180° flip angles in the spin echo-based sequences used to generate data at different TEs, and this is a known source of error (78). Furthermore, the few point measurements used to calculate T2 or ADC maps inherently assume a mono-exponential decay of signal with TE or b-factor, respectively, and in biological tissues with multiple different water compartments, this, too, is known to be an approximation. Thus, it is critical for practitioners of quantitative MR to report both their acquisition strategies and their methods of data analysis.
Similarly, with DCE studies the PK parameters all depend heavily on the model used to calculate and/or interpret them, which in turn depends on the nature of the vascularity of the tissue and its inherent permeability to contrast agent. A clear discussion of the limitations to the commonly used Tofts models for DCE has recently been published (55). Also, inputs to the common models used to determine DCE parameters include AIFs, as measured in nearby vessels or taken from a population-based reference, as well as pre-contrast tissue T1 values. These separate measurements are also prone to errors which then propagate through the non-linear PK analyses.
For MRSI, MRS measurements of spectral peak areas are inherently T1- and T2-weighted depending on the acquisition parameters. Also, the calculations may be inaccurate from instrumental artifacts, including large baseline distortions from insufficiently suppressed water and/or poor shimming, resulting in broad, overlapping resonances. All of these above complications create situations where there are “institutional” units for a particular calculation, which may be consistent and interpretable within a single institution but are not when attempting to reproduce at another center. These values can still be of clear utility within an institution, as when a particular measurement is trended to assess the success of a patient's treatment. For example, in a recent study evaluating multiparametric 3T endorectal MRI, the ADC was used as one parameter to detect prostate cancer recurrence following external beam radiation, a treatment which limits T2-weighted assessment of recurrence (79).
However, having errors in measurement between institutions causes obvious difficulty when attempting to evaluate quantitative methods in multi-center trials. As a result, these complications make quantitative image analysis an active area for research for the development and testing of improved measurement techniques and rigorous testing of biophysical models for better determination of quantitative tissue characterization parameters.
New Clinical Interpretations and Performance Assessments in Multiparametric MRI
Modern MR studies often incorporate a combination of the methods discussed above and use statistical modeling or machine-learning techniques to combine the data, compare with available histopathology, and calculate performance characteristics for prostate cancer predictions. Ongoing changes occurring in the field, such as the transition from 1.5 T to 3 T, improved receiver coil design, and the use of an expanding array of pulse sequences, as well as the shift in the presentation of patients with prostate cancer towards those with smaller, less advanced tumors due to increased PSA screening (80), result in studies with findings which may be applicable only to a particular institution's clinical practice and the period of time that the study was undertaken. Nevertheless, these studies, as they have shown progress overall in improving accurate detection and localization of prostate cancer, are useful for justifying the continued implementation, development, and testing of advanced MR methods as they become available.
Tables 2 and 3 present over 30 articles within the past 5 years that have significantly added to the literature by either drawing new conclusions of clinical value or evaluating individual modality or multiparametric approaches for cancer detection and localization. Salient points from the studies are reviewed in both tables, and their findings are discussed in more detail below.
Table 2.
A list of recent articles over the past 5 years utilizing individual MRI modalities to evaluate performance characteristics or to characterize prostate tissues. The table is divided into studies relevant to particular modalities (T2W, DW, DCE, or MRS imaging).
| Authors | Study Design | No. of Patients | Magnetic Field strength (T) | Endorectal Coil | T2W | DW | DCE | MRS | Histopathologic Correlation | Findings |
|---|---|---|---|---|---|---|---|---|---|---|
| T2WI-Related Studies | ||||||||||
| Wang et al. (81) | Retrospective | 74 | 1.5 | Yes | Yes | No | No | No | Whole-mount step sections | Higher Gleason grades are significantly associated with lower tumor-muscle signal intensity ratios on T2WI, showing potential utility for measuring prostate cancer aggressiveness. |
| Roebuck et al. (45) | Prospective | 18 | 1.5 | Yes | Yes | No | No | No | Biopsy or RP specimen reports | T2 values are significantly shorter in prostate cancer compared to healthy tissue, showing that Carr-Purcell-Meiboom-Gill quantitative T2 imaging may be useful for tissue discrimination. |
| DWI-Related Studies | ||||||||||
| Miao et al. (27) | Retrospective | 37 | 3 | No | Yes | Yes | No | No | Needle biopsy | At 3T, DWI was significantly more accurate than T2WI at detecting prostate cancer. |
| Oto et al. (83) | Retrospective | 49 | 1.5 | Yes | Yes | Yes | Yes | No | Step sections | ADC values significantly discriminate between CG prostate cancer, stromal hyperplasia, and glandular hyperplasia. Ktrans improved performance characteristics when added to ADC in ROC analysis without significantly improving AUC. |
| Hambrock et al. (10) | Retrospective | 51 | 3 | Yes | Yes | Yes | No | No | Whole-mount step sections | At 3T, PZ prostate cancer Gleason grade is significantly inversely correlated to ADC values. |
| Turkbey et al. (84) | Retrospective | 48 | 3 | Yes | Yes | Yes | No | No | Needle biopsy | At 3T, a significant, negative correlation between ADC and both Gleason score and D'Amico clinical risk score is observable. |
| Zelhof et al. (85) | Prospective | 36 | 3 | No | Yes | Yes | No | No | Whole-mount step sections | There is a significant correlation between ADC values and cell density, regardless of tissue type. |
| Kim et al. (28) | Retrospective | 48 | 3 | No | Yes | Yes | No | No | Step sections | At 3T, high b-value DWI was able to improve the performance of ADC accuracy in predicting prostate cancer. DWI using a b value of 1000 s/mm2 is more accurate in predicting cancer than at 2000 s/mm2. |
| Metens et al. (29) | Retrospective | 41 | 3 | No | Yes | Yes | No | No | Needle biopsy | At 3T, b values of 1500 s/mm2 and 2000 s/mm2 best depict prostate cancer lesions. The highest contrast-to-noise ratio was significantly obtained at b = 1500 s/mm2. |
| DCE-Related Studies | ||||||||||
| Ocak et al.(86) | Prospective | 50 | 3 | Yes | Yes | No | Yes | No | Needle biopsy | Specificity for prostate cancer detection in the PZ is improved with PK data from DCE, especially Ktrans and kep, as compared to T2WI alone. |
| Girouin et al.(87) | Retrospective | 46 | 1.5 | No | Yes | No | Yes | No | Whole-mount step section | Morphologic DCE imaging is significantly more sensitive, but significantly less specific, than T2WI for tumor localization in pelvic phased-array coil-only MRI. |
| Scherr et al. (88) | Retrospective | 27 | 1.5 | Yes | Yes | Yes | Yes | Yes | Needle biopsy or whole-mount | DCE imaging using quantitative MR perfusion parameters discriminated PZ prostate cancer and benign tissue significantly with several DCE parameters. However, discrimination between prostate cancer and TZ was not reliable. |
| Zelhof et al.(23) | Prospective | 52 | 3 | No | Yes | No | Yes | No | Whole-mount | In DCE imaging, finding the maximum enhancement index (MaxEI) and final slope of the signal intensity change combined for good performance characteristics for detecting malignancy. MaxEI was significantly different in malignant compared to benign lesions. |
| Franiel et al. (89) | Prospective | 35 | 1.5 | Yes | Yes | No | Yes | No | Selected blocks (partial review) | Blood flow provided significant discrimination between those with prostate cancer, chronic prostatitis, and normal tissue. Blood volume and interstitial volume are not significantly associated with these tissue types. |
| Franiel et al. (90) | Prospective | 53 | 1.5 | Yes | Yes | No | Yes | No | Serial sections | Using DCE for prostate cancer vs. normal tissue differentiation, the use of perfusion from an entire region is superior to using perfusion or blood volume in MRI “hotspots.” |
| MRS Imaging-Related Studies | ||||||||||
| Giusti et al. (91) | Retrospective | 52 | 1.5 | Yes | Yes | No | No | Yes | Whole-mount step sections | The (Cho+Cr)/Cit ratio significantly correlates to pathologic Gleason score. MRSI added significantly to T2WI alone for performance, including sensitivity and accuracy. |
| Scheenen et al.(92) | Prospective | 109 | 1.5 | Yes | Yes | No | No | Yes | Whole-mount or in quadrants | 3D MRSI is valuable for significantly discriminating between benign tissue and cancer using the (Cho+Cr)/Cit ratio in the PZ and CG. |
| Kobus et al.(93) | Retrospective | 43 | 3 | Yes | Yes | No | No | Yes | Serial sections | The MRS imaging measurements of maximum (Cho+Cr)/Cit, Cho/Cr, and standardized malignancy ratings incorporating these two ratios were all significantly associated with tumor grade. |
| Scheenen et al.(24) | Prospective | 45 | 3 | No | Yes | No | No | Yes | Serial sections | 3D MRSI using only external surface coils can be used to significantly differentiate healthy tissue from prostate cancer in both the PZ and CG. |
| Yakar et al. (30) | Prospective | 18 | 3 | Yes | Yes | No | No | Yes | Serial sections | Using an endorectal coil at 3T for MRSI localization of prostate cancer, performance is significantly increased vs. using only external body coils. |
Table 3.
A list of recent articles over the past 5 years illustrating the performance characteristics of multiparametric imaging using different combinations of T2W, DW, DCE, and MRS imaging.
| Authors | Study Design | No. of Patients | Magnetic Field strength (T) | Endorectal Coil | T2W | DW | DCE | MRS | Histopathologic Correlation | Findings | |
|---|---|---|---|---|---|---|---|---|---|---|---|
| Haider et al. (94) | Prospective | 49 | 1.5 | Yes | Yes | Yes | No | No | Whole-mount | In the PZ, accuracy is significantly higher for T2WI+DWI compared to T2WI alone. Including the whole prostate, sensitivity was significantly higher for the combined method compared to T2WI alone. | |
| Lim et al. (95) | Retrospective | 52 | 1.5 | Yes | Yes | Yes | No | No | Step sections | ADC maps+ T2WI combined significantly improves performance (sensitivity and accuracy) of MR detection of prostate cancer over T2WI alone. | |
| Mazaheri et al. (96) | Retrospective | 42 | 1.5 | Yes | Yes | Yes | No | No | Whole-mount step sections | T2WI + DWI significantly improves the accuracy of PZ tumor volume measurement over T2WI alone. | |
| Vargas et al. (97) | Retrospective | 51 | 3 | Yes | Yes | Yes | No | No | Whole-mount step sections | The accuracy of T2WI alone and ADC maps +T2WI were similar for tumor detection. Also, a lower mean ADC was significantly correlated to a higher tumor Gleason score. | |
| Futterer et al.(98) | Prospective | 34 | 1.5 | Yes | Yes | No | Yes | Yes | Whole-mount step sections | The use of DCE+MRSI is significantly better for reader accuracy of tumor localization than T2WI alone. Also, the accuracy of DCE is significantly greater than MRSI for tumor localization. | |
| Turkbey et al. (21) | Prospective | 70 | 3 | Yes | Yes | No | Yes | Yes | Whole-mount sections | T2W, DCE, and MRS imaging at 3T each provide significant and additive predictive value for prostate cancer detection in the PZ. | |
| Kitajima et al. (26) | Retrospective | 53 | 3 | No | Yes | Yes | Yes | No | Needle biopsy | There was a significant increase in the performance characteristics of cancer detection for both T2WI+DWI and T2WI+DWI+DCE imaging compared to T2WI alone. | |
| Delongchamps et al. (99) | Prospective | 57 | 1.5 | Yes | Yes | Yes | Yes | No | Whole-mount | For accurate PZ tumor detection, T2WI+DWI, T2WI+DCE, and all three imaging modalities combined were significantly greater than for T2WI alone. T2WI+DWI was significantly greater than T2WI+DCE imaging and all three sequences combined for accuracy. | |
| Turkbey et al. (100) | Prospective | 45 | 3 | Yes | Yes | Yes | Yes | Yes | Whole-mount sections | PPVs of mpMRI detection of prostate cancer in the overall prostate, PZ, and CG were 98%, 98%, and 100%, respectively. | |
| Delongchamps et al. (101) | Prospective | 58 | 1.5 | Yes | Yes | Yes | Yes | No | Whole-mount sections | For low-risk patients, PZ tumor detection is significantly better with T2WI+DWI+DCE than with either T2WI+DWI or T2WI alone. In the TZ, T2WI+DWI performed significantly better than T2WI alone, while other combinations were not significantly different. | |
| Weinreb et al. (60) | Prospective | 110 | 1.5 | Yes | Yes | No | No | Yes | Whole-mount or standard blocks | PZ prostate cancer localization accuracy is equal for T2WI+MRSI and T2WI alone using 1.5 T erMRI. | |
| Casciani et al. (102) | Retrospective | 70 | 1.5 | Yes | Yes | No | No | Yes | Serial sections or needle biopsy | There is an incremental benefit of adding MRSI to T2WI but without a statistical significance being shown. | |
| Mazaheri et al. (103) | Retrospective | 38 | 1.5 | Yes | Yes | Yes | No | Yes | Whole-mount step sections | For discriminating between cancerous and benign regions in the PZ, a combination of ADC and mean metabolic ratio (MET) performs significantly better than MET alone (but not ADC alone). | |
| Langer et al. (104) | Prospective | 25 | 1.5 | Yes | Yes* | Yes | Yes | No | Whole-mount sections | Combined quantitative T2WI+DWI+DCE imaging measures were significantly more accurate than any individual measure except for ADC for identifying PZ prostate cancer. | |
| Langer et al.(40) | Retrospective (as part of an ongoing prospective study) | 24 | 1.5 | Yes | Yes | Yes | Yes | No | Whole-mount | All MR parameters were significantly different between prostate cancer and normal PZ. ADC, T2, Ktrans, and ve all had significant correlations to specific histologic components. | |
| Gibbs et al. (25) | Prospective | 20 | 3 | No | Yes | Yes | No | No | Whole-mount | ADC and T2 are significantly negatively correlated with cell density. | |
| Langer et al.(41) | Retrospective | 18 | 1.5 | Yes | Yes | Yes | No | No | Whole-mount | Sparse prostate tumors have similar ADC and T2 values compared to normal PZ tissue, in contrast to dense tumors, where significantly lower T2 values and ADCs are found. As a result, MRI detection in prostate cancer using ADC and T2 values may be limited. | |
T2-Weighted Imaging
Recent developments in T2WI (Table 2) show that quantitative imaging may result in improved prostate cancer detection and localization. In Wang et al. (81), it was found that higher Gleason grades are significantly associated with lower tumor-muscle signal intensity ratios on T2WI. Using a different type of quantitative analysis, Roebuck et al. (45) evaluated T2 values on a pixel-by-pixel basis using Carr-Purcell-Meiboom-Gill (CPMG) quantitative T2 imaging. Using this method, suspicious PZ regions were found to have significantly shorter T2 values in prostate cancer as compared to healthy tissue. Similar findings were present in an earlier study associating lower T2 values with lower citrate content, with diminished citrate content being a marker for malignancy since citrate levels decrease as acinar structures are replaced by cancer cells (82). Together, these studies exhibit that T2 mapping may be useful for tissue discrimination between prostate cancer and benign tissue.
Diffusion-Weighted Imaging
Several studies which highlight recent additions to the DWI literature in prostate cancer are included in Table 2. Several years ago, when comparing DWI to T2WI at 3T, Miao et al. (27) found significantly better cancer detection accuracy with DWI, showing the potential value of this modality for prostate cancer. One of the most important recent advances in prostate cancer imaging is the use of ADC values for characterizing prostate tissues. Oto et al. (83) found that there is a significant difference between ADC values in CG prostate cancer, stromal hyperplasia, and glandular hyperplasia. In Hambrock et al. (10), a significant inverse correlation between ADC values and Gleason score was well-illustrated. This was again established in Turkbey et al. (84), along with ADC also being significantly inversely correlated to D'Amico clinical risk scores. Additionally, Zelhof et al. (85) presented a significant correlation between ADC values and cell density, irrespective of whether the tissue was malignant or benign. On a technical note, to optimize the discrimination of prostate cancer from benign tissue using ADC, Kim et al. (28) and Metens et al. (29) have reported b values of 1000 to 1500 s/mm2 to be the most helpful, respectively.
Dynamic Contrast-Enhanced Imaging
Critical studies are shown in Table 2 which helped refine DCE imaging and illustrate its utility for prostate cancer imaging. In Ocak et al. (86), PZ prostate cancer determination specificity was found to be improved using PK DCE data at 3T, significantly so with Ktrans and kep, as compared to T2WI. This is in contrast to Girouin et al.'s (87) study of morphologic DCE for diagnosis, which found that DCE was significantly more sensitive, but less specific, than T2WI for tumor localization. In the more recent work of Scherr et al. (88), PK DCE analysis was noted to significantly discriminate PZ prostate cancer from benign tissue with several DCE parameters, though this finding did not extend to the TZ. Rather than evaluating standard pharmacokinetic parameters, Zelhof et al. (23), studied empirical parameters, like the maximum enhancement index (MaxEI) and the final slope of the signal intensity change following contrast administration. They determined these parameters to have good performance characteristics for detecting malignancy, with a sensitivity and specificity of 89% and 90%, respectively.
Franiel published several studies involving blood volume and blood flow for evaluating prostate cancer. In one study, blood flow was found to significantly discriminate between prostate cancer, chronic prostatitis, and benign tissue, while blood and interstitial volume were not reliably correlated with benign or malignant tissue (89). In another study, using both “hotspots” of perfusion or blood volume within a ROI were found to be inferior to using the perfusion of an entire prostate region for the discrimination of prostate cancer from benign tissue (90). Taken together, this suggests that evaluating a region's blood flow is useful to determine the presence of prostate cancer.
Magnetic Resonance Spectroscopic Imaging
For MRSI, several recent studies are cited (Table 2) which have helped improve and/or evaluate this challenging modality. Correlations between Gleason scores and metabolite ratios gleaned from MRSI have been found in the past by Zakian et al. (11) and Giusti et al. (91). Scheenen et al. (92) showed that the (Cho+Cr)/Cit ratio was a significant discriminator between benign tissue and prostate cancer in both the CG and PZ. Building on this, Kobus et al. (93) concluded that the maximum (Cho+Cr)/Cit ratio, Cho/Cr ratio, and standardized malignancy ratings (which incorporated both ratios) were significantly associated with tumor grade. Additionally, while most studies involving prostate MRSI utilize an endorectal coil, Scheenen et al. (24) found that external coils can be used exclusively to significantly discriminate prostate cancer from healthy tissue using MRSI. However, Yakar et al. (30) determined that at 3T, using an endorectal coil resulted in a significantly higher AUC as opposed to without it for 3D MRSI.
Multiparametric Imaging
Numerous studies are cited in Table 3 which involved a combination of sequence parameters to evaluate the performance characteristics of prostate cancer detection and localization using multiparametric imaging. Haider et al. (94), evaluating the addition of DWI to T2WI for the accuracy of prostate cancer detection, determined that DWI+T2WI was significantly more sensitive throughout the whole prostate compared to T2WI alone and was significantly more accurate in the PZ. Lim et al. (95), limiting their study to a combination of T2WI and DWI of CG and PZ lesions with three different readers with varied levels of experience, concluded that AUC values for each of the readers significantly improved (P < 0.001) with the use of T2W and ADC data in comparison to T2WI alone. Mazaheri et al. (96), when looking at the effect of DWI on tumor volume measurement accuracy in the PZ, determined that DWI+T2WI was significantly more accurate than T2WI alone for this purpose. However, Vargas et al. (97) subsequently examined the incremental value of adding DWI to T2WI and found no statistical difference between the AUC values of two readers for assessing T2W images alone or with the addition of ADC maps.
Utilizing 3 different imaging parameters, Futterer et al. (98) concluded from T2W, DCE, and MRS imaging that the modalities separately yielded AUC values of 0.68, 0.91 and 0.80, respectively, that tumor localization accuracy with DCE imaging was significantly better than with MRSI, and that the combination of DCE and MRSI was significantly better for reader accuracy compared to T2WI alone (98). In an analogous, more recent study at 3T by Turkbey et al. (21), T2WI alone was compared to other modalities (DCE and MRS imaging) individually and to a combination of all three parameters. Sensitivities were generally highest with T2WI while specificities were higher with DCE and MRS imaging. The study also demonstrated significant and additive improvement in the predictive values for prostate cancer detection in the PZ when different combinations of the modalities were combined, with the highest predictive value (80%, p < 0.05) found using a combination of all three parameters. Similarly, Kitajima et al. (26) reported a significant increase in the performance characteristics of prostate cancer detection for both T2WI+DWI and T2WI+DWI+DCE imaging as compared to T2WI alone. Also, for PZ prostate cancer detection, Delongchamps et al. (99) found that T2WI+DWI, T2WI+DCE imaging, and all three parameters combined (T2W+DW+DCE) were significantly more accurate than T2WI alone. However, T2WI+DWI was significantly greater in accuracy than T2WI+DCE imaging and all three parameters combined.
In the best-performing study of multiparametric MRI of the prostate to date, Turkbey et al. (100), which included T2W, DW, DCE, and MRS imaging, reported positive predictive values (PPVs) for multiparametric MRI's detection of prostate cancer in the overall prostate, PZ, and CG to be 98%, 98%, and 100%, respectively. Several conclusions were drawn, among them that pathologic correlation, when carefully performed with patient-specific, image-based molds, yields highly accurate correlations with modern 3T multiparametric MRI. This suggests that 3T multiparametric MRI's current ability to detect cancer may be quite beyond what previous studies, which have been limited by both less developed MRI techniques and/or less sophisticated pathologic correlation, have previously presented. Further confirming the potential utility of multiparametric imaging, including when only D'Amico risk-stratified low-risk patients were taken into account, Delongchamps et al. (101) reported that a combination of T2WI, DWI, and DCE imaging was significantly better at PZ tumor detection than either T2WI+DWI or T2WI alone. In an older study tempering the success of the above trials, in particular those involving MRSI, a large multi-institutional study of MRSI conducted by the American College of Radiology Imaging Network (ACRIN) (60) found no incremental gain in localizing PZ prostate cancer by adding MRSI to T2WI. However, the studies were conducted on 1.5 T scanners and presumably with varying levels of expertise among the participating sites. Casciani et al. (102) had previously found a similar result regarding MRSI, although it was in a retrospective study with less-compelling pathologic correlation methodology.
Quantitative multiparametric MRI imaging has also been studied to help contribute to the largely qualitative studies previously reviewed. Mazaheri et al. (103) examined the PZ using T2WI to identify benign-appearing and suspicious ROIs to target them with DW and MRS quantitative imaging. They found significant differences in the ADC values between malignant and benign ROIs as well as significantly higher values for the (choline+creatine+polyamine)/citrate ratio, referred to as the metabolic ratio (MET), within cancer ROIs as compared to benign ROIs. In combination, the ADC and MET data led to significantly higher AUC values than MET alone, but not than ADC alone, as the difference in AUC was not statistically significant in the latter analysis. Additionally, Langer et al. (104) utilized T2WI along with quantitative T2 mapping, DWI, and DCE, allowing for the assessment of T2, ADC, and Ktrans measurements from histopathologically-confirmed tumors in the PZ and from healthy PZ ROIs. According to accuracy measurements using AUC, ADC mapping outperformed both T2 and Ktrans for differentiating PZ cancer from healthy tissue. An optimal multiparametric model was identified which combined ADC, T2, and Ktrans values, and this model significantly outperformed all individual measurements except ADC alone. Langer et al. (40), studying the relationship of these parameters to histopathology, found that in the PZ, the parameter measurements ADC, T2, Ktrans, and ve significantly differed between normal tissue and prostate cancer and had significant correlations to specific histologic components. Gibbs et al. (25) noted that ADC and T2 values are significantly negatively correlated with cell density in the PZ, which can potentially serve as an analysis of the aggressiveness of a tumor given a correlation between Gleason score and cell density.
While most of the above studies focused on PZ tumors, Oto et al. (83), cited earlier in the DWI section, studied CG tumors and also had DCE quantitative analyses in the study. The Ktrans parameters extracted from the DCE analyses were found to not significantly improve upon AUC compared to ADC alone for differentiating CG carcinoma from benign hyperplasia. In spite of the numerous studies above displaying the value of quantitative multiparametric imaging, complicating the assessment of its value is Langer et al.'s (41) study. This concluded that sparse prostate tumors have ADC and T2 values resembling those in normal PZ tissue, potentially limiting the ability of MRI to detect smaller, microscopic foci of prostate cancer using these methods. Many investigators in oncology now describe two forms of prostate cancer – those that are clinically significant or not – based upon tumor volume. If the volume is > 0.5 mL, then it is felt to be clinically significant. This classification should be considered for future studies.
Utilizing one or several quantitative parameters to measure the aggressiveness of any given prostate cancer lesion remains a promising goal, and a number of investigations noted above have shown that, to some degree, this may indeed be possible. Using these measurements to help characterize a patient's disease would be quite helpful for assisting with critical patient management decisions, such as selecting active surveillance (AS) (105) compared to the many more aggressive options currently available.
Future Work
We have focused our attention in this work to a review of the techniques currently in use for prostate cancer MR examinations. There are a number of ongoing technical developments in the field which may have an impact on these studies in the future. They include the development of ultra-high field (e.g. 7 T) systems for potentially higher spatial and spectral resolution (87-89), diffusion tensor imaging (DTI) (90-95), and multi-b-factor approaches to access multi-component diffusion information regarding either very fast pseudo-diffusion components from perfusion at low b-factors (< 200 s/mm2) and very slow diffusion components observed at very high b-factors above 2500 s/mm2 (44,45, 90-100). Advanced spectroscopic methods under development include multi-dimensional sequences which highlight correlations between coupled spins to improve detection and quantitation of overlapping resonances in 1D spectra. Advances are being made with hyperpolarized 13C imaging which holds the potential for direct observation and measurement of dynamics within the biochemical pathways in normal and abnormal prostate metabolism (101). Finally, a technique called MR elastography that combines ultrasound and MRI to make measures of the “stiffness” of prostate tissues has been demonstrated (106,107). There are multiple technical challenges to overcome with each of these techniques, a discussion beyond the scope of the present work. However, within the next few years, their potential to contribute to clinical prostate cancer MR examinations will undoubtedly be tested.
Conclusions
The technical hardware and software employed for multiparametric MRI studies of prostate cancer continue to improve and provide new areas to enhance the clinical information that MRI is able to provide. Although in the past this information was largely qualitative, morphologic data, the emergence of quantitative image analyses utilizing multiple pulse sequences allows for many possible combinations of data to be used to evaluate prostate cancer. With continued evaluation of these data sets in combination for their performance, an optimized and standardized image acquisition, interpretation, and reporting protocol will be able to be established. Future additions of multiparametric MRI of the prostate may include DTI, multi-component diffusion analysis, MR elastography, or new spectroscopic methods, but these are still currently in pre-clinical investigation.
Acknowledgments
We would like to acknowledge Harvard Medical School for its research fellowship support of one of the authors (J.V.H.). We would also like to thank Louise Greenberg, Aida Faria, and our technologists for their dedication to our patients and our clinical research program.
Grant Support: R01CA109246, P41EB015898, P41RR019703, U01CA151261, R01CA111288, P01CA067165, and R01CA160902
References
- 1.Prasad SM, Gu X, Lipsitz SR, Nguyen PL, Hu JC. Inappropriate utilization of radiographic imaging in men with newly diagnosed prostate cancer in the United States. Cancer. 2011;118(5):1260–1270. doi: 10.1002/cncr.26416. [DOI] [PubMed] [Google Scholar]
- 2.Poon PY, McCallum RW, Henkelman MM, et al. Magnetic resonance imaging of the prostate. Radiology. 1985;154(1):143–149. doi: 10.1148/radiology.154.1.2578070. [DOI] [PubMed] [Google Scholar]
- 3.Hricak H, Dooms GC, Jeffrey RB, et al. Prostatic carcinoma: staging by clinical assessment, CT, and MR imaging. Radiology. 1987;162(2):331–336. doi: 10.1148/radiology.162.2.3797645. [DOI] [PubMed] [Google Scholar]
- 4.Martin JF, Hajek P, Baker L, Gylys-Morin V, Fitzmorris-Glass R, Mattrey RR. Inflatable surface coil for MR imaging of the prostate. Radiology. 1988;167(1):268–270. doi: 10.1148/radiology.167.1.3347731. [DOI] [PubMed] [Google Scholar]
- 5.Schnall MD, Lenkinski RE, Pollack HM, Imai Y, Kressel HY. Prostate: MR imaging with an endorectal surface coil. Radiology. 1989;172(2):570–574. doi: 10.1148/radiology.172.2.2748842. [DOI] [PubMed] [Google Scholar]
- 6.Tempany CM, Rahmouni AD, Epstein JI, Walsh PC, Zerhouni EA. Invasion of the neurovascular bundle by prostate cancer: evaluation with MR imaging. Radiology. 1991;181(1):107–112. doi: 10.1148/radiology.181.1.1887017. [DOI] [PubMed] [Google Scholar]
- 7.Melki PS, Mulkern RV, Panych LP, Jolesz FA. Comparing the FAISE method with conventional dual-echo sequences. J Magn Reson Imaging. 1991;1(3):319–326. doi: 10.1002/jmri.1880010310. [DOI] [PubMed] [Google Scholar]
- 8.Tempany CM, Zhou X, Zerhouni EA, et al. Staging of prostate cancer: results of Radiology Diagnostic Oncology Group project comparison of three MR imaging techniques. Radiology. 1994;192(1):47–54. doi: 10.1148/radiology.192.1.8208963. [DOI] [PubMed] [Google Scholar]
- 9.Hricak H, Choyke PL, Eberhardt SC, Leibel SA, Scardino PT. Imaging prostate cancer: a multidisciplinary perspective. Radiology. 2007;243(1):28–53. doi: 10.1148/radiol.2431030580. [DOI] [PubMed] [Google Scholar]
- 10.Hambrock T, Somford DM, Huisman HJ, et al. Relationship between apparent diffusion coefficients at 3.0-T MR imaging and Gleason grade in peripheral zone prostate cancer. Radiology. 2011;259(2):453–461. doi: 10.1148/radiol.11091409. [DOI] [PubMed] [Google Scholar]
- 11.Zakian KL, Sircar K, Hricak H, et al. Correlation of proton MR spectroscopic imaging with gleason score based on step-section pathologic analysis after radical prostatectomy. Radiology. 2005;234(3):804–814. doi: 10.1148/radiol.2343040363. [DOI] [PubMed] [Google Scholar]
- 12.Hoeks CM, Barentsz JO, Hambrock T, et al. Prostate cancer: multiparametric MR imaging for detection, localization, and staging. Radiology. 2011;261(1):46–66. doi: 10.1148/radiol.11091822. [DOI] [PubMed] [Google Scholar]
- 13.Mazaheri Y, Shukla-Dave A, Muellner A, Hricak H. MR imaging of the prostate in clinical practice. MAGMA. 2008;21(6):379–392. doi: 10.1007/s10334-008-0138-y. [DOI] [PubMed] [Google Scholar]
- 14.Masterson TA, Touijer K. The role of endorectal coil MRI in preoperative staging and decision-making for the treatment of clinically localized prostate cancer. MAGMA. 2008;21(6):371–377. doi: 10.1007/s10334-008-0116-4. [DOI] [PubMed] [Google Scholar]
- 15.Umbehr M, Bachmann LM, Held U, et al. Combined magnetic resonance imaging and magnetic resonance spectroscopy imaging in the diagnosis of prostate cancer: a systematic review and meta-analysis. Eur Urol. 2009;55(3):575–590. doi: 10.1016/j.eururo.2008.10.019. [DOI] [PMC free article] [PubMed] [Google Scholar]
- 16.Rouviere O, Hartman RP, Lyonnet D. Prostate MR imaging at high-field strength: evolution or revolution? Eur Radiol. 2006;16(2):276–284. doi: 10.1007/s00330-005-2893-8. [DOI] [PubMed] [Google Scholar]
- 17.Hricak H, White S, Vigneron D, et al. Carcinoma of the prostate gland: MR imaging with pelvic phased-array coils versus integrated endorectal--pelvic phased-array coils. Radiology. 1994;193(3):703–709. doi: 10.1148/radiology.193.3.7972810. [DOI] [PubMed] [Google Scholar]
- 18.Heijmink SW, Futterer JJ, Hambrock T, et al. Prostate cancer: body-array versus endorectal coil MR imaging at 3 T--comparison of image quality, localization, and staging performance. Radiology. 2007;244(1):184–195. doi: 10.1148/radiol.2441060425. [DOI] [PubMed] [Google Scholar]
- 19.Noworolski SM, Crane JC, Vigneron DB, Kurhanewicz J. A clinical comparison of rigid and inflatable endorectal-coil probes for MRI and 3D MR spectroscopic imaging (MRSI) of the prostate. J Magn Reson Imaging. 2008;27(5):1077–1082. doi: 10.1002/jmri.21331. [DOI] [PMC free article] [PubMed] [Google Scholar]
- 20.Prando A, Kurhanewicz J, Borges AP, Oliveira EM, Jr, Figueiredo E. Prostatic biopsy directed with endorectal MR spectroscopic imaging findings in patients with elevated prostate specific antigen levels and prior negative biopsy findings: early experience. Radiology. 2005;236(3):903–910. doi: 10.1148/radiol.2363040615. [DOI] [PubMed] [Google Scholar]
- 21.Turkbey B, Pinto PA, Mani H, et al. Prostate cancer: value of multiparametric MR imaging at 3 T for detection--histopathologic correlation. Radiology. 2010;255(1):89–99. doi: 10.1148/radiol.09090475. [DOI] [PMC free article] [PubMed] [Google Scholar]
- 22.Rosen Y, Bloch BN, Lenkinski RE, Greenman RL, Marquis RP, Rofsky NM. 3T MR of the prostate: reducing susceptibility gradients by inflating the endorectal coil with a barium sulfate suspension. Magn Reson Med. 2007;57(5):898–904. doi: 10.1002/mrm.21166. [DOI] [PubMed] [Google Scholar]
- 23.Zelhof B, Lowry M, Rodrigues G, Kraus S, Turnbull L. Description of magnetic resonance imaging-derived enhancement variables in pathologically confirmed prostate cancer and normal peripheral zone regions. BJU Int. 2009;104(5):621–627. doi: 10.1111/j.1464-410X.2009.08457.x. [DOI] [PubMed] [Google Scholar]
- 24.Scheenen TW, Heijmink SW, Roell SA, et al. Three-dimensional proton MR spectroscopy of human prostate at 3 T without endorectal coil: feasibility. Radiology. 2007;245(2):507–516. doi: 10.1148/radiol.2451061444. [DOI] [PubMed] [Google Scholar]
- 25.Gibbs P, Liney GP, Pickles MD, Zelhof B, Rodrigues G, Turnbull LW. Correlation of ADC and T2 measurements with cell density in prostate cancer at 3.0 Tesla. Invest Radiol. 2009;44(9):572–576. doi: 10.1097/RLI.0b013e3181b4c10e. [DOI] [PubMed] [Google Scholar]
- 26.Kitajima K, Kaji Y, Fukabori Y, Yoshida K, Suganuma N, Sugimura K. Prostate cancer detection with 3 T MRI: comparison of diffusion-weighted imaging and dynamic contrast-enhanced MRI in combination with T2-weighted imaging. J Magn Reson Imaging. 2010;31(3):625–631. doi: 10.1002/jmri.22075. [DOI] [PubMed] [Google Scholar]
- 27.Miao H, Fukatsu H, Ishigaki T. Prostate cancer detection with 3-T MRI: comparison of diffusion-weighted and T2-weighted imaging. Eur J Radiol. 2007;61(2):297–302. doi: 10.1016/j.ejrad.2006.10.002. [DOI] [PubMed] [Google Scholar]
- 28.Kim CK, Park BK, Kim B. High-b-value diffusion-weighted imaging at 3 T to detect prostate cancer: comparisons between b values of 1,000 and 2,000 s/mm2. AJR Am J Roentgenol. 2010;194(1):W33–37. doi: 10.2214/AJR.09.3004. [DOI] [PubMed] [Google Scholar]
- 29.Metens T, Miranda D, Absil J, Matos C. What is the optimal b value in diffusion-weighted MR imaging to depict prostate cancer at 3T? Eur Radiol. 2012;22(3):703–709. doi: 10.1007/s00330-011-2298-9. [DOI] [PubMed] [Google Scholar]
- 30.Yakar D, Heijmink SW, Hulsbergen-van de Kaa CA, et al. Initial results of 3-dimensional 1H-magnetic resonance spectroscopic imaging in the localization of prostate cancer at 3 Tesla: should we use an endorectal coil? Invest Radiol. 2011;46(5):301–306. doi: 10.1097/RLI.0b013e3182007503. [DOI] [PubMed] [Google Scholar]
- 31.Dickinson L, Ahmed HU, Allen C, et al. Magnetic resonance imaging for the detection, localisation, and characterisation of prostate cancer: recommendations from a European consensus meeting. Eur Urol. 2011;59(4):477–494. doi: 10.1016/j.eururo.2010.12.009. [DOI] [PubMed] [Google Scholar]
- 32.Wang J, Qiu M, Yang QX, Smith MB, Constable RT. Measurement and correction of transmitter and receiver induced nonuniformities in vivo. Magn Reson Med. 2005;53(2):408–417. doi: 10.1002/mrm.20354. [DOI] [PubMed] [Google Scholar]
- 33.Wicks DA, Barker GJ, Tofts PS. Correction of intensity nonuniformity in MR images of any orientation. Magn Reson Imaging. 1993;11(2):183–196. doi: 10.1016/0730-725x(93)90023-7. [DOI] [PubMed] [Google Scholar]
- 34.Fan A, Wells WM, Fisher JW, et al. A unified variational approach to denoising and bias correction in MR. Inf Process Med Imaging. 2003;18:148–159. doi: 10.1007/978-3-540-45087-0_13. [DOI] [PubMed] [Google Scholar]
- 35.Tustison NJ, Avants BB, Cook PA, et al. N4ITK: improved N3 bias correction. IEEE Trans Med Imaging. 2010;29(6):1310–1320. doi: 10.1109/TMI.2010.2046908. [DOI] [PMC free article] [PubMed] [Google Scholar]
- 36.White S, Hricak H, Forstner R, et al. Prostate cancer: effect of postbiopsy hemorrhage on interpretation of MR images. Radiology. 1995;195(2):385–390. doi: 10.1148/radiology.195.2.7724756. [DOI] [PubMed] [Google Scholar]
- 37.Turner R, Le Bihan D, Chesnick AS. Echo-planar imaging of diffusion and perfusion. Magn Reson Med. 1991;19(2):247–253. doi: 10.1002/mrm.1910190210. [DOI] [PubMed] [Google Scholar]
- 38.Padhani AR. Integrating multiparametric prostate MRI into clinical practice. Cancer Imaging. 2011;11 Spec No A:S27–37. doi: 10.1102/1470-7330.2011.9007. [DOI] [PMC free article] [PubMed] [Google Scholar]
- 39.Burdette JH, Elster AD, Ricci PE. Acute cerebral infarction: quantification of spin-density and T2 shine-through phenomena on diffusion-weighted MR images. Radiology. 1999;212(2):333–339. doi: 10.1148/radiology.212.2.r99au36333. [DOI] [PubMed] [Google Scholar]
- 40.Langer DL, van der Kwast TH, Evans AJ, et al. Prostate tissue composition and MR measurements: investigating the relationships between ADC, T2, K(trans), v(e), and corresponding histologic features. Radiology. 2010;255(2):485–494. doi: 10.1148/radiol.10091343. [DOI] [PubMed] [Google Scholar]
- 41.Langer DL, van der Kwast TH, Evans AJ, et al. Intermixed normal tissue within prostate cancer: effect on MR imaging measurements of apparent diffusion coefficient and T2--sparse versus dense cancers. Radiology. 2008;249(3):900–908. doi: 10.1148/radiol.2493080236. [DOI] [PubMed] [Google Scholar]
- 42.Bourne R, Kurniawan N, Cowin G, Sved P, Watson G. 16 T diffusion microimaging of fixed prostate tissue: preliminary findings. Magn Reson Med. 2011;66(1):244–247. doi: 10.1002/mrm.22778. [DOI] [PubMed] [Google Scholar]
- 43.Mulkern RV, Barnes AS, Haker SJ, et al. Biexponential characterization of prostate tissue water diffusion decay curves over an extended b-factor range. Magn Reson Imaging. 2006;24(5):563–568. doi: 10.1016/j.mri.2005.12.008. [DOI] [PMC free article] [PubMed] [Google Scholar]
- 44.Storas TH, Gjesdal KI, Gadmar OB, Geitung JT, Klow NE. Prostate magnetic resonance imaging: multiexponential T2 decay in prostate tissue. J Magn Reson Imaging. 2008;28(5):1166–1172. doi: 10.1002/jmri.21534. [DOI] [PubMed] [Google Scholar]
- 45.Roebuck JR, Haker SJ, Mitsouras D, Rybicki FJ, Tempany CM, Mulkern RV. Carr-Purcell-Meiboom-Gill imaging of prostate cancer: quantitative T2 values for cancer discrimination. Magn Reson Imaging. 2009;27(4):497–502. doi: 10.1016/j.mri.2008.08.001. [DOI] [PMC free article] [PubMed] [Google Scholar]
- 46.Liney GP, Knowles AJ, Manton DJ, Turnbull LW, Blackband SJ, Horsman A. Comparison of conventional single echo and multi-echo sequences with a fast spin-echo sequence for quantitative T2 mapping: application to the prostate. J Magn Reson Imaging. 1996;6(4):603–607. doi: 10.1002/jmri.1880060408. [DOI] [PubMed] [Google Scholar]
- 47.Gibbs P, Tozer DJ, Liney GP, Turnbull LW. Comparison of quantitative T2 mapping and diffusion-weighted imaging in the normal and pathologic prostate. Magn Reson Med. 2001;46(6):1054–1058. doi: 10.1002/mrm.1298. [DOI] [PubMed] [Google Scholar]
- 48.Chan I, Wells W, 3rd, Mulkern RV, et al. Detection of prostate cancer by integration of line-scan diffusion, T2-mapping and T2-weighted magnetic resonance imaging; a multichannel statistical classifier. Med Phys. 2003;30(9):2390–2398. doi: 10.1118/1.1593633. [DOI] [PubMed] [Google Scholar]
- 49.Issa B. In vivo measurement of the apparent diffusion coefficient in normal and malignant prostatic tissues using echo-planar imaging. J Magn Reson Imaging. 2002;16(2):196–200. doi: 10.1002/jmri.10139. [DOI] [PubMed] [Google Scholar]
- 50.Yoshizako T, Wada A, Uchida K, et al. Apparent diffusion coefficient of line scan diffusion image in normal prostate and prostate cancer--comparison with single-shot echo planner image. Magn Reson Imaging. 2011;29(1):106–110. doi: 10.1016/j.mri.2010.07.013. [DOI] [PubMed] [Google Scholar]
- 51.Wang XZ, Wang B, Gao ZQ, et al. Diffusion-weighted imaging of prostate cancer: correlation between apparent diffusion coefficient values and tumor proliferation. J Magn Reson Imaging. 2009;29(6):1360–1366. doi: 10.1002/jmri.21797. [DOI] [PubMed] [Google Scholar]
- 52.Shukla-Dave A, Hricak H, Eberhardt SC, et al. Chronic prostatitis: MR imaging and 1H MR spectroscopic imaging findings--initial observations. Radiology. 2004;231(3):717–724. doi: 10.1148/radiol.2313031391. [DOI] [PubMed] [Google Scholar]
- 53.Tamada T, Sone T, Toshimitsu S, et al. Age-related and zonal anatomical changes of apparent diffusion coefficient values in normal human prostatic tissues. J Magn Reson Imaging. 2008;27(3):552–556. doi: 10.1002/jmri.21117. [DOI] [PubMed] [Google Scholar]
- 54.Tofts PS, Brix G, Buckley DL, et al. Estimating kinetic parameters from dynamic contrast-enhanced T(1)-weighted MRI of a diffusable tracer: standardized quantities and symbols. J Magn Reson Imaging. 1999;10(3):223–232. doi: 10.1002/(sici)1522-2586(199909)10:3<223::aid-jmri2>3.0.co;2-s. [DOI] [PubMed] [Google Scholar]
- 55.Sourbron SP, Buckley DL. On the scope and interpretation of the Tofts models for DCE-MRI. Magn Reson Med. 2011;66(3):735–745. doi: 10.1002/mrm.22861. [DOI] [PubMed] [Google Scholar]
- 56.Tofts PS, Berkowitz B, Schnall MD. Quantitative analysis of dynamic Gd-DTPA enhancement in breast tumors using a permeability model. Magn Reson Med. 1995;33(4):564–568. doi: 10.1002/mrm.1910330416. [DOI] [PubMed] [Google Scholar]
- 57.Parker GJ, Roberts C, Macdonald A, et al. Experimentally-derived functional form for a population-averaged high-temporal-resolution arterial input function for dynamic contrast-enhanced MRI. Magn Reson Med. 2006;56(5):993–1000. doi: 10.1002/mrm.21066. [DOI] [PubMed] [Google Scholar]
- 58.Meng R, Chang SD, Jones EC, Goldenberg SL, Kozlowski P. Comparison between population average and experimentally measured arterial input function in predicting biopsy results in prostate cancer. Acad Radiol. 2010;17(4):520–525. doi: 10.1016/j.acra.2009.11.006. [DOI] [PMC free article] [PubMed] [Google Scholar]
- 59.Bottomley PA. Spatial localization in NMR spectroscopy in vivo. Ann N Y Acad Sci. 1987;508:333–348. doi: 10.1111/j.1749-6632.1987.tb32915.x. [DOI] [PubMed] [Google Scholar]
- 60.Weinreb JC, Blume JD, Coakley FV, et al. Prostate cancer: sextant localization at MR imaging and MR spectroscopic imaging before prostatectomy--results of ACRIN prospective multi-institutional clinicopathologic study. Radiology. 2009;251(1):122–133. doi: 10.1148/radiol.2511080409. [DOI] [PMC free article] [PubMed] [Google Scholar]
- 61.Scheenen TW, Klomp DW, Roll SA, Futterer JJ, Barentsz JO, Heerschap A. Fast acquisition-weighted three-dimensional proton MR spectroscopic imaging of the human prostate. Magn Reson Med. 2004;52(1):80–88. doi: 10.1002/mrm.20103. [DOI] [PubMed] [Google Scholar]
- 62.Mulkern RV, Panych LP. Echo planar spectroscopic imaging. Concepts in Magnetic Resonance. 2001;13(4):213–237. [Google Scholar]
- 63.Chen AP, Cunningham CH, Ozturk-Isik E, et al. High-speed 3T MR spectroscopic imaging of prostate with flyback echo-planar encoding. J Magn Reson Imaging. 2007;25(6):1288–1292. doi: 10.1002/jmri.20916. [DOI] [PubMed] [Google Scholar]
- 64.Pruessmann KP, Weiger M, Scheidegger MB, Boesiger P. SENSE: sensitivity encoding for fast MRI. Magn Reson Med. 1999;42(5):952–962. [PubMed] [Google Scholar]
- 65.Kyriakos WE, Panych LP, Kacher DF, et al. Sensitivity profiles from an array of coils for encoding and reconstruction in parallel (SPACE RIP) Magn Reson Med. 2000;44(2):301–308. doi: 10.1002/1522-2594(200008)44:2<301::aid-mrm18>3.0.co;2-d. [DOI] [PubMed] [Google Scholar]
- 66.Sodickson DK. Tailored SMASH image reconstructions for robust in vivo parallel MR imaging. Magn Reson Med. 2000;44(2):243–251. doi: 10.1002/1522-2594(200008)44:2<243::aid-mrm11>3.0.co;2-l. [DOI] [PubMed] [Google Scholar]
- 67.Kurhanewicz J, Swanson MG, Nelson SJ, Vigneron DB. Combined magnetic resonance imaging and spectroscopic imaging approach to molecular imaging of prostate cancer. J Magn Reson Imaging. 2002;16(4):451–463. doi: 10.1002/jmri.10172. [DOI] [PMC free article] [PubMed] [Google Scholar]
- 68.Mulkern R, Bowers J. Density matrix calculations of AB spectra from multipulse sequences: Quantum mechanics meets In vivo spectroscopy. Concepts in Magnetic Resonance. 1994;6(1):1–23. [Google Scholar]
- 69.Scheenen TWJ, Gambarota G, Weiland E, et al. Optimal timing for in vivo 1H-MR spectroscopic imaging of the human prostate at 3T. Magnetic Resonance in Medicine. 2005;53(6):1268–1274. doi: 10.1002/mrm.20468. [DOI] [PubMed] [Google Scholar]
- 70.Kurhanewicz J, Vigneron DB, Hricak H, Narayan P, Carroll P, Nelson SJ. Three-dimensional H-1 MR spectroscopic imaging of the in situ human prostate with high (0.24-07-cm3) spatial resolution. Radiology. 1996;198(3):795–805. doi: 10.1148/radiology.198.3.8628874. [DOI] [PubMed] [Google Scholar]
- 71.Kim JK, Kim DY, Lee YH, et al. In vivo differential diagnosis of prostate cancer and benign prostatic hyperplasia: localized proton magnetic resonance spectroscopy using external-body surface coil. Magn Reson Imaging. 1998;16(10):1281–1288. doi: 10.1016/s0730-725x(98)00110-6. [DOI] [PubMed] [Google Scholar]
- 72.Scheidler J, Hricak H, Vigneron DB, et al. Prostate cancer: localization with three-dimensional proton MR spectroscopic imaging--clinicopathologic study. Radiology. 1999;213(2):473–480. doi: 10.1148/radiology.213.2.r99nv23473. [DOI] [PubMed] [Google Scholar]
- 73.Garcia-Segura JM, Sanchez-Chapado M, Ibarburen C, et al. In vivo proton magnetic resonance spectroscopy of diseased prostate: spectroscopic features of malignant versus benign pathology. Magn Reson Imaging. 1999;17(5):755–765. doi: 10.1016/s0730-725x(99)00006-5. [DOI] [PubMed] [Google Scholar]
- 74.Jung JA, Coakley FV, Vigneron DB, et al. Prostate depiction at endorectal MR spectroscopic imaging: investigation of a standardized evaluation system. Radiology. 2004;233(3):701–708. doi: 10.1148/radiol.2333030672. [DOI] [PubMed] [Google Scholar]
- 75.Shukla-Dave A, Hricak H, Moskowitz C, et al. Detection of prostate cancer with MR spectroscopic imaging: an expanded paradigm incorporating polyamines. Radiology. 2007;245(2):499–506. doi: 10.1148/radiol.2452062201. [DOI] [PubMed] [Google Scholar]
- 76.Thomas MA, Lange T, Velan SS, et al. Two-dimensional MR spectroscopy of healthy and cancerous prostates in vivo. MAGMA. 2008;21(6):443–458. doi: 10.1007/s10334-008-0121-7. [DOI] [PubMed] [Google Scholar]
- 77.Kumar V, Jagannathan NR, Kumar R, et al. Apparent diffusion coefficient of the prostate in men prior to biopsy: determination of a cut-off value to predict malignancy of the peripheral zone. NMR Biomed. 2007;20(5):505–511. doi: 10.1002/nbm.1114. [DOI] [PubMed] [Google Scholar]
- 78.Poon CS, Henkelman RM. Practical T2 quantitation for clinical applications. J Magn Reson Imaging. 1992;2(5):541–553. doi: 10.1002/jmri.1880020512. [DOI] [PubMed] [Google Scholar]
- 79.Westphalen AC, Reed GD, Vinh PP, Sotto C, Vigneron DB, Kurhanewicz J. Multiparametric 3T endorectal mri after external beam radiation therapy for prostate cancer. J Magn Reson Imaging. 2012 doi: 10.1002/jmri.23672. [DOI] [PMC free article] [PubMed] [Google Scholar]
- 80.Ung JO, Richie JP, Chen MH, Renshaw AA, D'Amico AV. Evolution of the presentation and pathologic and biochemical outcomes after radical prostatectomy for patients with clinically localized prostate cancer diagnosed during the PSA era. Urology. 2002;60(3):458–463. doi: 10.1016/s0090-4295(02)01814-9. [DOI] [PubMed] [Google Scholar]
- 81.Wang L, Mazaheri Y, Zhang J, Ishill NM, Kuroiwa K, Hricak H. Assessment of biologic aggressiveness of prostate cancer: correlation of MR signal intensity with Gleason grade after radical prostatectomy. Radiology. 2008;246(1):168–176. doi: 10.1148/radiol.2461070057. [DOI] [PubMed] [Google Scholar]
- 82.Liney GP, Turnbull LW, Lowry M, Turnbull LS, Knowles AJ, Horsman A. In vivo quantification of citrate concentration and water T2 relaxation time of the pathologic prostate gland using 1H MRS and MRI. Magn Reson Imaging. 1997;15(10):1177–1186. doi: 10.1016/s0730-725x(97)00182-3. [DOI] [PubMed] [Google Scholar]
- 83.Oto A, Kayhan A, Jiang Y, et al. Prostate cancer: differentiation of central gland cancer from benign prostatic hyperplasia by using diffusion-weighted and dynamic contrast-enhanced MR imaging. Radiology. 2010;257(3):715–723. doi: 10.1148/radiol.10100021. [DOI] [PMC free article] [PubMed] [Google Scholar]
- 84.Turkbey B, Shah VP, Pang Y, et al. Is apparent diffusion coefficient associated with clinical risk scores for prostate cancers that are visible on 3-T MR images? Radiology. 2011;258(2):488–495. doi: 10.1148/radiol.10100667. [DOI] [PMC free article] [PubMed] [Google Scholar]
- 85.Zelhof B, Pickles M, Liney G, et al. Correlation of diffusion-weighted magnetic resonance data with cellularity in prostate cancer. BJU Int. 2009;103(7):883–888. doi: 10.1111/j.1464-410X.2008.08130.x. [DOI] [PubMed] [Google Scholar]
- 86.Ocak I, Bernardo M, Metzger G, et al. Dynamic contrast-enhanced MRI of prostate cancer at 3 T: a study of pharmacokinetic parameters. AJR Am J Roentgenol. 2007;189(4):849. doi: 10.2214/AJR.06.1329. [DOI] [PubMed] [Google Scholar]
- 87.Girouin N, Mege-Lechevallier F, Tonina Senes A, et al. Prostate dynamic contrast-enhanced MRI with simple visual diagnostic criteria: is it reasonable? Eur Radiol. 2007;17(6):1498–1509. doi: 10.1007/s00330-006-0478-9. [DOI] [PubMed] [Google Scholar]
- 88.Scherr MK, Seitz M, Muller-Lisse UG, Ingrisch M, Reiser MF, Muller-Lisse UL. MR-perfusion (MRP) and diffusion-weighted imaging (DWI) in prostate cancer: quantitative and model-based gadobenate dimeglumine MRP parameters in detection of prostate cancer. Eur J Radiol. 2010;76(3):359–366. doi: 10.1016/j.ejrad.2010.04.023. [DOI] [PubMed] [Google Scholar]
- 89.Franiel T, Ludemann L, Rudolph B, et al. Prostate MR imaging: tissue characterization with pharmacokinetic volume and blood flow parameters and correlation with histologic parameters. Radiology. 2009;252(1):101–108. doi: 10.1148/radiol.2521081400. [DOI] [PubMed] [Google Scholar]
- 90.Franiel T, Ludemann L, Rudolph B, Lutterbeck E, Hamm B, Beyersdorff D. Differentiation of prostate cancer from normal prostate tissue: role of hotspots in pharmacokinetic MRI and histologic evaluation. AJR Am J Roentgenol. 2010;194(3):675–681. doi: 10.2214/AJR.09.3233. [DOI] [PubMed] [Google Scholar]
- 91.Giusti S, Caramella D, Fruzzetti E, Lazzereschi M, Tognetti A, Bartolozzi C. Peripheral zone prostate cancer. Pre-treatment evaluation with MR and 3D (1)H MR spectroscopic imaging: correlation with pathologic findings. Abdom Imaging. 2010;35(6):757–763. doi: 10.1007/s00261-009-9577-9. [DOI] [PubMed] [Google Scholar]
- 92.Scheenen TW, Futterer J, Weiland E, et al. Discriminating cancer from noncancer tissue in the prostate by 3-dimensional proton magnetic resonance spectroscopic imaging: a prospective multicenter validation study. Invest Radiol. 2011;46(1):25–33. doi: 10.1097/rli.0b013e3181f54081. [DOI] [PubMed] [Google Scholar]
- 93.Kobus T, Hambrock T, Hulsbergen-van de Kaa CA, et al. In vivo assessment of prostate cancer aggressiveness using magnetic resonance spectroscopic imaging at 3 T with an endorectal coil. Eur Urol. 2011;60(5):1074–1080. doi: 10.1016/j.eururo.2011.03.002. [DOI] [PubMed] [Google Scholar]
- 94.Haider MA, van der Kwast TH, Tanguay J, et al. Combined T2-weighted and diffusion-weighted MRI for localization of prostate cancer. AJR Am J Roentgenol. 2007;189(2):323–328. doi: 10.2214/AJR.07.2211. [DOI] [PubMed] [Google Scholar]
- 95.Lim HK, Kim JK, Kim KA, Cho KS. Prostate cancer: apparent diffusion coefficient map with T2-weighted images for detection--a multireader study. Radiology. 2009;250(1):145–151. doi: 10.1148/radiol.2501080207. [DOI] [PubMed] [Google Scholar]
- 96.Mazaheri Y, Hricak H, Fine SW, et al. Prostate tumor volume measurement with combined T2-weighted imaging and diffusion-weighted MR: correlation with pathologic tumor volume. Radiology. 2009;252(2):449–457. doi: 10.1148/radiol.2523081423. [DOI] [PMC free article] [PubMed] [Google Scholar]
- 97.Vargas HA, Akin O, Franiel T, et al. Diffusion-weighted endorectal MR imaging at 3 T for prostate cancer: tumor detection and assessment of aggressiveness. Radiology. 2011;259(3):775–784. doi: 10.1148/radiol.11102066. [DOI] [PMC free article] [PubMed] [Google Scholar]
- 98.Futterer JJ, Heijmink SW, Scheenen TW, et al. Prostate cancer localization with dynamic contrast-enhanced MR imaging and proton MR spectroscopic imaging. Radiology. 2006;241(2):449–458. doi: 10.1148/radiol.2412051866. [DOI] [PubMed] [Google Scholar]
- 99.Delongchamps NB, Rouanne M, Flam T, et al. Multiparametric magnetic resonance imaging for the detection and localization of prostate cancer: combination of T2-weighted, dynamic contrast-enhanced and diffusion-weighted imaging. BJU Int. 2011;107(9):1411–1418. doi: 10.1111/j.1464-410X.2010.09808.x. [DOI] [PubMed] [Google Scholar]
- 100.Turkbey B, Mani H, Shah V, et al. Multiparametric 3T prostate magnetic resonance imaging to detect cancer: histopathological correlation using prostatectomy specimens processed in customized magnetic resonance imaging based molds. J Urol. 2011;186(5):1818–1824. doi: 10.1016/j.juro.2011.07.013. [DOI] [PMC free article] [PubMed] [Google Scholar]
- 101.Delongchamps NB, Beuvon F, Eiss D, et al. Multiparametric MRI is helpful to predict tumor focality, stage, and size in patients diagnosed with unilateral low-risk prostate cancer. Prostate Cancer Prostatic Dis. 2011;14(3):232–237. doi: 10.1038/pcan.2011.9. [DOI] [PubMed] [Google Scholar]
- 102.Casciani E, Polettini E, Bertini L, et al. Contribution of the MR spectroscopic imaging in the diagnosis of prostate cancer in the peripheral zone. Abdom Imaging. 2007;32(6):796–802. doi: 10.1007/s00261-007-9181-9. [DOI] [PubMed] [Google Scholar]
- 103.Mazaheri Y, Shukla-Dave A, Hricak H, et al. Prostate cancer: identification with combined diffusion-weighted MR imaging and 3D 1H MR spectroscopic imaging--correlation with pathologic findings. Radiology. 2008;246(2):480–488. doi: 10.1148/radiol.2462070368. [DOI] [PubMed] [Google Scholar]
- 104.Langer DL, van der Kwast TH, Evans AJ, Trachtenberg J, Wilson BC, Haider MA. Prostate cancer detection with multi-parametric MRI: logistic regression analysis of quantitative T2, diffusion-weighted imaging, and dynamic contrast-enhanced MRI. J Magn Reson Imaging. 2009;30(2):327–334. doi: 10.1002/jmri.21824. [DOI] [PubMed] [Google Scholar]
- 105.van As NJ, de Souza NM, Riches SF, et al. A study of diffusion-weighted magnetic resonance imaging in men with untreated localised prostate cancer on active surveillance. Eur Urol. 2009;56(6):981–987. doi: 10.1016/j.eururo.2008.11.051. [DOI] [PubMed] [Google Scholar]
- 106.Arani A, Plewes D, Krieger A, Chopra R. The feasibility of endorectal MR elastography for prostate cancer localization. Magn Reson Med. 2011;66(6):1649–1657. doi: 10.1002/mrm.22967. [DOI] [PubMed] [Google Scholar]
- 107.Li S, Chen M, Wang W, et al. A feasibility study of MR elastography in the diagnosis of prostate cancer at 3.0T. Acta Radiol. 2011;52(3):354–358. doi: 10.1258/ar.2010.100276. [DOI] [PubMed] [Google Scholar]