

Abstract
Background
Attention Deficit Hyperactivity Disorder (ADHD) is a psychiatric disorder that starts in childhood. The mechanism of action of methylphenidate (MPH), the most common treatment for ADHD, is unclear. In vitro, the affinity of MPH for the norepinephrine transporter (NET) is higher than that for the dopamine transporter (DAT). The goal of this study was to use Positron Emission Tomography to measure the occupancy of NET by MPH in vivo in humans.
Methods
We used (S,S)-[11C]methylreboxetine ([11C]MRB) to determine the Effective Dose 50 (ED50) of MPH for NET. In a within-subject design, healthy subjects (n=11) received oral, single-blind placebo and 2.5 mg, 10 mg, and 40 mg of MPH 75 minutes prior to [11C]MRB injection. Dynamic PET imaging was performed for 2 hrs with the High Resolution Research Tomograph. The multilinear reference tissue model with occipital cortex as the reference region was used to estimate binding potential (BPND) in the thalamus and other NET-rich regions.
Results
BPND was reduced by MPH in a dose-dependent manner in thalamus and other NET-rich regions. The global ED50 was estimated to be 0.14 mg/kg, therefore the average clinical maintenance dose of MPH (0.35–0.55 mg/kg) produces 70–80% occupancy of NET.
Conclusions
For the first time in humans, we demonstrate that oral MPH significantly occupies NET at clinically relevant doses. The ED50 is lower than that for DAT (0.25 mg/kg), suggesting the potential relevance of NET inhibition in the therapeutic effects of MPH in ADHD.
Keywords: Attention Deficit Hyperactivity Disorder, Methylphenidate, Norepinephrine transporter, Dopamine, [11C]methylreboxetine, Positron Emission Tomography
Introduction
The core features of Attention Deficit Hyperactivity Disorder (ADHD) - inattention, hyperactivity, and impulsivity - can be attributed to dysfunction in neural systems that regulate attention, executive function, motor control, and reward (1, 2)(3). The three classes of pharmacologic treatments for ADHD - psychostimulants (e.g. methylphenidate; MPH), non-stimulant catecholamine reuptake inhibitors (e.g. atomoxetine), and α2 adrenergic receptor agonists (e.g. guanfacine) - all modulate dopamine (DA) and norepinephrine (NE) neurotransmission (1, 4). Small changes in NE or DA concentration affect networks of pyramidal cells in the prefrontal cortex (PFC) which regulates and sustains attention (5). The beneficial effects of DA occur at D1 receptors, while those of NE are believed to occur at α2 receptors (5).
The effects of MPH on the DA system have been studied extensively. Clinical doses of MPH occupy >50% of DAT in vivo in humans (6, 7), suggesting that DA reuptake inhibition, and resultant D1 receptor activation, may be an important therapeutic mechanism in ADHD (5). The potential role of NE is supported by animal and human data (8)(9) (13). Consistent with the role of NE in ADHD, MPH has higher in vitro affinity for NET than DAT (Ki = 38 nM vs. 193 nM) (10). Low doses of MPH increase levels of NE in the PFC in animals (11), and low doses of MPH improve performance of PFC tasks in subjects with ADHD (12). Previous PET studies have demonstrated the specificity of MPH’s active enantiomer (d-threo-MPH) in basal ganglia (13), and that clinical doses of MPH significantly occupy DAT (7). The absence of a suitable NET tracer has delayed similar studies of NET. The recently developed NET ligand [11C]MRB has been used in NET occupancy studies of atomoxetine in humans and non-human primates (14–16), and to investigate NET abnormalities in cocaine dependence (17). Using this ligand, the aims of this study were (1) to measure the dose-dependent blockade of [11C]MRB by MPH in the thalamus and other NET-rich regions, and (2) to estimate ED50 i.e. the dose at which 50% of NET are occupied by MPH.
Methods and Materials
Subjects
We recruited six women and five men with no current medical problems and no psychiatric history, including ADHD. Medical and psychiatric history, review of systems, the structured interview for the Diagnostic and Statistical Manual of Mental Disorders (18), and a physical exam were performed by a board-certified psychiatrist (JH). Laboratory tests and EKG were used to rule out any unknown medical condition. All subjects were stimulant-naïve, with no history of exposure to amphetamines, cocaine, Ecstasy, or MPH. Urine drug screens and pregnancy tests were negative at screening and on the morning of each scan. The study was approved by the Yale University Human Investigation Committee, and informed consent was obtained after complete description of the study to the subjects. Demographics are summarized in Table 1.
Table 1.
Radiotracer characteristics
| 0 mg | 2.5 mg | 10 mg | 40 mg | ||
| Injected dose (mCi) | 17.8±4.1 | 15.9±4.1 | 15.8±3.9 | 17±3.9 | *All p values >0.2 |
| Injected mass (nmoles) | 1.7±0.9 | 1.5±0.7 | 2±0.6 | 1.5±0.6 | All p values>0.3 |
| Free fraction | 0.13±0.03 | 0.12±0.02 | 0.12±0.02 | 0.12±0.02 | All p values >0.5 |
Pair-wise comparisons between each of the four doses all had p>0.2
Magnetic Resonance Imaging
MR imaging was performed on a 3T Trio (Siemens Medical Systems, Erlangen, Germany) with a circularly-polarized head coil. MR acquisition was a Sag 3D magnetization-prepared rapid gradient-echo (MPRAGE) sequence with 3.34 ms echo time, 2,500 ms repetition time, 1,100 ms inversion time, 7 degree flip angle, and 180 Hz/pixel bandwidth. The image dimensions were 256 × 256 × 176 and pixel size was 0.98 × 0.98 × 1.0 mm.
MPH Administration
In non-human primates MPH reaches peak concentrations in the brain by 60 minutes (7). We conducted a preliminary duration study to determine how much time it takes from oral MPH administration to maximum occupancy of brain NET. As peak displacement of [11C]MRB by MPH was achieved by 75 minutes (see Supplementary Information), we chose 75 minutes as the time between oral MPH dosing and [11C]MRB injection for the current occupancy study. Each subject had four PET scans on three different days, separated by at least one week. On the first day subjects received placebo before the morning scan, and MPH 2.5 mg before the afternoon scan. On the second and third study days they received MPH 10 mg and 40 mg, respectively. Study medication was prepared by the Yale-New Haven Hospital pharmacy and administered 76±12 minutes before each [11C]MRB injection. Subjects were only told that they would receive either placebo or MPH. Blood samples for determination of plasma levels of MPH were obtained at the beginning and end of each PET scan (~75 and ~195 minutes after MPH administration). Plasma levels of d-threo-MPH were determined with capillary gas chromatography-mass spectrometry.
PET Imaging
[11C]MRB was synthesized as described previously (19). PET images were acquired using the High Resolution Research Tomograph (HRRT; Siemens/CTI, Knoxville, TN) with a reconstructed image resolution of ~3 mm. Following a transmission scan, [11C]MRB was injected i.v. as a 1-minute bolus by an infusion pump. List-mode data were acquired for 120 minutes. Head motion correction was performed using an optical tracking tool (Vicra, NDI Systems, Waterloo, Ontario, Canada) and a rigid tool attached to a swim cap.
Arterial Input Function Measurement
Radial artery blood samples were obtained on days 1 and 3 to measure the arterial input function for the purpose of kinetic modeling (see Supplementary Information.)
Image Reconstruction and Motion Correction
Dynamic scan data were reconstructed with corrections for attenuation, normalization, scatter, randoms, deadtime, and motion using the MOLAR algorithm (20) with the following frame timing: 6 × 30 sec; 3 × 1 min; 2 × 2 min; 22 × 5 min. A second step of motion correction was performed after reconstruction, by realigning each frame to an early summed image (0–10 min post-injection) using a 6-parameter mutual information algorithm (FLIRT, FSL 3.2, Analysis Group, FMRIB, Oxford, UK).
Delineation of Regions of Interest
A summed image (0–10 min) was generated and used for co-registration to the subject’s MRI. The MRI was then co-registered to the template MRI to determine regions of interest (ROIs). Cortical regions, thalamus, basal ganglia, and hypothalamus were identified with the Automated Anatomical Labeling (AAL) template (21). Additional ROIs were delineated on the template MRI, including thalamic subnuclei, locus caeruleus (LC), pontine and midbrain raphé nuclei, and red nucleus. The volume and location of ROIs were determined based on the Talairach atlas as previously described (17).
Image Analysis
Parametric images of [11C]MRB volume of distribution (VT) and binding potential (BPND) (22) values were calculated using the multi-linear reference tissue models MA1 (23) and MRTM2 (24) (see Supplementary Information.) The occipital cortex was selected as the reference region because post-mortem studies in humans have shown that this region has lower levels of NET than the striatum (25).
Determination of ED50 for MPH
ED50 is the dose in mg/kg body weight at which 50% of brain NET are occupied. The MPH ED50 was estimated by fitting the MRTM2 BPND values as a function of the MPH dose (DMPH) using Equation 1:
| (Eq.1) |
where represents [11C]MRB MRTM2 BPND at baseline, represents [11C]MRB remaining MRTM2 BPND at saturation, and DMPH represents dose of MPH. Equation 1 allows for different levels of non-displaceable binding between regions. If [11C]MRB non-displaceable binding in the reference and target regions are the same, then would equal zero, and would equal the true BPND value for [11C]MRB. Conversely, if non-displaceable binding levels are different, then would equal the relative difference of the non displaceable volumes (VND) in the target and reference regions, as shown in Equation 2:
| (Eq.2) |
The true baseline BPND can also be computed from and as:
| (Eq.3) |
To test whether the non-displaceable binding is different between the reference region and some of the target regions, two sets of fits were performed, with or without the assumption that is equal to zero, and compared using the F test. To test whether the ED50 estimates were significantly different across regions, the total sum of squares from all regional fits was compared to the sum of squares of a coupled fit across all regions using a global ED50 estimate also using the F test. The MPH IC50, i.e. the plasma concentration at which 50% of NET are occupied, was estimated as IC50 = α × ED50, where α is the slope of the regression line linking the plasma concentration of d-threo-MPH to the dose of MPH.
Statistical Analysis
The data were first examined using descriptive statistics. In the primary analysis, repeated-measures analysis of variance (ANOVA) was used to assess the effect of MPH dose (placebo, 2.5, 10, and 40 mg) on BPND in the thalamus, which was chosen as the primary endpoint because it is the largest NET-rich region. Then, exploratory analyses were conducted for all individual ROIs. Post-hoc pair-wise analyses were performed to examine differences between individual MPH doses. A p-value <.05 was considered statistically significant.
Results
Demographic and Radiotracer Characteristics
The mean age was 34±8 years and the mean body mass index was 28±5 kg/m2. Radiotracer characteristics are summarized in Table 1. MPH was well-tolerated, and only one subject experienced transient anxiety after the 40 mg dose. The 75 and 195 minute plasma levels of the active enantiomer d-threo-MPH were 1.5±1.2 and 0.6±0.4 ng/ml (2.5 mg), 3.1±3 and 2.8±1.7 ng/ml (10 mg), and 22.9±13.9 and 15±4.4 ng/ml (40 mg.) For correlation between plasma levels of d-threo-MPH and MPH dose (mg/kg) please refer to the Supplementary Information section. The doses of MPH (in mg/kg) were used as covariates to analyze the binding of [11C]MRB.
Effect of MPH on [11C]MRB VT in Occipital Cortex
The arterial input function was measured during the placebo and 40 mg scans in nine subjects to assess the effect of MPH on the distribution volume of the reference region (occipital cortex) from MA1 (See Supplementary Information, Eq. 1). In the occipital cortex, [11C]MRB VT was 4.2±0.9 ml/cm3 at baseline and 3.8±1.0 ml/cm3 after 40 mg MPH (relative difference = −9±17%). The [11C]MRB plasma free fraction (fp) was 13±3% at baseline and 12±2% after 40 mg (relative difference = −3±15%). Consequently, the [11C]MRB normalized distribution volumes (VT/fP) in the occipital cortex were 34±5 ml/cm3 at baseline and 32±4 ml/cm3 after 40 mg. The small relative difference (−5±15%) suggests that MPH did not displace [11C]MRB binding in the occipital cortex (Fig. 1A), thus supporting its use as the reference region. As a comparison, in other NET-poor regions such as the putamen and the caudate, the VT/fP difference between baseline and 40 mg MPH was 2±16% and 4±17%, respectively.
Figure 1.

(A) In the reference region (occipital cortex), the [11C]MRB normalized distribution volumes (VT/fP) were 34±5 ml/cm3 at baseline and 32±4 ml/cm3 after 40 mg. The small relative difference (−5±15%) suggests that MPH did not displace [11C]MRB binding in the occipital cortex. (B) The BPND estimated with MA1 and MRTM2 were highly correlated: y=0.909× + 0.078, r2 = 0.821, where × represents the MA1 BPND values and y represents the MRTM2 BPND values.
Correlation Between [11C]MRB BPND Estimated with MA1 and MRTM2
The BPND estimated for all NET-rich regions with MA1 and MRTM2 were highly correlated (y=0.909× + 0.078, r2 = 0.821, where × represents the MA1 BPND values and y represents the MRTM2 BPND values) (Fig. 1B). Since MA1 values were only available for scans with arterial samples, subsequent analyses were performed with MRTM2, in order to use all the acquired scans.
Dose-Dependent Displacement of [11C]MRB by MPH
There was a dose-dependent reduction of [11C]MRB BPND by MPH in all NET-rich regions (Figs. 2 and 3). In the thalamus BPND at baseline was 0.52±0.12, and this decreased to 0.44±0.14 after 2.5 mg, to 0.34±0.08 after 10 mg, and to 0.26±0.06 after 40 mg. Repeated-measures ANOVA showed a highly significant main effect of MPH dose on BPND (F3, 27=29, p<0.0001). Post-hoc pair-wise comparisons demonstrated statistically significant differences in BPND in the thalamus for each MPH dose increment, i.e. 0 mg vs 2.5 mg (F1,10=12.3, p=0.006), 2.5 mg vs 10 mg (F1, 10=9.8, p=0.011), and 10 mg vs 40 mg (F1,9=34.3, p<0.0001). This demonstrates that each of the three dose increments caused statistically significant displacement of [11C]MRB.
Figure 2.

Template MRI and average PET images (n=11) showing [11C]MRB binding after administration of MPH 0, 2.5, 10, and 40 mg. (A) Axial, coronal, and sagittal views of the template MR image used to determine regions of interest. (B) Axial, coronal, and sagittal views of the average PET image of mean [11C]MRB binding at baseline, and (C) after MPH 2.5 mg, (D) 10 mg, and (E) 40 mg. The color scale denotes BPND.
Figure 3.
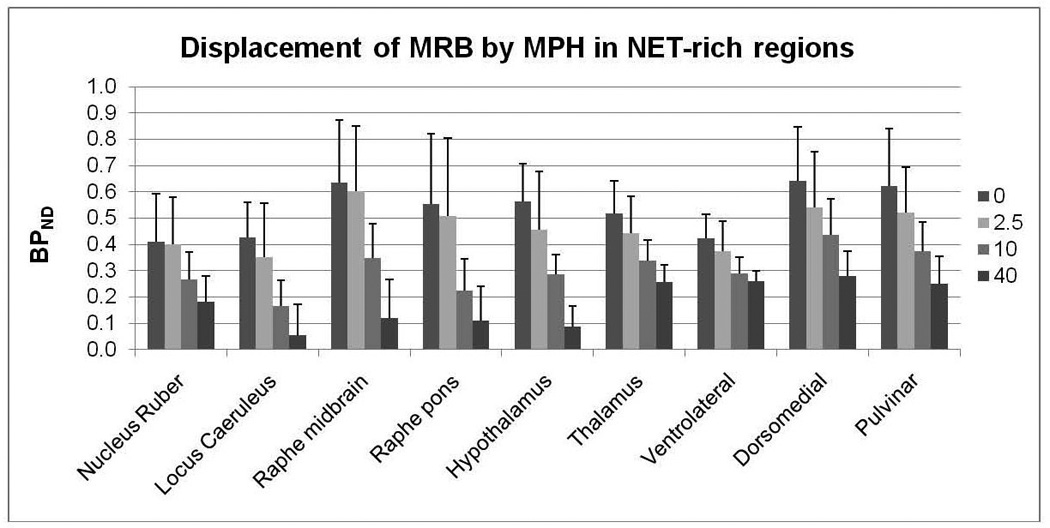
Dose-dependent displacement of [11C]MRB by MPH in NET-rich regions. Each cluster of bar graphs denotes, from left to right, mean BPND at baseline (dark gray), after MPH 2.5 mg (light gray), 10 mg (gray), and 40 mg (black). Error bars denote standard deviation.
NET Occupancy: ED50 and IC50
As can be seen in Figure 3, the reduction of MRTM2 BPND estimates in regions such as LC, raphé nuclei and hypothalamus exceeded 80% at 40 mg, whereas in the thalamus and thalamic subnuclei, displacement was 50–60%. These regional differences in the reduction of MRTM2 BPND estimates could be due to a higher ED50 or higher non-specific binding in the thalamus. Assuming that non-specific binding in a region of interest is different than that in the reference region, MPH ED50 and NET occupancy can be estimated with 3-parameter fits using Eq. 1. Assuming that non-specific binding in a region of interest is the same as in the reference region (i.e. ) MPH ED50 and NET occupancy can be estimated with 2-parameter fits .
In the thalamus, the assumption of non-uniform nonspecific binding led to significantly better fits (F1,37 = 4.2, p < 0.05) (Fig. 4A and 4B). Using the 2-parameter fit ED50 would have been estimated to be 0.42±0.13 mg/kg (Fig. 4A), while it was estimated to be 0.08±0.06 mg/kg using the 3-parameter fit (Fig. 4B). and were estimated to be 0.52±0.03 and 0.21±0.06, respectively, and [11C]MRB true BPND was estimated to be 0.25±07 (using Eq. 3). NET occupancy at 40 mg would have been estimated to be 48% using the 2-parameter fit (Fig. 4A), and 85% using the 3-parameter fit (Fig. 4B). Conversely, in non-thalamic regions the 2-fit model led to statistically better fits (all F values < 0.63 and all p values >0.43) (Figure 4C). Comparing individual fits in the six main regions of interest (i.e. including the thalamus but excluding its subnuclei) and coupled fits with a common ED50 for all six regions, the ED50 estimates are not statistically different across regions (F5,227 = 0.95, p=0.45) (for these fits, was fixed to zero in all regions except the thalamus). In conclusion, the regional differences in maximum displacement are most consistent with higher non-specific binding in the thalamus. Using data from all NET-rich regions, the global ED50 estimate was 0.14±0.02 mg/kg.
Figure 4.

Dose-response curve in the thalamus (A and B) and the hypothalamus (C). (A) Two-parameter fit (i.e., is assumed to be equal to zero) in the thalamus; the solid line corresponds to the line of best fit, and the dashed line corresponds to the MRTM2 BPND value at baseline on the left y-axis, or 0% occupancy on the right y-axis; in this case 100% occupancy corresponds to BPND equal to zero. (B) Three-parameter (i.e., ) fit in the thalamus; the solid line corresponds to the line of best fit, the dotted line correspond to the MRTM2 BPND value at saturation (i.e., ) on the left y-axis or 100% occupancy on the right y-axis, and the dashed line corresponds to the MRTM2 BPND value at baseline (i.e., ) on the left y-axis or 0% occupancy on the right y-axis. (C) Dose-response curve in the hypothalamus and two-parameter fit. In the thalamus, the three-parameter model produces a significantly better fit (F1,37 = 4.2, p < 0.05). In all other NET-rich regions, including the hypothalamus, the two-parameter model is more suitable (all F1,37 values <0.63 and all p values >0.43). The two-parameter model in the thalamus (A) produces a higher ED50 estimate (0.42 mg/kg) and lower occupancy estimates (shown on the left y-axis) than the three-parameter model in the thalamus (B) and the two-parameter model in non-thalamic regions (C). Fits shown in B and C share a common ED50 parameter (0.14 mg/kg), since there is no significant difference between ED50 estimates in the various regions of interest (F5,227 = 0.95, p=0.45), when using 3- parameter model in thalamus and 2-parameter model elsewhere.
The IC50 is the plasma concentration of d-threo-MPH at which 50% of NET in the brain are occupied. Assuming a linear relationship between dose (mg/kg) and plasma level, and using the global ED50 estimate and the regression line in Supplementary Fig. 1, the IC50 of MPH was estimated to be 4.7 ng/mL.
Discussion
MPH Occupancy of NET
This is the first in vivo study in humans showing that clinically relevant doses of MPH occupy significant levels of NET. Although MPH has been used for the treatment of ADHD for decades, the exact mechanism of action is unclear. Stimulants enhance synaptic concentrations of DA and NE, d-amphetamine by increasing catecholamine release and MPH by inhibiting catecholamine reuptake. Currently it is believed that MPH’s therapeutic effects in ADHD are due mostly to its DAT inhibition, however, here we show that MPH also binds to NET with high affinity. The global ED50 of MPH was estimated to be 0.14 mg/kg. Because occupancy equals dose/(dose+ED50), an MPH dose of 0.5 mg/kg would produce ~80% NET occupancy. This is consistent with clinical dosing. The average efficacious maintenance dose of MPH is 0.7–0.9 mg/kg per day in children (26) and 1.1 mg/kg per day in adults (27). Because of its short half-life, immediate-release formulations of MPH are given twice daily, so that a total daily dose of 0.7–1.1 mg/kg corresponds to 0.35–0.55 mg/kg per dose. Therefore, the average efficacious maintenance doses of MPH used in children and adults occupy 70–80% of NET. In comparison, these doses of MPH occupy only 60–% of DAT (based on an ED50 of 0.25 mg/kg for DAT (7).) Eighty percent occupancy appears to be an efficacy-threshold for some medications that target receptors and transporters in the brain, e.g. antidepressants that block the serotonin transporter (28) and antipsychotics that block the dopamine D2 receptor (29). Whether 80% occupancy of MPH targets are required for efficacy remains to be determined. In summary, our results suggest that the therapeutic effects of MPH in ADHD may be mediated through NET inhibition, in addition to DAT inhibition.
NET and DAT, NE and DA
Interestingly, NET has greater affinity for DA than for NE (30), and whether DAT or NET is the predominant protein clearing DA depends on the abundance of the two transporters in a given region (31). In mice, 0.75 mg/kg MPH administered orally increased DA content in the frontal cortex, without producing significant changes in NE levels (32). Because the ED50 estimate of MPH for NET (0.14 mg/kg) is lower than that for DAT (0.25 mg/kg), it is possible that lower doses of MPH inhibit dopamine reuptake by blocking NET, rather than DAT. Medications such as atomoxetine could actually exert their therapeutic effects through DA reuptake inhibition even though they are “norepinephrine reuptake inhibitors”. That is, even though atomoxetine blocks only NET and not DAT, its therapeutic effects could be due to DA reuptake inhibition because NET in the PFC may be required for DA reuptake.
Heterogeneous non-specific binding
Consistent with the known distribution of NET, we found the highest levels of [11C]MRB binding in the locus caeruleus, thalamus and some midbrain nuclei, and the lowest binding in occipital cortex and striatum (25, 33). As described above, in the thalamus 40 mg of MPH displaced only 50–60% of [11C]MRB compared to >80% in other regions. The most likely explanation for this is higher non-specific binding in the thalamus, which has been described with other NET ligands. Other explanations seem less likely. Although [11C]MRB has some affinity for the serotonin transporter (IC50 = 310 nM), if binding to the serotonin transporter prevented complete displacement in the thalamus, one would expect to see a similar effect in the raphénuclei. This was not the case. In our previous occupancy study in humans high doses of atomoxetine (100 mg) were unable to completely displace [11C]MRB in the thalamus (34). We therefore conclude that in humans the thalamus has higher non-specific binding for [11C]MRB, which is consistent with the heterogeneous non-specific binding of earlier NET ligands (35). Some regional variation in the level of non-displaceable binding occurs with most ligands; however, such differences are much more detectible in the case of ligands with low BP values, i.e., when non-displaceable uptake is a significant fraction of the total uptake.
Role of Prefrontal Cortex and Other Regions in ADHD
Although the therapeutic effects of medications used for ADHD occur mostly in the PFC (5), the density of NET in PFC is so low that PET imaging cannot be used to detect changes in occupancy. The only neocortical regions in which NET density was high enough to detect displacement of [11C]MRB by MPH were the supplementary motor area (SMA) and the paracentral lobule (PL) an area involved in the response to MPH during cognitive tasks (36). In these two areas displacement was similar to that in non-cortical NET-rich regions, and the reduction in binding after 10 and 40 mg of MPH was statistically significant (p<0.001 for all pair-wise comparisons). Because we cannot assess the effect of MPH in the PFC directly, our assumption is that the global ED50 calculated using NET-rich regions, including the neocortical paracentral lobule, is similar to the ED50 in regions with lower NET density, such as the PFC. Occupancy depends on the free drug level in the tissue, which depends on the free drug level in the plasma, and will thus be the same throughout the brain. Importantly, we demonstrated that MPH occupied NET in regions that have been implicated in ADHD, such as the locus caeruleus, which maintains vigilance; the thalamus, which filters interfering stimuli; and the thalamic pulvinar nucleus, which is involved in orienting to a stimulus (2), and which may be smaller in ADHD (37).
Summary
We have shown that MPH at clinically-relevant doses blocks 70–80% of NET while previous studies estimated that MPH only blocks 60–70% of DAT at similar doses. Therefore, NET blockade may be important in the therapeutic effects of MPH in ADHD. Whether there is an underlying abnormality in DAT, NET, the α2 adrenergic receptor, or the dopamine D1 receptor in ADHD is not known (5). It was initially thought that DAT density was lower in ADHD, however, this has since been refuted (6). It remains to be determined whether there is an inherent difference in NET density in stimulant-naïve subjects with ADHD, and this study is currently underway.
Supplementary Material
Acknowledgements
The authors thank the staff of the Yale University PET Center for their technical expertise and support, the staff at the Yale Cognitive Disorders Clinic for their help in recruiting and screening subjects, Tom Cooper at Nathan S. Kline Institute for Psychiatric Research (Orangeburg, NY) for measuring blood levels of MPH, and the individuals who volunteered for this study. Support for this study was provided by the National Institute on Drug Abuse (DA019062, R56DA19062). J.H. was supported by UL1 RR024139 (CTSA) from the National Center for Research Resources, a component of the National Institutes of Health (NIH), and NIH roadmap for Medical Research, and from K12 DA000167.
Footnotes
Financial Disclosures
Christopher H.van Dyck’s spouse and Yale University have a license agreement with Shire Pharmaceuticals for the development of Intuniv® (guanfacine) for the treatment of ADHD and related disorders. None of the other authors (Jonas Hannestad, Jean-Dominique Gallezot, Beata Planeta-Wilson, Shu-Fei Lin, Wendol A. Williams, Robert T. Malison, Richard E. Carson, Yu-Shin Ding) reports any biomedical financial interests or potential conflicts of interests.
References
- 1.Makris N, Biederman J, Monuteaux MC, Seidman LJ. Towards conceptualizing a neural systems-based anatomy of attention-deficit/hyperactivity disorder. Dev Neurosci. 2009;31(1–2):36–49. doi: 10.1159/000207492. [DOI] [PMC free article] [PubMed] [Google Scholar]
- 2.Bush G. Attention-Deficit/Hyperactivity Disorder and Attention Networks. Neuropsychopharmacology. 2010 Jan;35(1):278–300. doi: 10.1038/npp.2009.120. [DOI] [PMC free article] [PubMed] [Google Scholar]
- 3.Dickstein SG, Bannon K, Castellanos FX, Milham MP. The neural correlates of attention deficit hyperactivity disorder: an ALE meta-analysis. J Child Psychol Psychiatry. 2006 Oct;47(10):1051–1062. doi: 10.1111/j.1469-7610.2006.01671.x. [DOI] [PubMed] [Google Scholar]
- 4.Madras BK, Miller GM, Fischman AJ. The dopamine transporter and attention-deficit/hyperactivity disorder. Biol Psychiatry. 2005 Jun 1;57(11):1397–1409. doi: 10.1016/j.biopsych.2004.10.011. [DOI] [PubMed] [Google Scholar]
- 5.Arnsten AF. Toward a new understanding of attention-deficit hyperactivity disorder pathophysiology: an important role for prefrontal cortex dysfunction. CNS Drugs. 2009;23(Suppl 1):33–41. doi: 10.2165/00023210-200923000-00005. [DOI] [PubMed] [Google Scholar]
- 6.Swanson JM, Volkow ND. Psychopharmacology: concepts and opinions about the use of stimulant medications. J Child Psychol Psychiatry. 2009 Jan;50(1–2):180–193. doi: 10.1111/j.1469-7610.2008.02062.x. [DOI] [PMC free article] [PubMed] [Google Scholar]
- 7.Volkow ND, Wang GJ, Fowler JS, Gatley SJ, Logan J, Ding YS, et al. Dopamine transporter occupancies in the human brain induced by therapeutic doses of oral methylphenidate. Am J Psychiatry. 1998 Oct;155(10):1325–1331. doi: 10.1176/ajp.155.10.1325. [DOI] [PubMed] [Google Scholar]
- 8.Arnsten AF, Scahill L, Findling RL. alpha2-Adrenergic receptor agonists for the treatment of attention-deficit/hyperactivity disorder: emerging concepts from new data. J Child Adolesc Psychopharmacol. 2007 Aug;17(4):393–406. doi: 10.1089/cap.2006.0098. [DOI] [PubMed] [Google Scholar]
- 9.Biederman J, Melmed RD, Patel A, McBurnett K, Konow J, Lyne A, et al. A randomized, double-blind, placebo-controlled study of guanfacine extended release in children and adolescents with attention-deficit/hyperactivity disorder. Pediatrics. 2008 Jan;121(1):e73–e84. doi: 10.1542/peds.2006-3695. [DOI] [PubMed] [Google Scholar]
- 10.Eshleman AJ, Carmolli M, Cumbay M, Martens CR, Neve KA, Janowsky A. Characteristics of drug interactions with recombinant biogenic amine transporters expressed in the same cell type. J Pharmacol Exp Ther. 1999 May;289(2):877–885. [PubMed] [Google Scholar]
- 11.Berridge CW, Devilbiss DM, Andrzejewski ME, Arnsten AF, Kelley AE, Schmeichel B, et al. Methylphenidate preferentially increases catecholamine neurotransmission within the prefrontal cortex at low doses that enhance cognitive function. Biol Psychiatry. 2006 Nov 15;60(10):1111–1120. doi: 10.1016/j.biopsych.2006.04.022. [DOI] [PubMed] [Google Scholar]
- 12.Aron AR, Dowson JH, Sahakian BJ, Robbins TW. Methylphenidate improves response inhibition in adults with attention-deficit/hyperactivity disorder. Biol Psychiatry. 2003 Dec 15;54(12):1465–1468. doi: 10.1016/s0006-3223(03)00609-7. [DOI] [PubMed] [Google Scholar]
- 13.Ding YS, Fowler JS, Volkow ND, Dewey SL, Wang GJ, Logan J, et al. Chiral drugs: comparison of the pharmacokinetics of [11C]d-threo and L-threo-methylphenidate in the human and baboon brain. Psychopharmacology (Berl) 1997 May;131(1):71–78. doi: 10.1007/s002130050267. [DOI] [PubMed] [Google Scholar]
- 14.Logan J, Wang GJ, Telang F, Fowler JS, Alexoff D, Zabroski J, et al. Imaging the norepinephrine transporter in humans with (S,S)-[11C]O-methyl reboxetine and PET: problems and progress. Nucl Med Biol. 2007 Aug;34(6):667–679. doi: 10.1016/j.nucmedbio.2007.03.013. [DOI] [PubMed] [Google Scholar]
- 15.Ding YS, Naganawa M. Clinical Doses of Atomoxetine Significantly Occupy Both Norepinephrine and Serotonin Transporters: Implications on Treatment of Depression and ADHD. J Nucl Med. 2009;50(Suppl 2):127P. doi: 10.1016/j.neuroimage.2013.08.001. [DOI] [PubMed] [Google Scholar]
- 16.Gallezot JD, Weinzimmer D. Evaluation of [C11]MRB for Receptor Occupancy Studies of Norepinephrine Transporters. Neuroimage. 2008;41:T49. doi: 10.1016/j.neuroimage.2010.09.040. [DOI] [PMC free article] [PubMed] [Google Scholar]
- 17.Ding YS, Singhal T, Planeta-Wilson B, Gallezot JD, Nabulsi N, Labaree D, et al. PET imaging of the effects of age and cocaine on the norepinephrine transporter in the human brain using (S,S)-[(11)C]O-methylreboxetine and HRRT. Synapse. 2010 Jan;64(1):30–38. doi: 10.1002/syn.20696. [DOI] [PMC free article] [PubMed] [Google Scholar]
- 18.APA. Diagnostic and Statistical Manual of Mental Disorders: DSM-IV-TR. 2000 American Psychiatric Publisher. [Google Scholar]
- 19.Ding YS, Lin KS, Garza V, Carter P, Alexoff D, Logan J, et al. Evaluation of a new norepinephrine transporter PET ligand in baboons, both in brain and peripheral organs. Synapse. 2003 Dec 15;50(4):345–352. doi: 10.1002/syn.10281. [DOI] [PubMed] [Google Scholar]
- 20.Carson RE, Barker WC, Liow JS, Adler S, Johnson CA. Design of a motion-compensation OSEM List-mode Algorithm for Resolution-Recovery Reconstruction of the HRRT; Conf Record IEEE Nuclear Science Symposium and Medical Imaging Conference; 2003. pp. M16–M26. [Google Scholar]
- 21.Tzourio-Mazoyer N, Landeau B, Papathanassiou D, Crivello F, Etard O, Delcroix N, et al. Automated anatomical labeling of activations in SPM using a macroscopic anatomical parcellation of the MNI MRI single-subject brain. Neuroimage. 2002 Jan;15(1):273–289. doi: 10.1006/nimg.2001.0978. [DOI] [PubMed] [Google Scholar]
- 22.Innis RB, Cunningham VJ, Delforge J, Fujita M, Gjedde A, Gunn RN, et al. Consensus nomenclature for in vivo imaging of reversibly binding radioligands. J Cereb Blood Flow Metab. 2007 Sep;27(9):1533–1539. doi: 10.1038/sj.jcbfm.9600493. [DOI] [PubMed] [Google Scholar]
- 23.Ichise M, Toyama H, Innis RB, Carson RE. Strategies to improve neuroreceptor parameter estimation by linear regression analysis. J Cereb Blood Flow Metab. 2002 Oct;22(10):1271–1281. doi: 10.1097/01.WCB.0000038000.34930.4E. [DOI] [PubMed] [Google Scholar]
- 24.Ichise M, Liow JS, Lu JQ, Takano A, Model K, Toyama H, et al. Linearized reference tissue parametric imaging methods: application to [11C]DASB positron emission tomography studies of the serotonin transporter in human brain. J Cereb Blood Flow Metab. 2003 Sep;23(9):1096–1112. doi: 10.1097/01.WCB.0000085441.37552.CA. [DOI] [PubMed] [Google Scholar]
- 25.Schou M, Halldin C, Pike VW, Mozley PD, Dobson D, Innis RB, et al. Post-mortem human brain autoradiography of the norepinephrine transporter using (S,S)-[18F]FMeNER-D2. Eur Neuropsychopharmacol. 2005 Oct;15(5):517–520. doi: 10.1016/j.euroneuro.2005.01.007. [DOI] [PubMed] [Google Scholar]
- 26.Vitiello B, Abikoff HB, Chuang SZ, Kollins SH, McCracken JT, Riddle MA, et al. Effectiveness of methylphenidate in the 10-month continuation phase of the Preschoolers with Attention-Deficit/Hyperactivity Disorder Treatment Study (PATS) J Child Adolesc Psychopharmacol. 2007 Oct;17(5):593–604. doi: 10.1089/cap.2007.0058. [DOI] [PubMed] [Google Scholar]
- 27.Spencer T, Biederman J, Wilens T, Doyle R, Surman C, Prince J, et al. A large, double-blind, randomized clinical trial of methylphenidate in the treatment of adults with attention-deficit/hyperactivity disorder. Biol Psychiatry. 2005 Mar 1;57(5):456–463. doi: 10.1016/j.biopsych.2004.11.043. [DOI] [PubMed] [Google Scholar]
- 28.Meyer JH, Wilson AA, Ginovart N, Goulding V, Hussey D, Hood K, et al. Occupancy of serotonin transporters by paroxetine and citalopram during treatment of depression: a [(11)C]DASB PET imaging study. Am J Psychiatry. 2001 Nov;158(11):1843–1849. doi: 10.1176/appi.ajp.158.11.1843. [DOI] [PubMed] [Google Scholar]
- 29.Kapur S. A new framework for investigating antipsychotic action in humans: lessons from PET imaging. Mol Psychiatry. 1998 Mar;3(2):135–140. doi: 10.1038/sj.mp.4000327. [DOI] [PubMed] [Google Scholar]
- 30.Pacholczyk T, Blakely RD, Amara SG. Expression cloning of a cocaine-and antidepressant-sensitive human noradrenaline transporter. Nature. 1991 Mar 28;350(6316):350–354. doi: 10.1038/350350a0. [DOI] [PubMed] [Google Scholar]
- 31.Moron JA, Brockington A, Wise RA, Rocha BA, Hope BT. Dopamine uptake through the norepinephrine transporter in brain regions with low levels of the dopamine transporter: evidence from knock-out mouse lines. J Neurosci. 2002 Jan 15;22(2):389–395. doi: 10.1523/JNEUROSCI.22-02-00389.2002. [DOI] [PMC free article] [PubMed] [Google Scholar]
- 32.Balcioglu A, Ren JQ, McCarthy D, Spencer TJ, Biederman J, Bhide PG. Plasma and brain concentrations of oral therapeutic doses of methylphenidate and their impact on brain monoamine content in mice. Neuropharmacology. 2009 Dec;57(7–8):687–693. doi: 10.1016/j.neuropharm.2009.07.025. [DOI] [PMC free article] [PubMed] [Google Scholar]
- 33.Ghose S, Fujita M, Morrison P, Uhl G, Murphy DL, Mozley PD, et al. Specific in vitro binding of (S,S)-[3H]MeNER to norepinephrine transporters. Synapse. 2005 May;56(2):100–104. doi: 10.1002/syn.20133. [DOI] [PubMed] [Google Scholar]
- 34.Logan J, Ding YS, Lin KS, Pareto D, Fowler J, Biegon A. Modeling and analysis of PET studies with norepinephrine transporter ligands: the search for a reference region. Nucl Med Biol. 2005 Jul;32(5):531–542. doi: 10.1016/j.nucmedbio.2005.04.005. [DOI] [PubMed] [Google Scholar]
- 35.Seneca N, Gulyas B, Varrone A, Schou M, Airaksinen A, Tauscher J, et al. Atomoxetine occupies the norepinephrine transporter in a dose-dependent fashion: a PET study in nonhuman primate brain using (S,S)-[18F]FMeNER-D2. Psychopharmacology (Berl) 2006 Sep;188(1):119–127. doi: 10.1007/s00213-006-0483-3. [DOI] [PubMed] [Google Scholar]
- 36.Volkow ND, Fowler JS, Wang GJ, Telang F, Logan J, Wong C, et al. Methylphenidate decreased the amount of glucose needed by the brain to perform a cognitive task. PLoS One. 2008;3(4):e2017. doi: 10.1371/journal.pone.0002017. [DOI] [PMC free article] [PubMed] [Google Scholar]
- 37.Ivanov I, Bansal R, Hao X, Zhu H, Kellendonk C, Miller L, et al. Morphological Abnormalities of the Thalamus in Youths With Attention Deficit Hyperactivity Disorder. Am J Psychiatry. 2010 Feb 1; doi: 10.1176/appi.ajp.2009.09030398. [DOI] [PMC free article] [PubMed] [Google Scholar]
Associated Data
This section collects any data citations, data availability statements, or supplementary materials included in this article.