Abstract
Background:
By school-age, even low-risk moderately preterm-born children show more neuro-cognitive deficits, motor impairments, academic underachievement, behavioral problems, and poor social adaptation than full-term peers.
Aim:
To evaluate the outcomes at school-age for moderately preterm-born children (29-33 weeks gestational age), appropriate in growth for gestational age (AGA) and medically at low-risk, randomized to Newborn Individualized Developmental Care and Assessment Program (NIDCAP) or standard care in the Newborn Intensive Care Unit. At school-age, the experimental (E) group will show better neuropsychological and neuro-electrophysiological function, as well as improved brain structure than the control (C) group.
Materials and Methods:
The original sample consisted of 30 moderately preterm-born infants (29 to 33 weeks), 23 (8C and 15E) of them were evaluated at 8 years of age, corrected-for-prematurity with neuropsychological, EEG spectral coherence, and diffusion tensor magnetic resonance imaging (DT-MRI) measures.
Results:
E-performed significantly better than C-group children on the Kaufman Assessment Battery for Children-Second Edition (KABC-II) and trended towards better scores on the Rey-Osterrieth Complex Figure Test. They also showed more mature frontal and parietal brain connectivities, and more mature fiber tracts involving the internal capsule and the cingulum. Neurobehavioral results in the newborn period successfully predicted neuropsychological functioning at 8 years corrected age.
Conclusion:
Moderately preterm infants cared for with the NIDCAP intervention showed improved neuropsychological and neuro-electrophysiological function as well as improved brain structure at school-age.
Keywords: Diffusion tensor magnetic resonance imaging, electroencephalogram, neuropsychological function, newborn individualized developmental care and assessment program, prematurity, school-age, spectral coherence
INTRODUCTION
Preterm compared to full-term children perform more poorly in working memory, planning, visual spatial organization, and mental flexibility,[1,2] and are over-represented among early intervention and special education service recipients.[3] Early brain-based differences[4,5] contribute to long-term disabilities. Poor executive function appears related to basal ganglia/cerebellar volume reduction and sub-cortical white matter circuit disruptions between frontal, striatal, and thalamic regions.[6,7] Cumulative effects of medical complications[8] are compounded by the Newborn Intensive Care Unit (NICU) experience (exposure to bright lights, heightened sound, frequent interventions), which alters brain development.[9,10,11] The Newborn Individualized Developmental Care and Assessment Program (NIDCAP)[12] provides a system of NICU care and environmental structure that supports preterm infants’ early brain development. Several randomized, controlled NIDCAP trials reported significant neurobehavioral and neuro-electrophysiological improvement for high-risk preterm infants.[13,14,15,16,17,18,19,20] School-age follow-up studies[21,22] showed continued significant neurodevelopmental improvement. The current study tests NIDCAP-effectiveness into school-age for medically low-risk, appropriate for gestational age (AGA), moderately preterm infants and evaluates prediction by newborn-period neurobehavioral measures of school-age neuropsychological performance.
MATERIALS AND METHODS
Study design and ethics
Children born preterm, who had been studied in-NICU during a randomized control trial[23] (control-C and experimental-E), were assessed in follow-up at 8 years (y) of age corrected-for-prematurity (CA). The study protocol was approved by the hospital's Institutional Review Board for Research with Human Subjects. All school-age assessment personnel (neuropsychology, interviews, EEG, and MRI) were kept blind to original subject group assignments.
Subjects
The original sample[23] consisted of 30 study infants (14C; 16E), recruited from the 46-bed level-III NICU, with an inborn population at a large urban tertiary care center. Family selection criteria included: Maternal age >14 years; no major medical or psychiatric illness, chronic medication treatment, and/or history of substance abuse; telephone accessibility; and English-language facility. Infant criteria included: Gestational birth-age 28 weeks 4 days (d) to 33 weeks 3 days; 5-minute Apgar >7; at birth AGA (5th-95th percentile)[24] in weight and head circumference; normal initial cranial ultrasound (s), MRI, and/or electroencephalogram (EEG); <72 hours ventilator and/or vasopressor support; prenatal care; absence of congenital/chromosomal abnormalities, congenital/acquired infections, prenatal brain lesions, and seizures. Of the 30 subjects, 23 (8C; 15E) returned at school-age [Figure 1].
Figure 1.
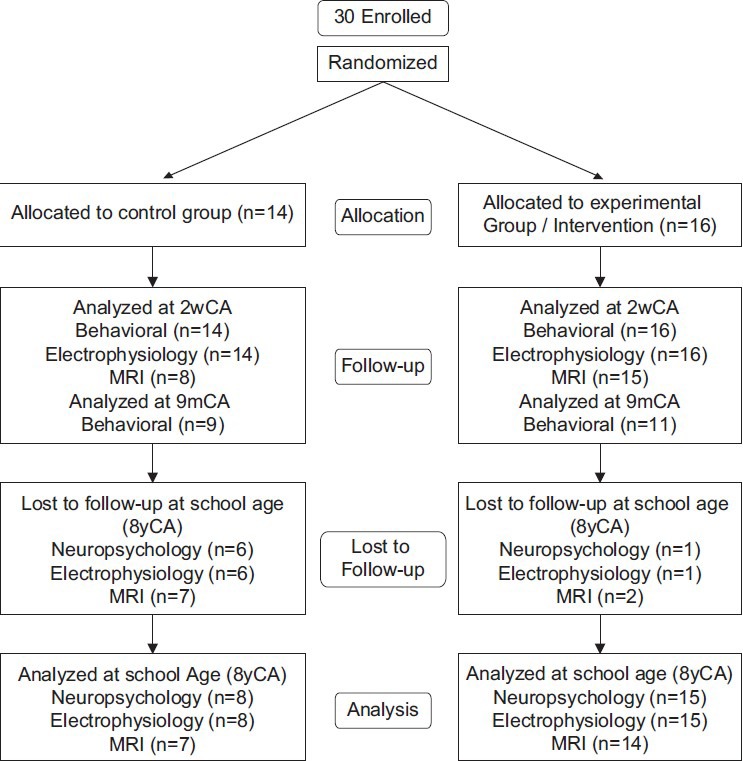
Consort chart
Summary of newborn intervention and study results
E-infants received NIDCAP[12] from NICU-admission to 2 weeks corrected age. C-group care was the study NICU's standard care. At 2 weeks corrected age, E-infants showed significantly better neurobehavioral functioning (Assessment of Preterm Infants’ Behavior-APIB[25]), increased brain functionality (EEG) with increased frontal to occipital brain connectivities,[4] and improved brain structure (MRI) with more mature internal capsule and frontal white matter fiber tracts. The relationship among neurobehavior, EEG, and MRI was significant. Nine-months corrected age E-group neurodevelopmental functioning (Bayley Scales of Infant Development, Second Edition[26]) was significantly improved.
Primary and secondary school-age hypotheses
Significant E-group-favoring effects were hypothesized for visual-spatial planning, executive function and working memory, spectral coherence increase between long-distance bi-hemispheric frontal and parietal brain system, and improved fiber tract development in internal capsule and optic radiations. Significant relationships were hypothesized among school-age neuropsychological function, spectral coherence, and diffusion-tensor magnetic-resonance-imaging, and between newborn neurobehavioral and school-age neuropsychological function.
Sample description
Newborn background information was compared between the children who returned for school-age follow-up and those who did not. Newborn background information was also compared between returning school-age C-and E-group children. School-age anthropometric, medical, and academic history indices were measured or obtained by parent interview.[27] Parent-IQ, reportedly correlating with child functioning,[28] was measured with the Kaufman Brief Intelligence Test, Second Edition (KBIT-2),[29] yielding a Verbal IQ, Non-Verbal IQ, and Mental Processing Composite (Mean-x: 100; standard deviation-SD: 15). Should parent-IQ, hypothesized to be comparable between groups, correlate with child-IQ, all outcome measures would be corrected for parent-IQ.
School-age neurodevelopmental outcomes
Neuropsychological measures
The small sample size necessitated limited neuropsychological assessment. An experienced neuropsychologist performed the Kaufman Assessment Battery for Children, Second Edition (KABC-II)[30] yielding a Mental Processing Composite Index (x=100; SD=15), four Scale Indexes, (Sequential, Simultaneous, Planning, Learning), and two language subscales (Expressive Vocabulary, Verbal Knowledge); the Woodcock-Johnson III Tests of Achievement (WJIII)[31] with two Standard Cluster Scores (x=100; SD=15) (Broad Reading-Letter/Word Identification, Reading Fluency, Passage Comprehension; Academic Skills-Letter/Word Identification, Calculation, Spelling); and the Rey-Osterrieth Complex Figure Test (Rey),[32,33,34] Copy, Immediate Recall and Delayed (20 minutes) Recall conditions assessing gestalt integration, executive function, spatial planning, and memory. The Rey Developmental Scoring System[35,36] yields per condition 3 mutually exclusive scores, Organization; Structural Elements Accuracy; and Incidental Elements Accuracy.
Neurophysiological measures
EEG and MRI studies were conducted within 1 week of neuropsychological testing. A pediatric EEG-technologist collected thirty-two-channel EEG at a 256 Hz sampling rate (with 1-50 Hz bandpass filtering with 60 Hz mains filter) for 12 minutes of Eyes Closed alert state EEG. Paroxysmal eye, muscle, and body movements were visually identified and excluded. Figure 2 shows standard EEG electrode names and positions [Figure 2]. Analysis used the Laplacian reference-electrode-free format, sensitive to underlying cortex and insensitive to deep/remote EEG sources.[37] Residual eye blink/movement artifacts were removed with source component techniques.[38,39] (BESA™ software package). Spectral analysis, including spectral coherence calculation,[40] was performed (Nicolet™ software package). Two Hz/data point (16 points/32 Hz) spectral resolution for 32 channels yielded 7936 individual coherence variables. Remaining low amplitude, artifactual contributions were removed by multivariate regression analysis,[41] utilizing signals proportional to known artifact sources. Coherence variable number was reduced by using in-house-developed[42] principal components analysis software suited to factoring large asymmetrical matrices. Forty coherence factors, previously created on an independent age-comparable normative sample (n=219) and reflecting 48% of total coherence variance,[43,44] were formed on the current school-age subjects utilizing the previous principal-components-analysis-generated rule. Given the sample size, the first 20 factors were utilized in the subsequent analyzes.
Figure 2.
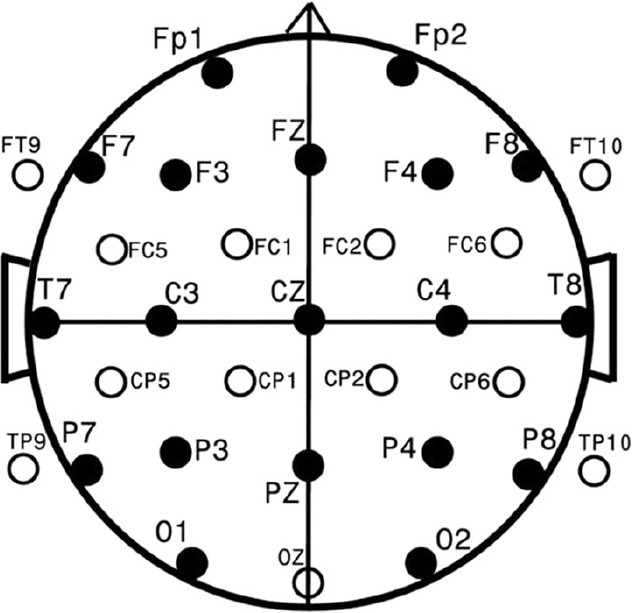
Standard EEG electrode names and positions. Head in vertex view, nose above, left ear to left. EEG electrodes: Z: Midline: FZ: Midline Frontal; CZ: Midline Central; PZ: Midline parietal; OZ: Midline occipital. Even numbers, right hemisphere locations; odd numbers, left hemisphere locations: Fp: Frontopolar; F: Frontal; C: Central; T: Temporal; P: Parietal; O: Occipital. The standard 19, 10-20 electrodes are shown as black circles. An additional subset of 17, 10-10 electrodes are shown as open circles
Neurostructural measures
Diffusion-tensor-MRI evaluated underlying brain structure by quantitative assessment of brain connectivity to delineate relevant white matter pathways and measure myelination and axon integrity parameters. Data were acquired at 3Tesla (Siemens Tim Trio, Siemens, Erlangen, Germany) with an MR imager using a 32-channel head coil. High spatial resolution echo-planar diffusion-weighted images were acquired (24 cm FOV, matrix 128 × 128, 2 mm thick contiguous slices). Geometric distortion from magnetic susceptibility differences was minimized with a short echo time (TE=78 ms) and parallel imaging (iPAT 2). Thirty b=1000 s/mm2 images were acquired at directions evenly spaced on the sphere along with 5 baseline (b=0) images. Diffusion tensors were reconstructed, and 5 major fiber pathways were identified with a previously validated automated procedure.[45] Summary diffusion scalar measures of mean diffusivity, axial diffusivity, radial diffusivity, and fractional anisotropy were averaged in a streamline-density-weighted fashion.[46] along 5 major pathways: Arcuate Fasciculus (connecting posterior brain areas with Broca's area involved in complex language processing[47]); Corpus Callosum (thick white nerve band deep within the brain connecting the two hemispheres, supporting their communication and activity coordination); Cingulum (tracts receiving inputs from thalamus and neocortex; projecting to the entorhinal cortex; integral to limbic system; involving emotion, learning, memory, and executive function); Internal Capsule (massive white matter layer, major route inter-connecting cerebral cortex with brainstem and spinal cord); and Optic Radiations (axons carrying visual information from lateral geniculate nucleus relay neurons of thalamus to visual cortex). Children were scanned unsedated, awake, watching a cartoon or movie. Broad language processing tracts (arcuate fasciculus)[48] and early-developing basic hemispheres-connecting structures were thought to be least affected by NIDCAP; cingulum, internal capsule, and optic radiations related to memory, executive function, and visual-motor processing were hypothesized to be improved for E-children.
Data analysis
The Biomedical Data Package 2007™ (BMDP)[49] supported statistical analyzes. Continuous variables were submitted to univariate analysis of variance (ANOVA) (BMDP-7D).[50] In cases of unequal variance, the Browne-Forsythe test of variance (F*) was used. Categorical variables were submitted to Fisher's exact probability test (FET) for 2 × 2, and Pearson's Chi-square (χ2) test for all other multiple row by column arrays.[49,51] Two-tailed values of P<0.05 were considered statistically significant. Sample sizes provided 80% power to detect large between-group-effects, generally effect sizes >1.0.[52] Analyzes included stepwise discriminant analysis (BMDP-7M) for the neuropsychological, electrophysiological, and neurostructural domains; Wilks’ lambda[53] and jack-knifed[54,55] classification for ascertainment of two-group classification success per domain and across domains; canonical correlation analysis (BMDP-6M) to explore relationships among the neuropsychological, electrophysiological, and neurostructural domains at school-age, and between newborn and school-age neurobehavioral domains.
RESULTS
Sample
Newborn background for subjects with versus without school age follow-up
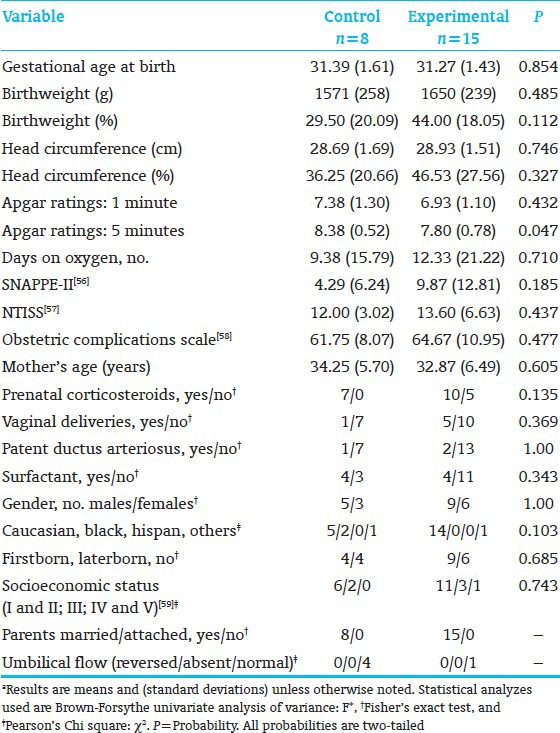
The subjects who returned for school-age follow-up were sicker at birth than those who did not return [Table 1].[56,57,58,59] Moreover, the school-age E-group had significantly lower 5-minute Apgar scores than the C-group [Table 2].[56,57,58,59] This biased results against the E-group.
Table 1.
Anthropometric, medical, and demographic background variables, participating vs. lost to follow-up subjects*
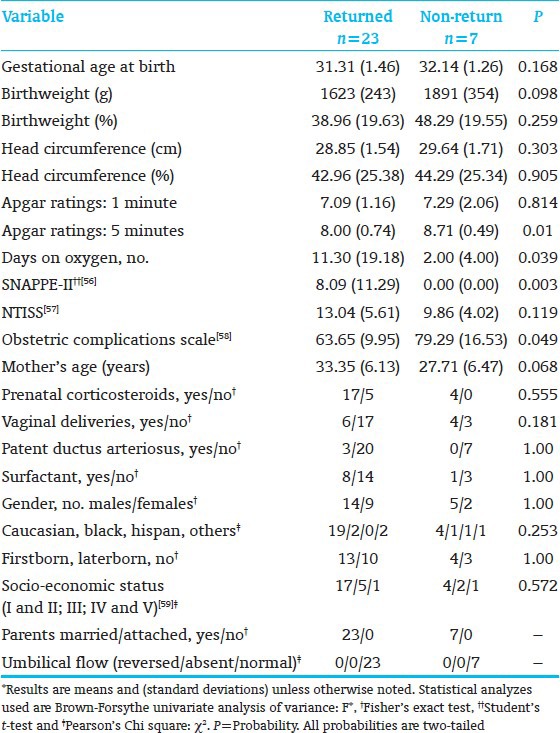
Table 2.
Anthropometric, medical, and demographic background variables, children seen at follow-up, control vs. experimental group*
School-age background including parent IQ
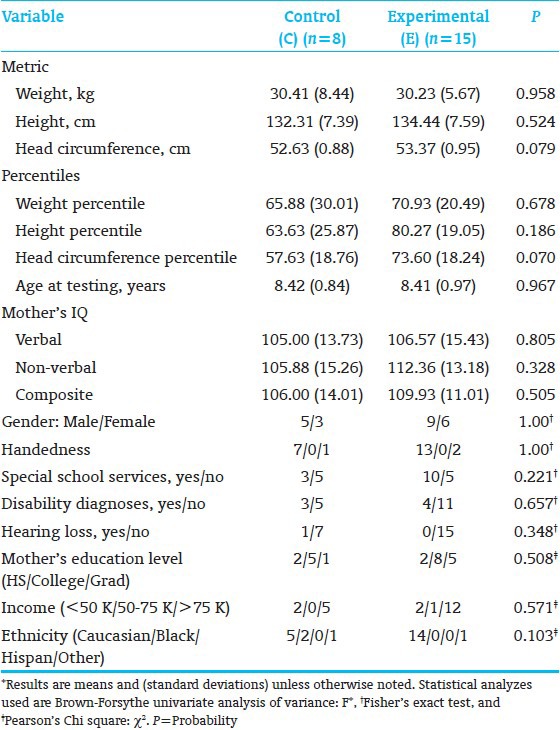
C-and E-school-age groups were comparable in age-at-testing, parent-IQ,[29] and anthropometric, medical, and demographic characteristics. E-children's head circumferences were somewhat larger [Table 3]. Parent Mental Processing Composite and non-verbal IQ[29] correlated significantly with Child Simultaneous Processing[30] (r=0.4309, P=0.05; r=0.4231, P=0.05, respectively). Therefore, all outcome measures were residualized by partial correlation and multivariate regression analysis (BMDP-6M) for Parent IQ.
Table 3.
Anthropometric, medical, and demographic variables at time of evaluation*
Neurodevelopmental school-age outcome
Neuropsychological results
All subjects (8C; 15E) completed neuropsychological testing. E-performed significantly better than the C-children on KABC-II Composite Index Simultaneous Processing and on subtest Rover; subtest Triangles showed a trend [Table 4]. Both subtests assess planning, decision-making, executive function, and visual-spatial processing. The groups performed comparably on the WJ-III Broad Reading and Academic Skill Clusters [Table 5], as well as on the 9 Rey scores. However, on the Rey, Basal Level and Organization (Immediate Recall), along with Incidental Accuracy (Delayed Recall), showed a trend towards favoring E-over C-children [Table 6], indicating that E-children showed somewhat better overall gestalt integration, visual-motor planning, visual gestalt and detail memory, and executive function. Figure 3 shows a C-and an E-child's sample drawings. The KABC-II Simultaneous Processing and Rey differences are reminiscent of the earlier school-age study results for high-risk preterms[22] and the poorer visual-spatial planning, executive and memory functions reported for preterms without intervention.[60,61]
Table 4.
Kaufman assessment battery for children, second edition
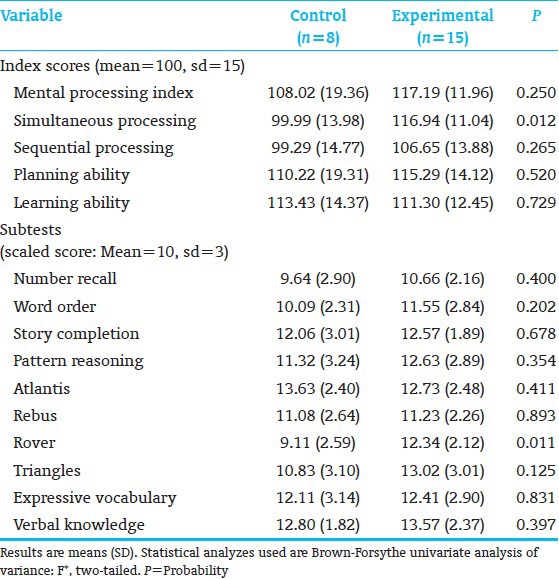
Table 5.
Woodcock-Johnson III
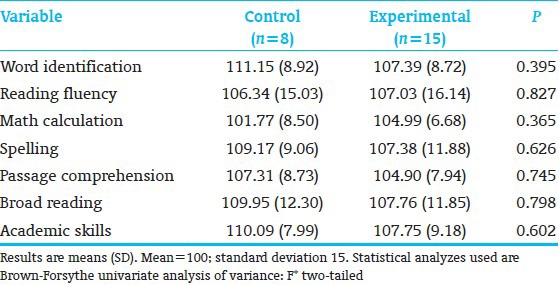
Table 6.
Rey-Osterrieth complex figure test
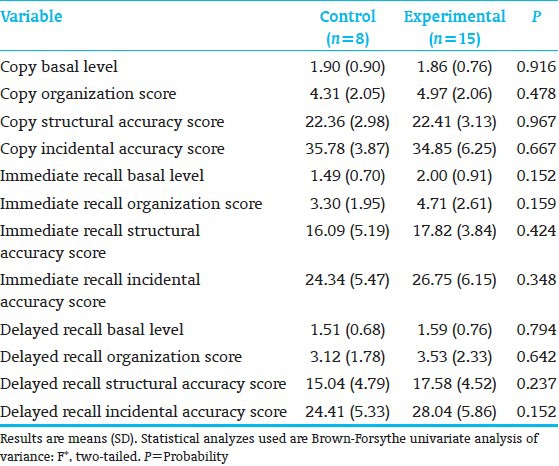
Figure 3.
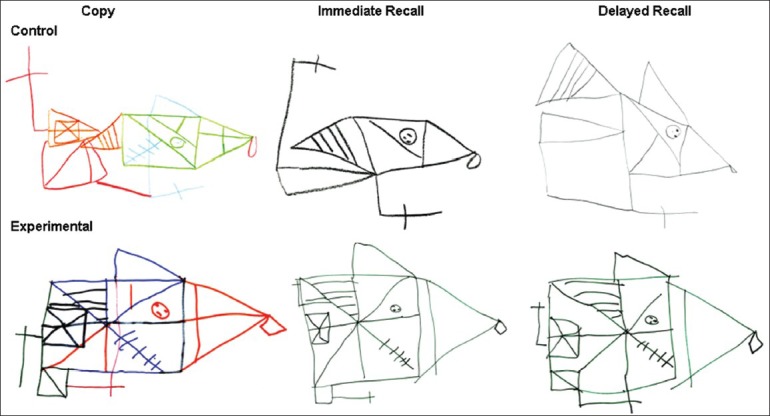
Rey-Osterrieth complex figure. The figure represents sample drawings from 2 study children, 1 from the Control group, a 9 year 3 month old born at 31 w 1 d GA; and 1 from the Experimental group, a 8 year 4 month old born at 31 w 4 d GA. The conditions displayed are from left to right: Copy, Immediate Recall, and Delayed Recall
Discriminant analysis (10 KABC-II, 7 WJ-III subtests, 9 Rey-measures) identified 3 KABC-II (Rover, Atlantis, and Triangles) and 2 Rey (Organization/Immediate and Delayed Recall) measures that showed significant C-from E-group differentiation [Table 7]. Misclassified were 2 C-and 3 E-subjects.
Table 7.
Discriminant function analysis of neuropsychological measures

Neurophysiological results
All school-age subjects completed neurophysiological assessment. Coherence-Factor-15 showed significantly decreased E-over C-group connectivity (P=0.001) between the right medial posterior frontal and right occipital regions from 2-18 Hz. This suggests release of frontal-associative cortex from overly-restricted visual-motor integration, freeing it for higher level functions. Factor-13 showed a trend towards significant group difference (P=0.112) [Figure 4]. Factor-13 (8-12 Hz, i.e., alpha), a broad, long-distance, and interhemispheric set of connectivities, demonstrated strong E-over C-group enhancement of left frontal lobe (typically dominant in motor and sensory processing functions) connectivity with multiple distant regions, especially in the contra-lateral hemisphere, suggesting better information and processing flow to and from left frontal lobe, indicative of better visual-spatial and broad high level judgment, planning, and executive control functions.
Figure 4.
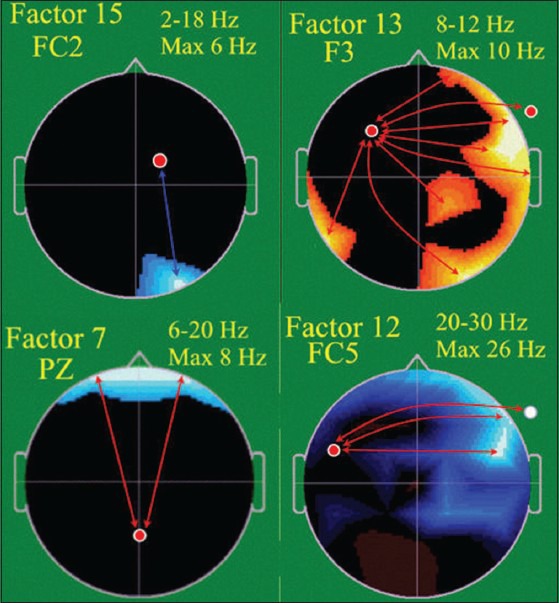
EEG Spectral coherence factors at school age, Control (C) (n = 8), Experimental (E) (n = 15). Head shown in vertex view, nose above, left ear to left. EEG frequency and coherence electrodes shown above head. Arrow color illustrates experimental group coherence; green = decreased, red = increased
Discriminant analysis identified 3 coherence factors [Figure 4] significantly differentiating C-from E-children [Table 8]. Jackknifed classification success utilizing the 3 factors showed 91.3% correct subject classification.[54,55] The factors included Coherence-Factor-7, increased for the E-subjects, a long distance bi-hemispheric factor (6-20 Hz) connecting parietal-associative regions with bilateral prefrontal cortex, consistent with more mature prefrontal cortex connectivities underlying organization, planning and executive function; Factor-12, (20-30 Hz), involving, similar to Factor-13, E-group connectivity increase of left lateral-frontal regions to homologous, broader, right lateral-frontal and anterior-temporal regions, likely sub-serving working memory; and again Factor-15, as interpreted above. These factors misclassified only 2 C-subjects.
Table 8.
Discriminant function analysis of EEG coherence factors

Overall, the successful group-discriminating factors highlighted two increased bi-hemispheric, connectivities from left frontal to broad temporal and parietal regions and one decreased connectivity, freeing up frontal system function, mirroring earlier results.[22,23,62] NIDCAP, for this population, appears to have increased connectivities strongly supportive of broad executive and complex planning functions as well as of working memory.
Brain structural results
Twenty-one (7 C; 14 E) subjects completed MRI study. For internal capsule and optic radiation, as hypothesized, E-showed a significantly stronger trend towards lower diffusivity (mean and radial diffusivity) than C-children. Internal capsule, axial diffusivity was also lower. The cingulum also showed significantly lower E-than C-group mean and radial diffusivity and a trend towards lower axial diffusivity; and the arcuate fasciculus showed a trend towards lower mean and radial diffusivity [Table 9]. Higher E-than C-group fractional anisotropy was observed only at the trend level for the cingulum. Other structures differed in the direction favorable to the E-group. Marginal fractional anisotropy findings were possibly due to the small sample [Table 10 and Figure 5].
Table 9.
Diffusion tensor magnetic resonance imaging, diffusivity measures (C=7; E=14)

Table 10.
Diffusion tensor magnetic resonance imaging factors for fractional anisotropy, (C=7; E=14)
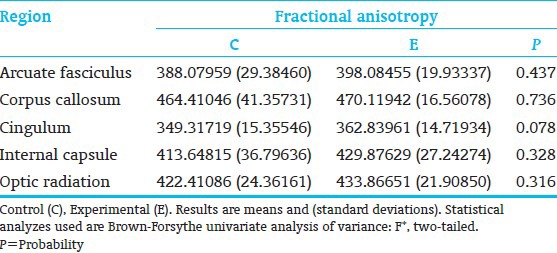
Figure 5.
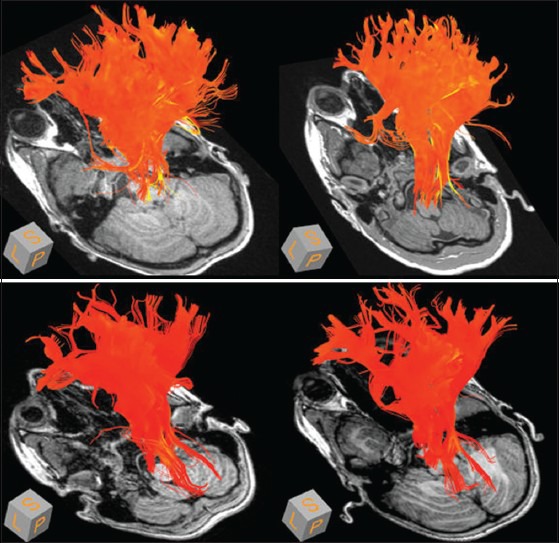
Mean diffusivity in cortico-spinal tract (internal capsule) at 8 years. Control children, top row, experimental children, bottom row. Mean diffusivity rendered onto trajectories of the cortico-spinal tract, and color coded from red (low) to yellow (high). (Yellow and brighter orange: Higher measure of mean diffusivity; darker orange and red: Lower measure of mean diffusivity
Discriminant function analysis accessing all 20 diffusion-tensor-MRI variables identified 3 measures, corpus callosum radial diffusivity, cingulum fractional anisotropy, and internal capsule radial diffusivity, which significantly differentiated C-from E-children [Table 11]. Two C-and 2 E-subjects were misclassified. Despite reduced sample, diffusion-tensor-MRI successfully differentiated the groups.
Table 11.
Discriminant function analysis of diffusion tensor magnetic resonance imaging measures
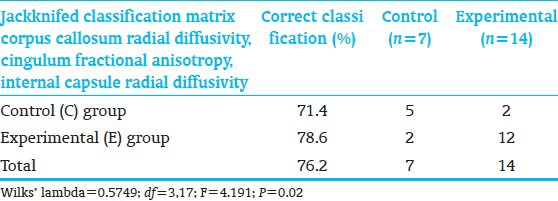
Classification success utilizing all three neurodevelopment domains
When examining the relative group classification power of the 3 neurodevelopmental domains, discriminant analysis identified 2 coherence factors (15, 12) and 3 neuropsychological variables including KABC-II Triangles (measuring planning, decision-making, executive function, and visual-spatial processing) and Rey Organization-Immediate and Delayed Recall (assessing gestalt integration, executive function, spatial planning, and memory) measures which significantly differentiated C-from E-children [Table 12]. Two C-and 2 E-subjects were misclassified. Classification success was highly significant despite small sample size. Thus, overall, the EEG measures were most successful in discriminating C-from E-children.
Table 12.
Discriminant function analysis of neuropsychological, EEG and diffusion tensor magnetic resonance imaging measures
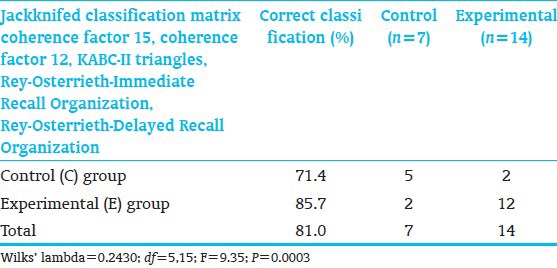
Relationship between neuropsychological and spectral coherence measures
Canonical correlation between the discriminant-analysis- identified neuropsychological measures (KABC-II Rover, Atlantis, Triangles; Rey Immediate/Delayed Recall Organization Scores) and spectral coherence factors (12, 7, 15) showed a significant relationship (Bartlett's test, χ2=38.01, df=15, P<0.0160). One canonical variable described the relationship. KABC-II subtest Atlantis (memory storage/retrieval of verbal information) and Rey Organization-Delayed Recall (long-term storage retrieval of visual-spatial content and executive function) as well as Coherence Factors-12 and-7 correlated highest with the canonical variable. Thus, better verbal and executive function, spatial organization, planning, and memory were associated with stronger broad bilateral frontal and parietal connectivities.
Relationship between spectral coherence and diffusion-tensor-MRI measures
Canonical correlation between the discriminant-analysis- identified Coherence Factors-7,-12, and-15 and the diffusion-tensor-MRI measures, (corpus callosum radial diffusivity, cingulum fractional anisotropy, and internal capsule radial diffusivity) was marginally significant (χ2=14.79, df=9, P=0.0968). One canonical variable described the relationship. Variables correlating significantly with the canonical variable included Coherence Factors-15 (positive) and-7 (negative), and cingulum fractional anisotropy (positive), and internal capsule radial diffusivity (negative). Thus, measures of integrated central parietal and bilateral frontal connectivities coupled with frontal system functioning unhampered by restrictive visual motor input were associated with better-developed cingulum and internal capsule fiber tracts.
Relationships between newborn and school-age neurobehavioral function
Canonical correlation showed a significant relationship between the 8 newborn APIB/Prechtl factor scores[23] and 4 KABC-II[30] Scale Indexes (Sequential, Simultaneous, Planning, Learning) (χ2=46.19, df=32 P=0.0501). One canonical variable described the relationship. APIB/Prechtl-Factor-3 (reactivity and hypersensitivity) and KABC-II Simultaneous Scale Index correlated significantly with the canonical variable. Newborns, who were less hypersensitive and over-reactive, had better KABC-II Simultaneous Scale scores at school age. Canonical correlation also identified a highly significant relationship (χ2 = 137.64, df=96, P=0.0034) between the APIB/Prechtl factor scores[23] and 12 school-age Rey[32] measures. One canonical variable described the relationship. APIB/Prechtl-Factors-2 (broad motor organization) and-3 again, (see above) correlated significantly with the canonical variable as did Rey Organization-Copy and Basal Level-Immediate Recall. Thus, the better organized motorically and less hyper-reactive/hypersensitive the newborn, the better the school-age child's overall Rey-production in Copy and Immediate Recall. The relationship between newborn neurobehavioral and 8-year neuropsychological function was strong and internally consistent.
DISCUSSION
Results reported, consistent across the 3 domains tested, support the hypothesis that NIDCAP enhances low-risk AGA moderately preterm infants’ long-term neurodevelopment, specifically complex planning, executive function, memory, and simultaneous non-verbal mental processing. E-children showed significantly better neurobehavioral functioning at 2 weeks corrected age[23] and better simultaneous processing and complex planning, memory, and executive function at school-age. Similarly, E-children at 2 weeks corrected age showed a pattern of increased long-distance connectivities between occipital and frontal regions,[23] and at school-age increased bilateral and across-midline broad frontal and parietal connectivities and release from overly connected visual-motor function. The NIDCAP experience supports better-differentiated brain connectivity development. Better developed connectivities between frontal systems and the parietal systems appears more conducive to better mental control, executive and memory functions.[63] This is reflected in Factor-15, supportive of frontal associative cortical functions, and Factor-13, supportive of mental processing, memory, executive function, attention to spatial relationships/location, responsivity to object shape, size, and orientation, and visual spatial working memory.[64,65]
The school-age neurostructural findings corroborated the neuropsychological and neurophysiological findings. Diffusion-tensor-MRI, which at 2 weeks corrected age showed improved E-group right and left internal capsule and frontal white matter tracts[23] showed at school-age improved internal capsule, cingulum, optic radiation, and arcuate fasciculus fiber tracts.
This is the first report of school-age NIDCAP-effectiveness for low-risk AGA moderately preterm infants in terms of neuropsychological, electrophysiological, and brain-structural development. Results are internally consistent. NIDCAP is directed towards reliable reduction in stressful experiences and consistent return to base and restfulness to assure the infants’ opportunities for continued behavioral re-integration of experiences, the foundation for increasingly well-differentiated modulation of function and the growth of well-differentiated brain-connectivities.
Not all children returned for follow-up testing. It appears that the children who were more compromised at birth with lower Apgar scores at 5 minutes and higher SNAPPE-II, a newborn illness severity and mortality risk score, returned for school-age assessment. Moreover, the returning experimental group children were differentially sicker (lower Apgar scores at 5 minutes) in the newborn period than the returning control children. This emphasizes even more the effectiveness of the in-NICU NIDCAP intervention in improving neurodevelopmental outcomes at school-age.
Interpretation of findings, nevertheless, requires caution. The study's most serious limitation is the small sample size. Substantiation by larger, longitudinal school-age follow-up studies is necessary to corroborate the result presented. Advances in newborn intensive care since the time of study also may have implications for result interpretation. The mechanisms underlying NIDCAP effectiveness remain to be discovered. The cost-effectiveness of NIDCAP, as compared to other in-NICU interventions,[66] remains to be evaluated.
The long-term goal of the research is the wider dissemination of the NIDCAP approach.
Given the encouraging findings, preterm infants and their families benefit when those responsible for NICU care are knowledgeable and well-educated in early brain development and provide opportunities for individualized developmental care. The highly dependent, sensitive, and rapidly developing preterm infants and their hopeful and vulnerable parents have little choice but to fully trust NICU staff. Professionals and NICU systems must live up to and warrant this trust.
Footnotes
Source of Support: Nil
Conflict of Interest: None declared.
REFERENCES
- 1.Taylor H, Klein N, Drotar D, Schluchter M, Hack M. Consequences and Risks of <1000-g Birth Weight for Neuropsychological Skills, Achievement, and Adaptive Functioning. J Dev Behav Pediatr. 2006:459–70. doi: 10.1097/00004703-200612000-00002. [DOI] [PubMed] [Google Scholar]
- 2.Aarnoudse-Moens C, Duivenvoorden H, Weisglas-Kuperus N, Van Goudoever J, Oosterlaan J. The profile of executive function in very preterm children at 4 to 12 years. Dev Med Child Neurol. 2012;54:247–53. doi: 10.1111/j.1469-8749.2011.04150.x. [DOI] [PubMed] [Google Scholar]
- 3.Washington: DC; 2005. U.S. Department of Health and Human Services Center for Disease Control. National Vital Statistics Reports: Births: Final Data for 2004. [Google Scholar]
- 4.Duffy FH, Als H, McAnulty GB. Infant EEG spectral coherence data during quiet sleep: Unrestricted Principal Components Analysis-Relation of factors to gestational age, medical risk, and neurobehavioral status. Clin Electroencephalogr. 2003;34:54–69. doi: 10.1177/155005940303400204. [DOI] [PubMed] [Google Scholar]
- 5.Constable RT, Ment LR, Vohr B, Kesler SR, Fulbright RK, Lacadie C, et al. Prematurely born children demonstrate white matter miscrostructural differences at 12 years of age, relative to term control subjects: An investigation of group and gender effects. Pediatrics. 2008;121:306–16. doi: 10.1542/peds.2007-0414. [DOI] [PubMed] [Google Scholar]
- 6.Nosarti C, Giouroukou E, Healy E, Rifkin L, Walshe M, Reichenberg A, et al. Grey and white matter distribution in very preterm adolescents mediates neurodevelopmental outcome. Brain. 2008;131:205–17. doi: 10.1093/brain/awm282. [DOI] [PubMed] [Google Scholar]
- 7.Edgin JO, Inder TE, Anderson PJ, Hood KM, Clark CA, Woodward LJ. Executive functioning in preschool children born very preterm: Relationship with early white matter pathology. J Int Neuropsych Soc. 2008;14:90–101. doi: 10.1017/S1355617708080053. [DOI] [PubMed] [Google Scholar]
- 8.Duffy FH, Als H, McAnulty GB. Behavioral and electrophysiological evidence for gestational age effects in healthy preterm and fullterm infants studied 2 weeks after expected due date. Child Dev. 1990;61:1271–86. [PubMed] [Google Scholar]
- 9.Philbin MK, Lickliter R, Graven S. Sensory experience and the developing organism: A history of ideas and view to the future. J Perinat. 2000;20:S2–5. doi: 10.1038/sj.jp.7200434. [DOI] [PubMed] [Google Scholar]
- 10.Limperopoulos C, Gauvreau K, O’Leary H, Moore M, Bassan H, Eichenwald E, et al. Cerebral Hemodynamic Changes During Intensive Care of Preterm Infants. Pediatrics. 2008;122:e1006–13. doi: 10.1542/peds.2008-0768. [DOI] [PMC free article] [PubMed] [Google Scholar]
- 11.Browne J, White RD. Foundations of Developmental Care. Clin Perinatol. 2011;38:591–758. doi: 10.1016/j.clp.2011.09.001. [DOI] [PubMed] [Google Scholar]
- 12.Als H. Boston: NIDCAP Federation International Boston; 1986. Program Guide-Newborn Individualized Developmental Care and Assessment Program (NIDCAP): An Education and Training Program for Health Care Professionals, Copyright. rev 2011. [Google Scholar]
- 13.Als H, Lawhon G, Duffy FH, McAnulty GB, Gibes-Grossman R, Blickman JG. Individualized developmental care for the very low birthweight preterm infant: Medical and neurofunctional effects. JAMA. 1994;272:853–8. [PubMed] [Google Scholar]
- 14.Fleisher BF, VandenBerg KA, Constantinou J, Heller C, Benitz WE, Johnson A, et al. Individualized developmental care for very-low-birth-weight premature infants. Clin Pediatr. 1995;34:523–9. doi: 10.1177/000992289503401003. [DOI] [PubMed] [Google Scholar]
- 15.Westrup B, Kleberg A, von Eichwald K, Stjernqvist K, Lagercrantz H. A randomized controlled trial to evaluate the effects of the Newborn Individualized Developmental Care and Assessment Program in a Swedish setting. Pediatrics. 2000;105:66–72. doi: 10.1542/peds.105.1.66. [DOI] [PubMed] [Google Scholar]
- 16.Als H, Gilkerson L, Duffy FH, McAnulty GB, Buehler DM, VandenBerg KA, et al. A three-center randomized controlled trial of individualized developmental care for very low birth weight preterm infants: Medical, neurodevelopmental, parenting and caregiving effects. J Dev Behav Pediatr. 2003;24:399–408. doi: 10.1097/00004703-200312000-00001. [DOI] [PubMed] [Google Scholar]
- 17.Peters K, Rosychuk R, Hendson L, Cote J, McPherson C, Tyebkhan J. Improvement of short- and long-term outcomes for very low birth weight infants: The Edmonton NIDCAP trial. Pediatrics. 2009;124:1009–20. doi: 10.1542/peds.2008-3808. [DOI] [PubMed] [Google Scholar]
- 18.McAnulty G, Duffy F, Butler S, Parad R, Ringer S, Zurakowski D, et al. Individualized developmental care for a large sample of very preterm infants: Health, neurobehavior and neurophysiology. Acta Paediatr. 2009;98:1920–6. doi: 10.1111/j.1651-2227.2009.01492.x. [DOI] [PMC free article] [PubMed] [Google Scholar]
- 19.Als H, Duffy FH, McAnulty GB, Fischer CB, Kosta S, Butler SC, et al. Is the Newborn Individualized Developmental Care and Assessment Program (NIDCAP) effective for preterm infants with intrauterine growth restriction? J Perinatol. 2011;31:130–6. doi: 10.1038/jp.2010.81. [DOI] [PMC free article] [PubMed] [Google Scholar]
- 20.Als H, Duffy FH, McAnulty G, Butler S, Lightbody L, Kosta S, et al. NIDCAP improves brain function and structure in preterm infants with severe intrauterine growth restriction. J Perinatol. 2012;32:797–803. doi: 10.1038/jp.2011.201. [DOI] [PMC free article] [PubMed] [Google Scholar]
- 21.Westrup B, Böhm B, Lagercrantz H, Stjernqvist K. Preschool outcome in children born very prematurely and cared for according to the Newborn Individualized Developmental Care and Assessment Program (NIDCAP) Acta Paediatr. 2004;93:498–507. doi: 10.1080/08035250410023548. [DOI] [PubMed] [Google Scholar]
- 22.McAnulty G, Duffy F, Butler S, Bernstein J, Zurakowski D, Als H. Effects of the Newborn Individualized Developmental Care and Assessment Program (NIDCAP) at age 8 years: Preliminary data. Clin Pediatr. 2010;49:258–70. doi: 10.1177/0009922809335668. [DOI] [PMC free article] [PubMed] [Google Scholar]
- 23.Als H, Duffy F, McAnulty GB, Rivkin MJ, Vajapeyam S, Mulkern RV, et al. Early experience alters brain function and structure. Pediatrics. 2004;113:846–57. doi: 10.1542/peds.113.4.846. [DOI] [PubMed] [Google Scholar]
- 24.Gairdner D, Pearson J. A growth chart for premature and other infants. Arch Dis Child. 1971;46:783–7. doi: 10.1136/adc.46.250.783. [DOI] [PMC free article] [PubMed] [Google Scholar]
- 25.Als H, Lester BM, Tronick EZ, Brazelton TB. Manual for the assessment of preterm infants’ behavior (APIB) In: Fitzgerald HE, Lester BM, Yogman MW, editors. Theory and Research in Behavioral Pediatrics. Vol. 1. New York: Plenum Press; 1982. pp. 65–132. [Google Scholar]
- 26.Bayley N. 2nd Edition. San Antonio: The Psychological Corporation; 1993. Bayley Scales of Infant Development. [Google Scholar]
- 27.Als H. US: Children›s Hospital Boston; 1990. Children›s Hospital Family Interview: Early Experience 8 Year Old Interview. Revised 2007. [Google Scholar]
- 28.Whitley E, Gale CR, Deary IJ, Kivimaki M, Batty GD. Association of Maternal and Paternal IQ With Offspring Conduct, Emotional, and Attention Problem Scores: Transgenerational Evidence From the 1958 British Birth Cohort Study. Arch Gen Psychiatry. 2011;68:1032–8. doi: 10.1001/archgenpsychiatry.2011.111. [DOI] [PMC free article] [PubMed] [Google Scholar]
- 29.Kaufman AS, Kaufman NL. 2nd Edition. Circle Pines, MN: American Guidance Service; 2004. Kaufman Brief Intelligence Test. [Google Scholar]
- 30.Kaufman AS, Kaufman NL. 2nd Edition. Circle Pines, MN: American Guidance Service; 2003. Kaufman Assessment Battery for Children (KABC-II) [Google Scholar]
- 31.Woodcock RW, McGrew KS, Mather N. Rolling Meadows, Illinois: Riverside Publishing; 2001. Woodcock-Johnson III Tests of Achievement. [Google Scholar]
- 32.Osterrieth PA. Le test de copie d’une figure complexe. Arch Psychologie. 1944;30:206–356. [Google Scholar]
- 33.Somerville J, Tremont G, Stern RA. The Boston Qualitative Scoring System as a measure of executive functioning in Rey-Osterrieth Complex Figure performance. J Clin Exp Neuropsychol. 2000;22:613–21. doi: 10.1076/1380-3395(200010)22:5;1-9;FT613. [DOI] [PubMed] [Google Scholar]
- 34.Beebe DW, Ris MD, Brown TM, Dietrich KN. Executive functioning and memory for the Rey-Osterreith complex figure task among community adolescents. Appl Neuropsychol. 2004;11:91–8. doi: 10.1207/s15324826an1102_4. [DOI] [PubMed] [Google Scholar]
- 35.Bernstein JH, Waber DP. Odessa FL: Psychological Assessment Resources; 1996. Developmental Scoring System for the Rey-Osterrieth Complex Figure. [Google Scholar]
- 36.Waber D, McCormick M. Late neurophysiological outcomes in preterm infants of normal IQ: Selective vulnerability of the visual system. J Pediat Psychol. 1995;20:721–35. doi: 10.1093/jpepsy/20.6.721. [DOI] [PubMed] [Google Scholar]
- 37.Srinvasan R, Winter WR, Ding J, Nunez PL. EEG and MEG coherence: Measures of functional connectivity at distinct spatial scales of neocortical dynamics. J Neurosci Methods. 2007;166:41–52. doi: 10.1016/j.jneumeth.2007.06.026. [DOI] [PMC free article] [PubMed] [Google Scholar]
- 38.Lins OG, Picton TW, Berg P, Scherg M. Ocular artifacts in recording EEGs and event-related potentials. II: Source dipoles and source components. Brain Topogr. 1993;6:65–78. doi: 10.1007/BF01234128. [DOI] [PubMed] [Google Scholar]
- 39.Berg P, Scherg M. Dipole modeling of eye activity and its application to the removal of eye artifacts from EEG and MEG. Clin Phys Physiol Meas. 1991;12:49–54. doi: 10.1088/0143-0815/12/a/010. [DOI] [PubMed] [Google Scholar]
- 40.Van Drongelen W. Vol. 5. Oxford: Elsevier; 2011. Signal Processing for Neuroscientists: An Introduction to the Analysis of Physiological Signals. [Google Scholar]
- 41.Semlitsch HV, Anderer P, Schuster P, Presslich O. A solution for reliable and valid reduction of ocular artifacts, applied to the P300 ERP. Psychophysl. 1986;23:695–703. doi: 10.1111/j.1469-8986.1986.tb00696.x. [DOI] [PubMed] [Google Scholar]
- 42.Duffy FH, Jones K, Bartels P, McAnulty G, Albert M. Unrestricted principal components analysis of brain electrical activity: Issues of data dimensionality, artifact, and utility. Brain Topogr. 1992;4:291–307. doi: 10.1007/BF01135567. [DOI] [PubMed] [Google Scholar]
- 43.Foley DH. Consideration of sample and feature size. IEEE Trans Inform Theory. 1972;18:618–26. [Google Scholar]
- 44.Bartels PH. Numerical evaluation of cytologic data III. Selection of features for discrimination. Anal Quant Cytol. 1979;1:153–9. [PubMed] [Google Scholar]
- 45.Suarez RO, Commowick O, Prabhu SP, Warfield SK. Automated delineation of white matter fiber tracts with a multiple region-of-interest approach. Neuroimage. 2012;59:3690–700. doi: 10.1016/j.neuroimage.2011.11.043. [DOI] [PMC free article] [PubMed] [Google Scholar]
- 46.Peters J, Sahin M, Vogel-Farley VK, Jeste SS, Nelson CA, III, Gregas MC, et al. Loss of White Matter Microstructural Integrity Is Associated with Adverse Neurological Outcome in Tuberous Sclerosis Complex. Acad Radiol. 2012;19:17–25. doi: 10.1016/j.acra.2011.08.016. [DOI] [PMC free article] [PubMed] [Google Scholar]
- 47.Bernal B, Ardila A. The role of the arcuate fasciculus in conduction aphasia. Brain. 2009;132:2309–16. doi: 10.1093/brain/awp206. [DOI] [PubMed] [Google Scholar]
- 48.Ment LR, Vohr B, Allan W, Katz KH, Schneider KC, Westerveld M, et al. Change in cognitive function over time in very low-birth-weight infants. JAMA. 2003;289:705–11. doi: 10.1001/jama.289.6.705. [DOI] [PubMed] [Google Scholar]
- 49.Dixon WJ. Berkeley: University of California Press; 1988. BMDP Statistical Software Manual. [Google Scholar]
- 50.Aickin M, Gensler H. Adjusting for multiple testing when reporting research results: The Bonferroni vs Holm methods. Am J Pub Health. 1996;86:726–8. doi: 10.2105/ajph.86.5.726. [DOI] [PMC free article] [PubMed] [Google Scholar]
- 51.Siegel S. New York: McGraw-Hill; 1956. Non-Parametric Statistics for the Behavioral Sciences. [Google Scholar]
- 52.Cohen J. New York: Academic Press; 1969. Statistical power for analysis for the behavioral sciences. [Google Scholar]
- 53.Rao CR. New York: Hafner Press; 1974. Advanced Statistical Methods in Biometric Research. [Google Scholar]
- 54.Lachenbruch PA. New York: Hafner Press; 1975. Discriminant Analysis. [Google Scholar]
- 55.Lachenbruch P, Mickey RM. Estimation of error rates in discriminant analysis. Technomet. 1968;10:1–11. [Google Scholar]
- 56.Richardson D, Corcoran J, Escobar G, Lee S, Canadian-NICU-Network, Kaiser-Permanente-Network et al. SNAP-II and SNAPPE-II: Simplified newborn illness severity and mortality risk scores. J Pediatr. 2001;138:92–100. doi: 10.1067/mpd.2001.109608. [DOI] [PubMed] [Google Scholar]
- 57.Gray JE, Richardson DK, McCormick MC, Workman-Daniels K, Goldman DA. Neonatal therapeutic intervention scoring system: A therapy-based severity-of-illness assessment tool. Pediatrics. 1992;90:561–7. [PubMed] [Google Scholar]
- 58.Littman B, Parmelee AH. Los Angeles: University of California; 1974. Manual for Obstetric Complications, Infant Studies Project, Department of Pediatrics, School of Medicine, Edition. [Google Scholar]
- 59.Hollingshead AB. Working Paper. USA: Yale University, New Haven; 1975. Four Factor Index of Social Status. [Google Scholar]
- 60.Waber D, McCormick M. Late neuropsychological outcomes in preterm infants of normal IQ: Selective vulnerability of the visual system. J Pediat Psychol. 1995;20:721–35. doi: 10.1093/jpepsy/20.6.721. [DOI] [PubMed] [Google Scholar]
- 61.Johnson S, Hennessy E, Smith RA, Trikic R, Wolke D, Marlow N. Academic attainment and special educational needs in extremely preterm children at 11 years of age: The EPICure study. Arch Dis Child Fetal Neonatal Ed. 2009;94:283–9. doi: 10.1136/adc.2008.152793. [DOI] [PubMed] [Google Scholar]
- 62.Buehler DM, Als H, Duffy FH, McAnulty GB, Liederman J. Effectiveness of individualized developmental care for low-risk preterm infants: Behavioral and electrophysiological evidence. Pediatrics. 1995;96:923–32. [PubMed] [Google Scholar]
- 63.Fair DA, Cohen AL, Power JD, Dosenbach NU, Church JA, Miezin FM, et al. Functional brain networks develop from a “local to ditributed” organization. PLos Comput Biol. 2009;5:e1000381. doi: 10.1371/journal.pcbi.1000381. [DOI] [PMC free article] [PubMed] [Google Scholar]
- 64.Song J, Jiang Y. Visual working memory for simple and complex features: An fMRI study. Neuroimage. 2006;30:963–72. doi: 10.1016/j.neuroimage.2005.10.006. [DOI] [PubMed] [Google Scholar]
- 65.Todd JJ, Han SW, Harrison S, Marois R. The neural correlates of visual working memory encoding: A time-resolved fMRI study. Neuropsychologia. 2011;49:1527–36. doi: 10.1016/j.neuropsychologia.2011.01.040. [DOI] [PMC free article] [PubMed] [Google Scholar]
- 66.Milgrom J, Newnham C, Anderson PJ, Doyle LW, Gemmill AW, Lee K, et al. Early sensitivity training for parents of preterm infants: Impact on the developing brain. Pediatr Res. 2010;67:330–5. doi: 10.1203/PDR.0b013e3181cb8e2f. [DOI] [PubMed] [Google Scholar]


