

Abstract
High-resolution real-time tomography of scattering tissues is important for many areas of medicine and biology1–6. However, the compromise between transverse resolution and depth-of-field in addition to low sensitivity deep in tissue continue to impede progress towards cellular-level volumetric tomography. Computed imaging has the potential to solve these long-standing limitations. Interferometric synthetic aperture microscopy (ISAM)7–9 is a computed imaging technique enabling high-resolution volumetric tomography with spatially invariant resolution. However, its potential for clinical diagnostics remains largely untapped since full volume reconstructions required lengthy postprocessing, and the phase-stability requirements have been difficult to satisfy in vivo. Here we demonstrate how 3-D Fourier-domain resampling, in combination with high-speed optical coherence tomography (OCT), can achieve high-resolution in vivo tomography. Enhanced depth sensitivity was achieved over a depth-of-field extended in real time by more than an order of magnitude. This work lays the foundation for high-speed volumetric cellular-level tomography.
A number of approaches to achieve optimal resolution over large depth ranges in OCT have been previously reported, ranging from hardware solutions, software additions, or a combination of the two. Such solutions include focus shifting10,11 as is utilized in confocal microscopy12, imaging with multiple beams, each focused at different depths within the sample13, illuminating the sample with a Bessel beam14,15, and numerical refocusing or deconvolution methods16,17. Although producing high quality tomograms, these methods suffer from long acquisition or processing times, or they require complex optical setups for which designing or manufacturing compact systems become difficult. A common difficulty with computed imaging techniques, often preventing them from widespread adoption, is the large computational requirements. Digital holography microscopy (DHM)18, interferometric synthetic aperture microscopy (ISAM), computational adaptive optics (CAO)19, and holoscopy20 all require the manipulation of acquired 2-D or 3-D data in the Fourier domain, typically resulting in lengthy processing times. This disparity between imaging and processing rates hinder the usefulness of any given modality. Without real-time implementations to provide feedback to the user during imaging, high-quality images can be elusive, requiring several imaging sessions or extensive postprocessing. In some modalities such as MRI, ISAM, and holoscopy, computing needs can be greatly reduced by performing a single coordinate warping (resampling) in the Fourier domain in lieu of more expensive reconstruction methods21. Even so, due to the computational requirements of the 3-D Fourier-domain resampling, real-time implementations for modalities such as ISAM and holoscopy have remained out of reach. Here we report a new method for performing 3-D Fourier-domain resampling by decomposing the three-dimensional problem into two sets of two-dimensional sub-problems which enables real-time computed imaging on high-speed but memory-limited devices such as graphics processing units (GPUs). With this advance in Fourier-domain resampling, our software is able to perform ISAM in steady-state and maintain an input-output flow at the camera-limited 92 kHz A-scan rate (95 frames per second). Real-time ISAM feedback enabled the development of a system for scanning and mounting in vivo samples in a phase-stable way which minimized or eliminated phase noise artifacts. To this end, we demonstrate high-resolution in vivo computed tomography over an extended depth, which can now potentially enable practical applications such as intraoperative and functional imaging.
Mathematically, ISAM is a solution to the inverse scattering problem that relates the Fourier transform of the measured data to the Fourier transform of the scattering potential of the object to be reconstructed. In general, ISAM is implemented as a Fourier domain resampling of the form k = f(qz, q) where q = (qx, qy) and qz are the transverse and axial spatial frequency coordinates, respectively. The added processing and the prohibitively large memory requirements for storing the 3-D complex volumetric data prior to Fourier-domain resampling makes ISAM and other computed imaging techniques computationally more expensive compared to standard approaches. In this work, we report a method for performing Fourier-domain resampling by decomposing a three-dimensional problem into two sets of two-dimensional sub-problems. This is achieved through writing the required coordinate warping as the composition of two functions, each of which only depends on one transverse spatial frequency: k = g1(g2(qz, qy) qx). Specifically for ISAM, we allow and . Utilizing g1 and subsequently g2, exact 3-D ISAM is possible without requiring a complete 3-D Fourier-domain representation of the tomogram. This enabled steady-state memory efficient frame-by-frame data transfer and computation, which was the basis of our real-time implementation. A detailed description of the resampling decomposition is included in the Supplementary Information.
A conventional 1300 nm spectral-domain optical coherence tomography (SD-OCT) system was used to demonstrate the real-time imaging capabilities of in vivo 3-D ISAM in highly scattering biological tissues at the full acquisition rate of the SD-OCT system (see Supplementary Fig. S1). Three-dimensional ISAM was implemented on a single GPU, with highly efficient memory utilization (see Supplementary Fig. S2). To this end, our Fourier-domain resampling method combined with the parallel processing capabilities of the GPU were exploited to achieve several orders of magnitude improvement in processing speed compared to previous CPU implementations22, and is limited only by the line rate of our camera.
After validating our method on a tissue-mimicking phantom (see Supplementary Fig. S3 and Supplementary Video 1), we demonstrate our real-time capabilities for obtaining in vivo ISAM tomograms. Reliable acquisition of phase-sensitive measurements in vivo is challenging due to the sample induced motions in a living tissue and inherent system noise. As ISAM relies on precise phase relationships throughout an acquired tomogram, its reconstruction quality is also susceptible to these sources of phase noise. To avoid any lengthy or complex motion correction procedures, multiple steps were taken to acquire phase-stable data. Our high-speed data acquisition helped in minimizing motion artifacts and phase noise. In addition, custom galvanometer waveforms for lateral beam scanning, and proper tissue mounting all combined to enable in vivo ISAM. The capability to visualize 3-D ISAM data in real-time enabled us to ensure proper imaging parameters for optimum ISAM reconstructions and to minimize the impact of axial and transverse movement, thus ensuring repeatable and reliable measurements. Figure 1 and Supplementary Video 2 demonstrate in vivo ISAM on the skin of a healthy human volunteer spanning a transverse field-of-view of 3.2 × 3.2 mm. The tomogram reveals the spiral structure of the sweat ducts characteristic of thick skin, and qualitatively, it is clear that neither motion nor phase noise corrupted the ISAM reconstruction. To verify this quantitatively, a random selection of sweat ducts were chosen and the cross-sectional diameters were measured. For standard OCT, the mean diameter was 114 μm (σ = 11 μm) and for ISAM the mean diameter was 61.5 μm (σ = 8.0 μm). The actual cross-sectional diameter of sweat ducts is known to range from 50 – 80 μm23 verifying that ISAM provides anatomically accurate reconstruction of tissue structure in vivo.
Figure 1. Real-time in vivo ISAM of healthy human skin from the fingerprint region of the index finger.

(a) Three-dimensional rendering comparing OCT (left) and ISAM (right). The spiral structure of the sweat ducts appear with higher resolution and higher signal-to-noise ratio in the ISAM dataset. (b) Representative en face planes (OCT left and ISAM right) with enlarged representative regions indicated by color-coded arrows showing the cross-section of the sweat ducts. The diameter of the sweat ducts obtained with ISAM more closely matches the known anatomical range of diameters. (c) En face planes at a (optical) depth of 780 μm below the surface showing enhanced resolution deeper, inside the superficial dermis. (See also Supplementary Video 2.) The scale bars represent 500 μm.
We then investigated the influence of focus placement on depth-dependent image quality using ex vivo mouse muscle. When conducting tomography with a high numerical aperture (NA) optical beam, we found that real-time tissue-dependent focus placement was crucial, and strongly affected the depth-dependent sensitivity of the resulting tomogram. Figure 2 compares two ISAM tomograms, one with the focus placed near the surface and the other with a deeply placed focus. We see that with the deeper focus, there is practically no loss of information near the tissue surface. Deep in the tissue though, where (due to the effects of optical scattering) there is naturally very low sensitivity, the image quality is dramatically improved with the deeper focus. We attribute this to the enhanced collection of singly backscattered light when the focus is placed deep in the sample. Real-time feedback is thus beneficial for optimizing depth-dependent image quality for a given tissue type. Image quality metrics such as anisotropy24 and contrast shown in Fig. 2 validate our results for deep focus placement.
Figure 2. Focus placement with real-time ISAM on ex vivo mouse muscle.
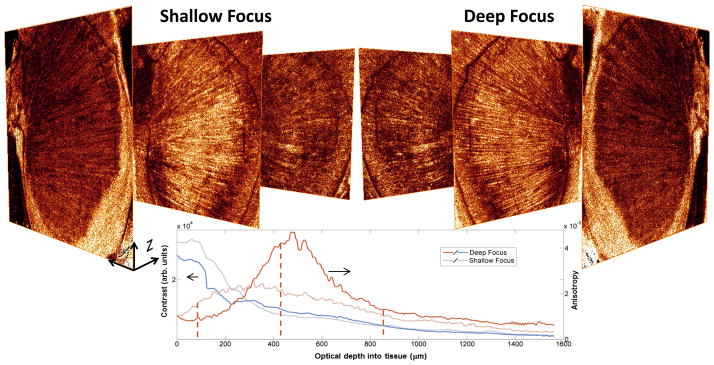
Left image stack shows three en face planes (depths denoted as dashed lines in the chart) from an ISAM tomogram with a focus placed shallow (310 μm) in the tissue. The right image stack shows the corresponding slices from an ISAM tomogram with the focus placed deeper (1000 μm) in the sample. The tomogram with a deep focus has a slight loss in signal near the surface, but deep in the sample, the strategically placed focus enhances fine muscle structures. These results are quantified using anisotropy and contrast as image quality metrics in the chart. En face planes shown have transverse dimensions of 3.2 × 3.2 mm.
We finally combine in vivo imaging with a strategically placed focus to image 1.2 mm (optical depth) in highly scattering healthy human skin on the wrist. Without sacrificing transverse resolution far from focus, we extend the depth-of-field by over an order of magnitude (24 Rayleigh ranges) in real-time. Figure 3 demonstrates that away from focus, not only does ISAM reveal the true structure obscured in OCT, but it also recovers proper constructive interference leading to an increase in signal-to-noise ratio (SNR). With our simplistic optical setup, we can achieve resolution, penetration depth, and sensitivity comparable to that of more complex imaging systems25. Clearly resolved in Fig. 3(b) are the stratum disjunction (SD), stratum corneum (SC), reticular dermis (RD), and subcutaneous fat (SF). In Fig. 3(a, c), the reticular dermis (a skin layer containing a network of small blood vessels) suffers from a large amount of blurring due to defocus. Figure 3(b, d) shows the resulting ISAM reconstruction where these features are brought back into focus. This point shows that ISAM produces better quality volumes over large depth ranges by improving two important properties used to measure the quality of images: resolution and SNR.
Figure 3. Real-time in vivo ISAM of skin from a healthy human wrist.
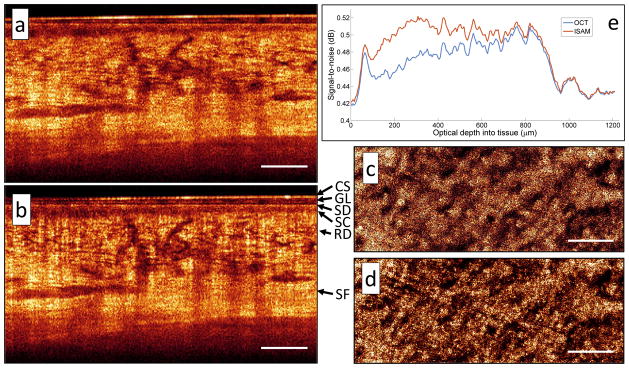
The optical focus was placed 1.2 mm deep inside the tissue and depth-of-field was extended by over an order of magnitude (24 Rayleigh ranges) in real time. A representative cross-sectional plane of (a) OCT and (b) ISAM processed dataset. CS: coverslip, GL: glycerol, SD: stratum disjunction, SC: stratum corneum, RD: reticular dermis, SF: subcutaneous fat. Cropped en face planes of (c) OCT and (d) ISAM at an optical depth of 520 μm into the tissue. (e) Variation of signal-to-noise (SNR) with depth. Compared to OCT, ISAM shows significant improvement over an extended depth range. Scale bars represent 500 μm.
In conclusion, the decomposition of Fourier-domain resampling with high-speed data acquisition coupled with real-time feedback enabled the first demonstration of in vivo 3-D ISAM. Our results, both qualitatively and quantitatively, show the ability of ISAM and strategic focus placement to enhance both the resolution and sensitivity throughout an extended volume. Furthermore by combining this technique with CAO19, computed optical imaging may have the capability to provide aberration-free 3-D tomography that can complement or replace more complicated optical setups for high-resolution retinal imaging. By using a higher NA optical setup in conjunction with these computational techniques, future work will pursue real-time cellular resolution tomography over an extended depth range. These advances for broadband computed interferometric tomography provide the capability of high-resolution deep-tissue volumetric imaging, with applications in time-sensitive situations such as image-guided surgery or optical biopsy for clinical screening applications.
Methods
Experimental setup
The imaging was performed using a 1300 nm SD-OCT system shown in Fig. S1. A superluminescent diode (SLD) with a bandwidth of 105 nm was used as the light source, giving an axial resolution of 9 μm. An identical pair of achromatic doublets with focal lengths of 30 mm was used to image the fiber core to the sample, resulting in a numerical aperture (NA) of 0.1. The Rayleigh range was calculated to be 50 μm (using 4.7 μm as the radius of the beam at the beam waist) while the imaging depth from the spectrometer (BaySpec, Inc.) was 2.8 mm in air. The beam was raster scanned along the fast-scanning and slow-scanning axes over the sample. Customized driving waveforms (85% linear, 15% fly-back) for the x-y galvanometer pair (SCANLAB, SCANcube® 7) were generated by a DAQ board (National Instruments, NI-PCIe-6353), which also generated a control signal to synchronize the scanning with the acquisition from the InGaAs line-scan camera (Goodrich, SU-LDH2). The camera was operated at the maximum A-scan rate of 91.912 kHz and was interfaced through an image acquisition board (National Instruments, NI-PCIe-1427). The software for data acquisition and graphical user interface was developed in LabVIEW and the data was processed in real-time through dynamic link library (DLL) function calls implemented in C (Microsoft Visual Studio 2008 environment). A computer with an Intel Core i7 processor (975 @ 3.3 GHz, 12 GB DDR3 RAM) was used for running the system and the compute unified device architecture (CUDA) extension v4.1 from NVIDIA was used for GPU kernel calls on the NVIDIA GeForce GTX 580 GPU. The ex vivo samples were placed on a three-axis stage separate from the beam collimator and scanning galvos while the in vivo data was taken by gently pressing the tissue of interest onto a custom mount attached to the SCANcube® and beam collimator. By attaching a coverslip mount directly to the lens tube containing the objective lens, which was attached to the scanning optics and fiber collimator, the phase stability requirements for ISAM could reliably be met. Acquired volumes consisted of 1024 pixels per A-scan and 810 A-scans along each transverse dimension resulting in an acquisition time of approximately 8.5 seconds.
GPU implementation
A multi-streamed GPU program was developed for real-time 3-D ISAM (see Supplementary Fig. S2) based on the resampling decomposition. The streams executed concurrently, performing two orthogonal 2-D ISAM reconstructions where one stream processed the fast-axis frames while the other stream processed the orthogonal dimension of the previously acquired, 2-D ISAM processed data. This decomposition required only a single volume buffer in GPU memory at any given time because each previously acquired slow-axis frame can be replaced by the currently acquired fast-axis frame. All the processing on the GPU was done with single precision floating point operations and gamma correction was applied on the processed data for display purposes. In this manuscript, the term “real-time” means that data acquisition was never paused for processing, and that data is continuously being updated for the user, albeit, the data being displayed is at a small latency of one volume. (8.5 seconds for the dimensions mentioned in Experimental setup). If we were to allow the camera to pause between volume acquisitions to complete the ISAM reconstruction, the latency would be reduced even further (to 1.5 seconds for the same volume). See Supplementary Methods for further details.
Image display and analysis
To remove any bias in displaying comparisons between OCT and ISAM, all comparisons were viewed on the same histogram scale using the same upper and lower saturation values. In real time, our system has the ability to both process and display cross-sectional and user-selected en face planes in the 2-D and 3-D ISAM reconstructions. In post-processing for further visualization, the calculated energy in each ISAM tomogram (en face plane by en face plane) was normalized to that of the OCT tomogram. After power-normalization, the noise floors in the OCT and the ISAM tomograms were in excellent agreement. To further visualize complete OCT and ISAM datasets, the tomograms were depth-normalized to a common histogram scale. The 3-D volume rendering in Fig. 1 was performed in Amira 5.4.2. The volume was first segmented into two regions, the stratum corneum/stratum lucidum (containing the sweat-ducts) and the dermis, then different color maps were used for each. Image metrics such as anisotropy, signal-to-noise ratio, and contrast were computed to quantitatively evaluate the improvement in reconstruction quality. The anisotropy image quality metric was originally devised24 to be sensitive to additive Gaussian noise in incoherent imaging systems. Further testing on various tissue phantoms and tissue data (data not shown) confirmed that this metric is reliable for noise present in OCT data as well. Signal-to-noise and contrast were computed by using the 20% (noise) and 90% (signal) quantiles of the intensity histograms.
Supplementary Material
Acknowledgments
We gratefully acknowledge Eric Chaney (University of Illinois at Urbana-Champaign) for providing the tissue samples used throughout this study, Dr. Daniel Marks (formerly at University of Illinois at Urbana-Champaign) for providing the tissue phantom, and Darold Spillman (University of Illinois at Urbana-Champaign) for administrative and information technology support related to this research. This research was supported in part by grants from the National Institutes of Health (R01 EB012479, S.A.B.) and an NIH Bioengineering Research Partnership (R01 EB013723, S.A.B.). A.A. was funded in part by the NIH National Cancer Institute Alliance for Nanotechnology in Cancer (Midwest Cancer Nanotechnology Training Center) Grant R25-CA154015A and Texas Instruments, Inc.
Footnotes
Author contributions
Experimental data was acquired by A.A., N.D.S., and S.G.A. Analysis and interpretation of data was carried out by A.A., N.D.S., and S.G.A. Additional processing and visualization was performed by A.A. and N.D.S. GPU code was written by A.A., N.D.S., and H.K., and reviewed by W.W.H. The manuscript was written and edited by all authors. S.A.B. and P.S.C. made seminal contributions to the core ideas carried out in this study, and obtained funding to support this research.
Supplementary information is available in the online version of the paper.
Reprints and permissions information is available online at www.nature.com/reprints.
Additional information can be found at http://biophotonics.illinois.edu.
Competing financial interests
S.A.B. and P.S.C are co-founders of Diagnostic Photonics, Inc., which is licensing intellectual property from the University of Illinois at Urbana-Champaign related to Interferometric Synthetic Aperture Microscopy. S.A.B. received patent royalties from the Massachusetts Institute of Technology for technology related to optical coherence tomography. Other authors declare no competing financial interests.
References
- 1.Boppart SA, et al. In vivo cellular optical coherence tomography imaging. Nat Med. 1998;4:861–865. doi: 10.1038/nm0798-861. [DOI] [PubMed] [Google Scholar]
- 2.Adler DC, et al. Three-dimensional endomicroscopy using optical coherence tomography. Nat Photon. 2007;1:709–716. [Google Scholar]
- 3.Liu L, et al. Imaging the subcellular structure of human coronary atherosclerosis using micro-optical coherence tomography. Nat Med. 2011;17:1010–1014. doi: 10.1038/nm.2409. [DOI] [PMC free article] [PubMed] [Google Scholar]
- 4.Vakoc BJ, et al. Three-dimensional microscopy of the tumor microenvironment in vivo using optical frequency domain imaging. Nat Med. 2009;15:1219–1223. doi: 10.1038/nm.1971. [DOI] [PMC free article] [PubMed] [Google Scholar]
- 5.Yun SH, et al. Comprehensive volumetric optical microscopy in vivo. Nat Med. 2006;12:1429–1433. doi: 10.1038/nm1450. [DOI] [PMC free article] [PubMed] [Google Scholar]
- 6.Drexler W, et al. Ultrahigh-resolution ophthalmic optical coherence tomography. Nat Med. 2001;7:502–507. doi: 10.1038/86589. [DOI] [PMC free article] [PubMed] [Google Scholar]
- 7.Ralston TS, Marks DL, Carney PS, Boppart SA. Interferometric synthetic aperture microscopy. Nature Phys. 2007;3:129–134. doi: 10.1038/nphys514. [DOI] [PMC free article] [PubMed] [Google Scholar]
- 8.Davis BJ, Marks DL, Ralston TS, Carney PS, Boppart SA. Interferometric Synthetic Aperture Microscopy: Computed Imaging for Scanned Coherent Microscopy. Sensors. 2008;8:3903–3931. doi: 10.3390/s8063903. [DOI] [PMC free article] [PubMed] [Google Scholar]
- 9.Davis BJ, et al. Nonparaxial vector-field modeling of optical coherence tomography and interferometric synthetic aperture microscopy. J Opt Soc Am A. 2007;24:2527–2542. doi: 10.1364/josaa.24.002527. [DOI] [PubMed] [Google Scholar]
- 10.Srinivasan VJ, Radhakrishnan H, Jiang JY, Barry S, Cable AE. Optical coherence microscopy for deep tissue imaging of the cerebral cortex with intrinsic contrast. Opt Express. 2012;20:2220–2239. doi: 10.1364/OE.20.002220. [DOI] [PMC free article] [PubMed] [Google Scholar]
- 11.Rolland JP, Meemon P, Murali S, Thompson KP, Lee K-s. Gabor-based fusion technique for optical coherence microscopy. Opt Express. 2010;18:3632–3642. doi: 10.1364/OE.18.003632. [DOI] [PubMed] [Google Scholar]
- 12.Rajadhyaksha M, Gonzalez S, Zavislan JM, Anderson RR, Webb RH. In vivo confocal scanning laser microscopy of human skin II: Advances in instrumentation and comparison with histology. J Invest Dermatol. 1999;113:293–303. doi: 10.1046/j.1523-1747.1999.00690.x. [DOI] [PubMed] [Google Scholar]
- 13.Beau AS, et al. In vivo endoscopic multi-beam optical coherence tomography. Phys Med Biol. 2010;55:615. doi: 10.1088/0031-9155/55/3/004. [DOI] [PubMed] [Google Scholar]
- 14.Leitgeb RA, Villiger M, Bachmann AH, Steinmann L, Lasser T. Extended focus depth for Fourier domain optical coherence microscopy. Opt Lett. 2006;31:2450–2452. doi: 10.1364/ol.31.002450. [DOI] [PubMed] [Google Scholar]
- 15.Blatter C, et al. Extended focus high-speed swept source OCT with self-reconstructive illumination. Opt Express. 2011;19:12141–12155. doi: 10.1364/OE.19.012141. [DOI] [PubMed] [Google Scholar]
- 16.Yasuno Y, et al. Non-iterative numerical method for laterally superresolving Fourier domain optical coherence tomography. Opt Express. 2006;14:1006–1020. doi: 10.1364/oe.14.001006. [DOI] [PubMed] [Google Scholar]
- 17.Yu L, et al. Improved lateral resolution in optical coherence tomography by digital focusing using two-dimensional numerical diffraction method. Opt Express. 2007;15:7634–7641. doi: 10.1364/oe.15.007634. [DOI] [PubMed] [Google Scholar]
- 18.Colomb T, et al. Numerical parametric lens for shifting, magnification, and complete aberration compensation in digital holographic microscopy. J Opt Soc Am A. 2006;23:3177–3190. doi: 10.1364/josaa.23.003177. [DOI] [PubMed] [Google Scholar]
- 19.Adie SG, Graf BW, Ahmad A, Carney PS, Boppart SA. Computational adaptive optics for broadband optical interferometric tomography of biological tissue. Proc of the Natl Acad Sci USA. 2012;109:7175–7180. doi: 10.1073/pnas.1121193109. [DOI] [PMC free article] [PubMed] [Google Scholar]
- 20.Hillmann D, Franke G, Lührs C, Koch P, Hüttmann G. Efficient holoscopy image reconstruction. Opt Express. 2012;20:21247–21263. doi: 10.1364/OE.20.021247. [DOI] [PubMed] [Google Scholar]
- 21.Kim MK. Tomographic three-dimensional imaging of a biological specimen using wavelength-scanning digital interference holography. Opt Express. 2000;7:305–310. doi: 10.1364/oe.7.000305. [DOI] [PubMed] [Google Scholar]
- 22.Ralston TS, Marks DL, Carney PS, Boppart SA. Real-time interferometric synthetic aperture microscopy. Opt Express. 2008;16:2555–2569. doi: 10.1364/oe.16.002555. [DOI] [PMC free article] [PubMed] [Google Scholar]
- 23.Wilke K, Martin A, Terstegen L, Biel SS. A short history of sweat gland biology. Int J Cosmetic Sci. 2007;29:169–179. doi: 10.1111/j.1467-2494.2007.00387.x. [DOI] [PubMed] [Google Scholar]
- 24.Gabarda S, Cristóbal G. Blind image quality assessment through anisotropy. J Opt Soc Am A. 2007;24:B42–B51. doi: 10.1364/josaa.24.000b42. [DOI] [PubMed] [Google Scholar]
- 25.Blatter C, et al. In situ structural and microangiographic assessment of human skin lesions with high-speed OCT. Biomed Opt Express. 2012;3:2636–2646. doi: 10.1364/BOE.3.002636. [DOI] [PMC free article] [PubMed] [Google Scholar]
Associated Data
This section collects any data citations, data availability statements, or supplementary materials included in this article.