Abstract
Widefield frequency-domain fluorescence lifetime imaging microscopy (FD-FLIM) is a fast and accurate method to measure the fluorescence lifetime, especially in kinetic studies in biomedical researches. However, the small range of modulation frequencies available in commercial instruments makes this technique limited in its applications. Here we describe a practical implementation of multi-frequency widefield FD-FLIM using a pulsed supercontinuum laser and a direct digital synthesizer. In this instrument we use a pulse to modulate the image intensifier rather than the more conventional sine wave modulation. This allows parallel multi-frequency FLIM measurement using the Fast Fourier Transform and the cross-correlation technique, which permits precise and simultaneous isolation of individual frequencies. In addition, the pulse modulation at the cathode of image intensifier restored the loss of optical resolution caused by the defocusing effect when the voltage at the cathode is sinusoidally modulated. Furthermore, in our implementation of this technique, data can be graphically analyzed by the phasor method while data are acquired, which allows easy fit-free lifetime analysis of FLIM images. Here our measurements of standard fluorescent samples and a Föster resonance energy transfer pair demonstrate that the widefield multi-frequency FLIM system is a valuable and simple tool in fluorescence imaging studies.
Keywords: Fluorescence lifetime, frequency-domain, wide-field, multi-frequency, sinusoidal modulation, pulse modulation, cross-correlation
Introduction
The fluorescence lifetime of a probe is a sensitive and important parameter for biological research because it can provide microenvironment information of a fluorophore and does not depend on local concentration (Berezin and Achilefu, ; Chen and Clegg, 2009; Dong and others, 2003). When combined with microscopy it is termed fluorescence lifetime imaging microscopy (FLIM). FLIM has become increasingly important in the modern microscopy research because it provides contrast of biological and other systems by differences in molecular microenvironments and molecular association, in addition to fluorescence intensity and spectrum measurements (Dong and others, 2003). FLIM in laser scanning microscope systems, i.e. confocal (Buurman and others, 1992; Morgan and others, 1992) and multiphoton (Gratton and others, 2003; Piston and others, 1992; So and others, 1995), are the most common forms in various labs around the world and also because many confocal microscope systems are commercially available. Laser scanning microscope systems usually have high spatial resolution, but slower data acquisition speed due to the nature of single-point detection. Instead, widefield FLIM system provides higher imaging speed because of massive parallel pixel acquisition (Clegg and others, 2003; Holub and others, 2001; Wu and others, 2012). In these systems, a fast time resolved camera system collects an entire lifetime image in parallel in a fraction of a second, which is particularly useful for kinetic studies of lifetime changes occurring in a large area.
Widefield FLIM can be implemented in two functionally equivalent ways: the frequency domain or the time domain (Dong and others, 2003). In frequency domain FLIM (FD-FLIM) systems, the fluorescence response of a repetitively excited florescence sample varies with the same frequency of the excitation. The fluorescence emission can be analyzed at the pixel base by determining the phase and the modulation of the fluorescence emission with respect to the excitation. However, for complex decays, i.e., for decay profiles containing more than one molecular species, a single modulation frequency is insufficient. Instruments that allow sequential measurement at multiple frequencies have been designed (Elder and others, 2006; Leray and others, 2009). In this case the intrinsic speed advantage of the camera based systems is partially lost since a sequence of images must be collected at different modulation frequencies. Also, the phase shifters used for producing the homodyne detection scheme are generally narrow band so that only a limited range of frequencies is available (Clegg and others, 2003). However, a complex decay waveform can be decomposed into sinusoidal components by Fourier analysis which provides separate Fourier components, i.e. the fundamental frequency and harmonics, of the fluorescence signal. These components can be determined easily and rapidly (Alcala, 1985; Feddersen and others, 1989). Hence we indicate this approach as parallel frequencies acquisition to distinguish from the serial frequency acquisition that is common in most of the FD-camera based systems. In the Fourier analysis, each component is independent of the other frequency components. At each Fourier component, multiple fluorescent molecules contribute linearly. Thus multiple molecular species contributing to each of these Fourier components can be extract easily by the phasor approach, which is becoming routine for the analysis of FD-FLIM due to its unique fit-free advantages as discussed previously (Digman and others, 2008). All above features offer the possibility to increase the speed and determine multiple molecular species in a single measurement and at the pixel level, which is the general case in the real biological imaging study, even when the data are being acquired. However, only few multi-frequency sequential widefield FLIM have been discussed so far (Elder and others, 2009; Elder and others, 2006; Leray and others, 2009; Schlachter and others, 2009; Squire and others, 2000), although multi-frequency instruments both sequential and parallel have been used in cuvette measurements for many years (Alcala and others, 1985; Gratton and B., 1986; Gratton and others, 1984). Moreover the cross-correlation technique, which can minimize the effect of photobleaching and DC background (Dong and others, 2003; Gratton and B., 1986; Spencer and Weber, 1969), was not utilized in current multi-frequency widefield FLIM instruments, mainly due to the complexity and high cost.
Recent developments in both excitation sources and electronics advance this technique in various aspects and make it possible to build a practical multi-frequency widefield FD-FLIM. Here we report a simple, low cost implementation. A pulse excitation source, which is suitable for multi-frequency lifetime measurement, is now commercially available in the form of the supercontinuum white laser from Fianium, Inc. This “white laser” not only provides picosecond (typically 6ps to 10ps) pulse train with excitation wavelength from UV to NIR (e.g. 390nm to 2,000nm), but also the pulse repetition rate is in the tens of MHz which is ideal for nano-second lifetime measurement. The pulse train is inherently composed of a large number of harmonics at integer multiples of the pulse repetition rate. In addition, the pulse excitation waveform has a higher photon efficiency than the typical sinusoidal waveform in FD-FLIM as reported earlier in (Elder and others, 2008; Philip and Carlsson, 2003; Schlachter and others, 2009), which means less photons are required to obtain a similar precision via the traditional sinusoidal excitation method.
Herein we also employed the cross-correlation technique in order to precisely isolate the phase and modulation information contained in a given frequency in the presence of many other closely spaced frequencies (Alcala and others, 1985). Due to advances in electronics, this technique can be easily achieved via a low cost direct digital synthesizer (DDS) with a full software control. In our design we use a narrow pulse to modulate the cathode of the image intensifier, instead of the traditional sinusoidal waveform (Clegg and others, 2003). This pulse modulation approach allows the parallel analysis of the multiple frequency components contained in the fluorescence signal excited by the laser pulse and it has the additional benefit of restoring the optical resolution loss, which is partially due to the sinusoidal modulation of the image intensifier gain in multi-frequency measurements.
EXPERIMENTAL SECTION
The multi-frequency Widefield Frequency-Domain Fluorescence Lifetime Microscope
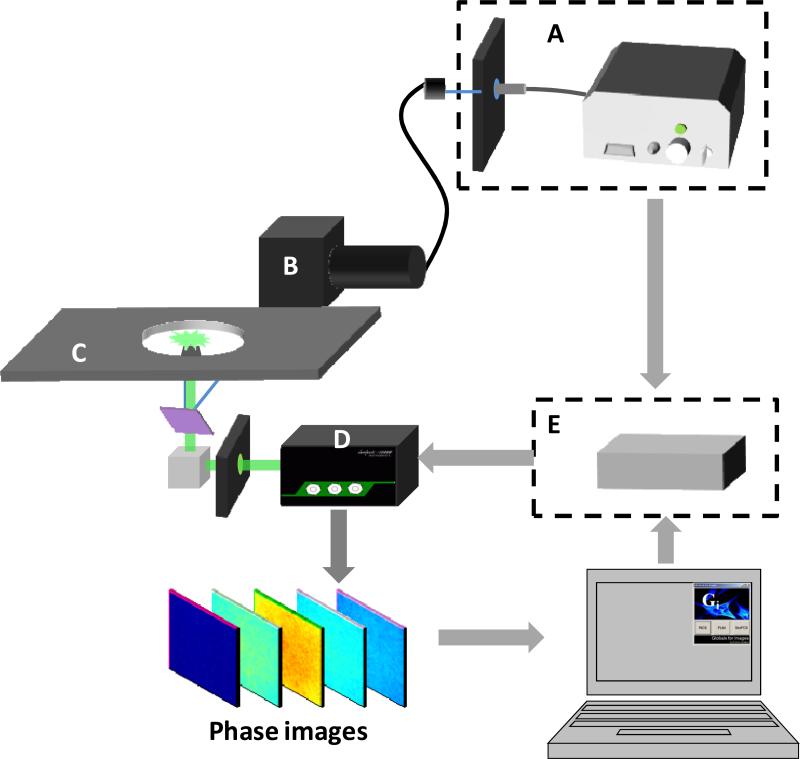
The system diagram is shown in figure 1. The multi-frequency widefield FD-FLIM was constructed based on a commercial Olympus TRIF microscope (Olympus, USA). The excitation source (Figure 1A) was a 20 MHz white-light supercontinuum laser (SC390, Fianium Inc, USA), which offers a broad spectrum range from 390nm to 2000 nm with an average power density > 1mW/nm. A heat blocker (KG-5, Edmund Optics, USA) was added into the excitation path to reduce the heat caused by the IR beam. A computer controlled filter-wheel (figure 1A) with eight bandpass filters was placed at the laser output to select a proper excitation wavelength. The filtered beam was then coupled to the Olympus TIRF arm via an optical fiber (Figure 1B). After entering the microscope (Figure 1C) through the TIRF pathway, the excitation beam was reflected to the sample by a Z488/594RPC TIRF dichroic mirror (Chroma, USA). TIRF measurements were done with a 60x (NA=1.45) oil-immersion objective. The fluorescence signal was collected by the same objective and passed the dichroic mirror. The bottom prism reflected this signal to the LI2CAM MD Intensified CCD (Lambert Instruments, Netherlands). An emission filter was used before the ICCD to collect the green fluorescence from the sample.
Figure 1.
Schematic of the widefield FD-FLIM system that permits multi-harmonic FLIM measurements. A) A 10ps, 20MHz supercontinuum laser (SC390, Fianium Inc, USA) was coupled into a commercial Olympus TRIF microscope (Olympus, USA) via a fiber. Bandpass filters were used to select proper excitation wavelengths. A heat blocker (KG-5, Edmund Optics, USA) was added into the excitation path to reduce the heat. B) The excitation beam was reflected to the samples by a Z488/594RPC TIRF dichroic mirror (Chroma, USA). C) Experiments were done with a 60x (NA=1.45) oil-immersion TIRF objective (Olympus, USA). The fluorescence signal was collected by the same objective. D) The bottom prism reflected this signal to a LI2CAM MD Intensified CCD (Lambert Instruments, Netherlands). The ICCD was controlled by a computer for modulation of intensifier and data acquisition. E) The DDS (409B, Novatech) was synchronized with the white laser and controlled by the same computer to generate the sinusoidal modulation signal. A FPGA based pulse generator was developed for the pulse modulation approach.
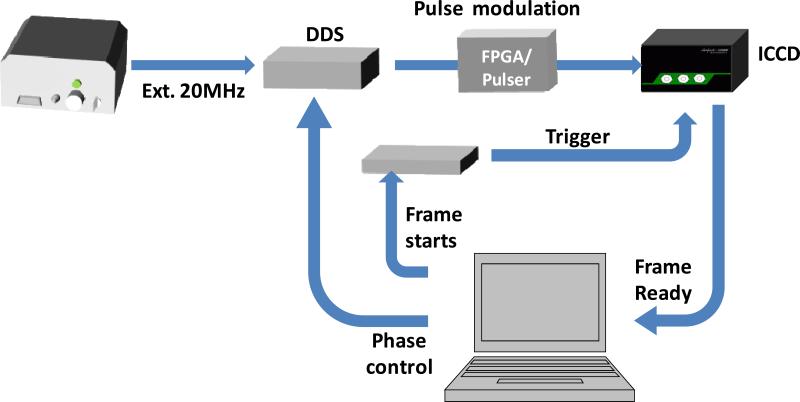
The ICCD is composed by an image intensifier and a fast CCD camera (Figure 1D). The camera was connected to a computer via a USB port for imaging acquisition. MCP voltage and voltage bias of the intensifier were controlled by an electronic unit which was connected to the same computer through another USB port. Figure 1E represents the various electronic units used for modulation and cross-correlation detection, which is explained in details in Figure 2. Figure 2 shows the logical connections between the various units. The ICCD has a trigger input to initiate the image acquisition and an RF input to modulate the intensifier. The computer sends a signal to the DDS to advance the phase of the RF modulation signal and simultaneously initiates the camera exposure. When the frame is ready, the camera sends a signal to the computer which transfers the frame and initiates another phase acquisition. The camera is capable of transferring 15fps at full frame size (1392×1040). A sequence of 32 image phases can be obtained in about 2s. At smaller frame sizes, the camera can operate at higher speed. Of course, acquisition at a smaller number of phases will also increase the speed of FLIM data acquisition.
Figure 2.
Schematic of the electronic synchronization signals. The DDS was synchronized with the white laser and controlled by a computer to generate the sinusoidal signal. In the sine-modulation method, this phase-controlled modulation signal was attenuated by 20dB before sending to ICCD. The input signal, Vin=100mV, was amplified by a 36dB internal power amplifier. The amplified modulation signal Vpp = 6.4V together with the variable DC offset was applied to the photocathode of the image intensifier to control the on/off. In the pulse modulation method, the sinusoidal signal from DDS was sent to a pulse generator, which was built with a FPGA board, Xilinx Spartan 6, to convert the sinusoidal waveform to a pulse train. The input signal to the ICCD was also controlled to be 100mV. When ICCD was ready, the computer sent two signals to advance the phase of the modulation signal and trigger the ICCD to acquire images. Phase images were then transferred to the computer via a USB port and analyzed by SimFCS software.
The cross-correlation scheme was adopted here. Detailed description of this technique can be found elsewhere (Gratton and B., 1986). In general, the cathode of the intensifier can be gated on/off within ~ 5ns. It was modulated at a high frequency FM, which is close to the laser frequency Fe, i.e. 20MHz here, by a small frequency Δf (usually several Hz). Mixing of the high frequency fluorescence signal (Fe) with the high frequency gating (FM) generates a low cross-correlation frequency signal at Δf. One phase image was acquired only during a particular phase step or fraction of each Δf cycle. Image series with different phases from 0 to 2π were acquired within one Δf heterodyne cycle. The signal can be averaged over many modulation cycles at each phase step. With this phase-image series, the demodulation and phase delay of the fluorescence signal at each pixel and at each harmonic frequency can be determined by the Fourier Transform (Feddersen and others, 1989; van Munster and others, 2005). Therefore the decay at each pixel can be obtained accurately in a single pass. To account for the instrument response function, the system response was calibrated with a fluorophore of known lifetime under the same conditions. This calibration was valid for all Fourier components. After the calibration, data can be analyzed during acquisition graphically by the phasor approach (Digman and others, 2008). To perform the heterodyne operation, a Direct Digital Synthesized (DDS) signal generator (409B, Novatech) was synchronized to the laser frequency, i.e. 20 MHz (Figure 2). It can generate the sinusoidal modulation signal, 20 MHz + Δf, with 0.1 Hz resolution and variable phases with 0.02° resolution via the software.
RESULTS AND DISCUSSION
Characteristics of Image intensifier
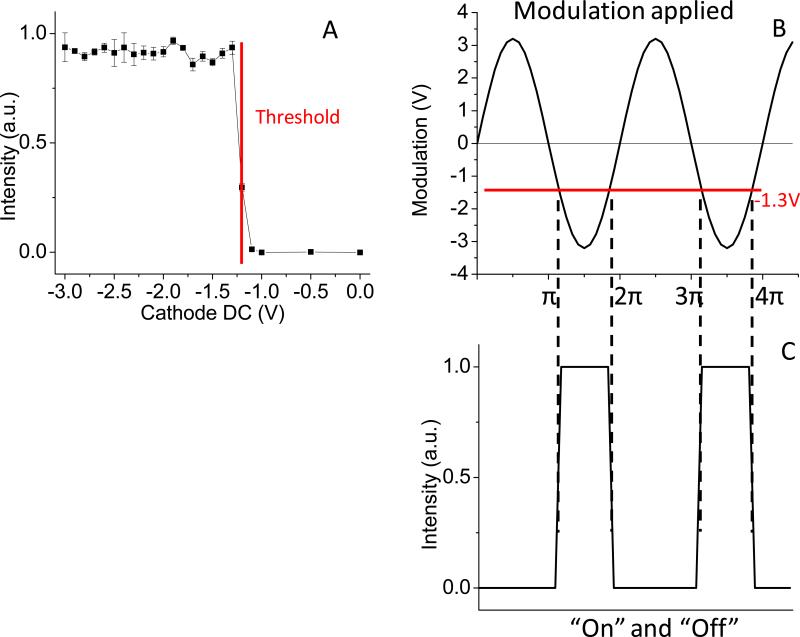
The intensifier can work either in “on” or “off” states controlled by the voltage applied on the photocathode. By measuring the intensity from a uniform fluorescent sample with different voltages, the DC gain characteristics are shown in Figure 3A. At −1V the intensifier is off. The transition voltage is about −1.2 V, whereas the full opening is at −1.3V. Depending on the position of the offset, the sinusoidal modulation (Figure 3B) leads to turn on (passing the red threshold line in Figure 3B) and off the intensifier with a square waveform effectively, as shown in Figure 3C. Hence offsetting the sinusoidal modulation around the −1.3V threshold can control the on/off time of the intensifier, e.g. shifting the modulation signal to positive will narrow down the opening time of the cathode and eventually approach to a short pulse waveform at the cathode, typically this pulse could be several nanoseconds long.
Figure 3.
Characteristics of Image intensifier. A) The intensifier can be turned on with a 0.1V change at the cathode. The threshold of fully opening is −1.3V. The gain becomes constant when the voltage < −1.3V until ~−20V as indicated by Lambert Inc. B-C) A sinusoidal modulation applied on the cathode turns on/off the intensifier producing a quasi square waveform. The offset around the −1.3V threshold controls the on/off time of the intensifier.
In our system the intensifier can be modulated either by a sine wave signal or by a pulse. For sine-wave modulation, the signal out of the DDS unit was attenuated by 20dB before sending to the control unit of the intensifier, because of the safe input level indicated by the ICCD manufacturer (Lambert Inc). The input signal, Vin = 100mV, was then amplified by a 36dB power amplifier internal to the driver unit. The amplified modulation signal, Vpp = 6.4V, together with the DC offset voltage was applied to the cathode of the intensifier. Hence the intensifier was turned on and off at this frequency as shown in Figure 3. In the pulse modulation configuration, the sine-wave modulation signal from DDS was sent to a pulse generator (realized in a FPGA board using a Xilinx Spartan 6E) to convert the waveform to a pulse train with 4.5ns width. The pulse train was also attenuated to Vin = 100mV and sent to the control unit. Effectively, a pulse modulation signal, Vpp = 6.4V, together with the DC offset voltage was used to control the intensifier on and off.
Contributions from high-harmonic components
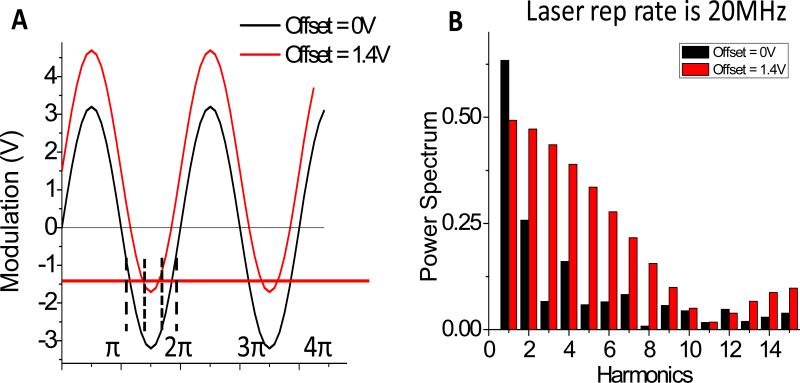
As we discussed above, the picosecond pulse excitation and the nano-second square-wave opening of photocathode allow parallel multi-frequency measurements. To check the availability of t harmonic content in the signal, we directly measured the laser reflectance from a glass at the sample position of the microscope with 32 phase steps in one cross-correlation cycle. Figure 4A shows the diagram of modulation applied on the intensifier with 0V or +1.4V offset. One modulation cycle is ~ 50ns from 0 to 2π. High harmonic contributions were calculated and are shown in Figure 4B. With 0V offset (black in Figure 4B), 2nd to 15th harmonics can be observed. But their contributions are minor at harmonics > 2nd. Instead at +1.4V offset (red in Figure 4B), we obtained up to 15th harmonic components and the contributions from high harmonics are significant till 8th, which means we could obtain lifetime information at multi-harmonics of the laser repetition rate up to 160 MHz in one measurement, although contributions from different harmonics are not equal. Higher-harmonic components can be observed by using +1.5V offset due to a narrower opening time of cathode, however the intensities from phase images dropped dramatically due to the low duty cycle (data not shown) and are not useable.
Figure 4.
Harmonic content of the widefield FD-FLIM system. A) The diagram indicating the application of different offset voltages to the cathode of the intensifier. B) High harmonic contributions were obtained from the measurement of laser reflection. At 0V offset (black), 2nd to 15th harmonics were measurable but their amplitudes were not significant at harmonic > 2nd. At +1.4V offset (red), high harmonics were significant until the 8th harmonics.
The number of harmonics that can be obtained is limited by the number of phase steps in each cycle (Nyquist theorem). The meaningful frequencies will depend on the lifetime of the actual fluorescence probes, typically from 10 MHz to 150 MHz for lifetime from 1 ns to 10 ns. When certain frequencies are required to be separated from the fundamental and other harmonics, the number of phase steps must be increased correspondingly. More phase steps sampled per cross-correlation period result in a better discrimination of the various harmonics and hence increases the accuracy at certain frequencies, but with a slower imaging speed due to the increased number of phase images required. For example, to study the fast kinetics of lifetime, 4 phase steps (single frequency measurement at 20 MHz) will allow a lifetime measurement in 0.3 second. To obtain the 7th harmonics (i.e. 140 MHz here), 16 phase steps are necessary, which will lead to a measurement time of 1.2 second. Of course, lifetime data at multi-frequencies can be obtained simultaneously, which can be used to study multi-components systems. In practice, average of many cycles could be necessary to increase the accuracy (Feddersen and others, 1989) at the expenses of measurement speed.
Defocusing effect and correction by pulse modulation
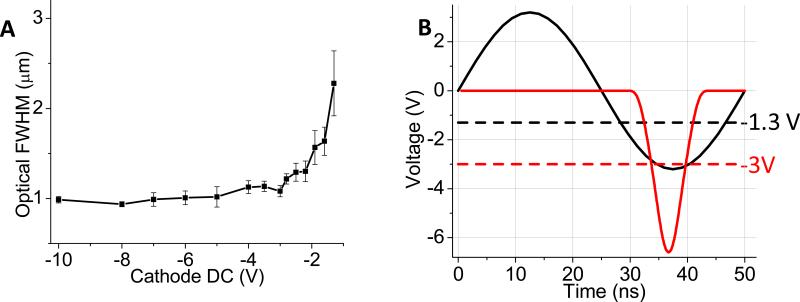
Defocusing effect exists in all cathode-modulated intensifiers. During a certain period of the modulation, the voltage is too low and the generated secondary electrons are not sufficiently accelerated to avoid lateral spreading before hitting the MCP. To evaluate this effect in our system, 40 nm green-yellow fluorescent beads were imaged to compare the FWHM at different cathode voltages with a 472/30 excitation filter and a 535/50 emission filter (Semrock, USA). The result is shown in Figure 5A, when the cathode voltage < −3V. The FWHM was optimized at 1 μm with 60x oil objective and a given optical magnification in the emission arm. At the cathode voltage > −3V, the FWHM was expended which means the loss of optical resolution. We noticed that the optimal resolution was not close to the diffraction limit ~200nm. It is mainly due to the fiber optics in ICCD as indicated by Lambert, Inc. Additional optical magnification could be used in the emission path to improve the resolution.
Figure 5.
Defocusing effect and correction by the pulse modulation method. A) FWHM of a 40nm fluorescent bead at different cathode voltages. When the cathode voltage < −3V, the FWHM was optimized at 1 μm; whereas the cathode voltage > −3V, the FWHM was larger which means images were blurred. Thus the modulation voltage needs to be < −3V for optimal optical resolution. B) Diagram of the pulse modulation and the sinusoidal modulation. With the pulse method, the intensifier is fully opened in a very short period and hence high-harmonics are obtained. The effective “on” voltage at cathode can be < −3V which implies image quality is optimized.
Thus in terms of image quality, the modulation voltage required to turn on the intensifier needs to be < −3V. However as we discussed in relation to Figure 4, to obtain high-harmonic contents, the sinusoidal modulation needs to be shifted towards positive voltages in order to get a narrow “on” time of intensifier. In this situation, the effective “on” voltage at cathode is close to −1.3V as shown in Figure 4A (the red curve), and obviously image quality would be compromised. Even with 0V offset (the black curve in Figure 4A), the focus of secondary electrons is retained only during a small portion of “On” time when the voltage < −3V. During the other “On” time when −1.3V > Vmodulation > −3V, the defocusing effect compromises the overall spatial resolution.
To overcome this limitation, the cathode can be modulated by a 4.5ns pulse train with the same Vpp = 6.4V as the sinusoidal waveform. In our system, the sinusoidal RF signal from the DDS was used to trigger a FPGA based pulse generator. The output pulse train was attenuated and sent to the intensifier controller for cathode modulation. Effectively, a pulse train (Vpp = 6.4V) with DC offset was applied to the photocathode (shown in Figure 5B). Under this condition, the intensifier was turned on for a very short period, i.e. 4.5ns, and hence high-harmonics were available. Because the effective “On” voltage at the cathode can be < −3V and the “On” time between −1.3V and −3V can be ignored, image quality was also retained. Furthermore, only a sharp pulse was applied during one period in comparison with the sinusoidal waveform, the energy consumption at the cathode was much less and hence less heating. Therefore the system stability was improved and even high voltage can be applied to the photocathode in case of very weak signals.
Sample measurements
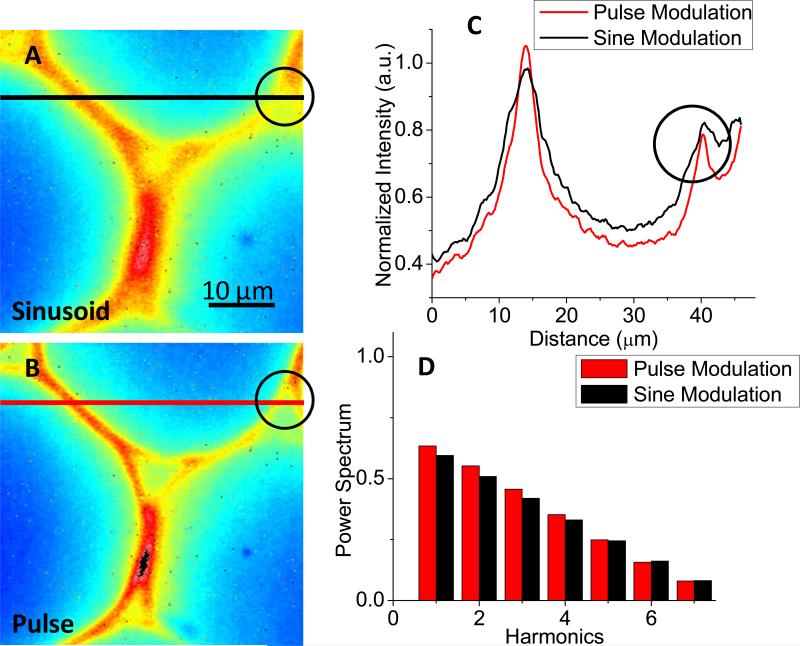
To demonstrate the operation of our instrument, we measured fluorescence samples as described below. First, a convularia sample was imaged and compared with 16 phase steps (up to 140 MHz) under the sinusoidal and pulse modulation, respectively. A 472/30 excitation filter and a 535/50 emission filter were used. The exposure time was 100 ms and the MCP voltage was 800V, phase images were averaged over 320 cycles. The modulation waveforms applied on cathode were similar to Figure 5B, but with +1.4V offset. This offset allows high-harmonic contents even under sinusoidal modulation as we showed in Figure 4. The result is shown in Figure 6. Figure 6A and 6B show in-phase images under the sinusoidal and pulse modulations, respectively. Line profiles at the same position in both images are shown in Figure 6C. Clearly the optical resolution is better with the pulse method. Details in black circles in Figure 6A and 6B are distinguishable with the pulse modulation, but not with the sinusoidal modulation.
Figure 6.
Comparison of the pulse modulation and the sinusoidal modulation. The offset was +1.4V. The exposure time was 100 ms and the MCP voltage was 800V. Measurement was done with 16 phase-steps and 320 frames for average. A-B), a convularia sample was imaged with the pulse modulation and sinusoidal modulation methods, respectively. C) Line profiles at the same position in A and B. The optical resolution is better with the pulse modulation method. Details in the black cycles in A to B are distinguishable. D) The harmonic components obtained in A and B.
In the pulse method, the effective voltage at cathode was −5V with ~4.5ns width and thus both high-harmonic contributions and image quality were obtained. In the sinusoidal modulation, the effective voltage was −1.8V, which could not achieve a good focus for the secondary electrons on MCP and led to the loss of optical resolution, although the narrow “On” time allowed high-harmonic components as shown in Figure 6D. Therefore we conclude that the pulse modulation method is ideal for both image quality and high-harmonic measurement in our widefield FLIM system.
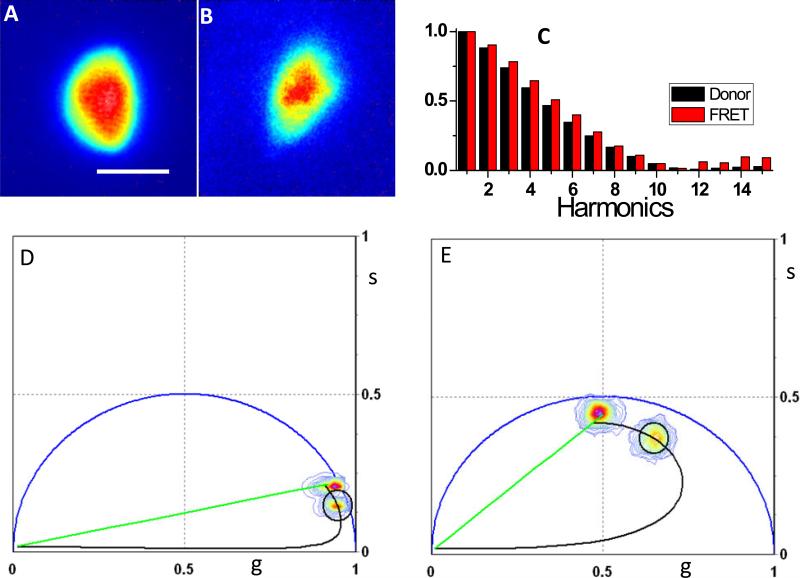
We measured Föster resonance energy transfer (FRET) in CHO-K1 cells. FRET is a mechanism describing energy transfer between two chromophores. It is extremely sensitive to small distances. Hence measurements of FRET efficiency can be used to study the molecular interactions. Our camera system allows FRET measurement at multi-harmonics by using the phasor FRET calculator. As a demonstration, Figure 7 shows CHO-K1 cells transiently transfected with Cerulean (A) or Cerulean-Venus FRET constructs (B), respectively. The measurement was done with the pulse modulation method and 32 phase steps. Coumarin 6 probe with known lifetime of 2.5ns was used as reference. The cathode DC offset was +1.0V. The MCP voltage was set to 900V. The excitation filter was 438/24nm whereas the emission filter was 475/35nm for donor fluorescence imaging. Figure 7C shows normalized power spectra of the donor only cell (cerulean) and the FRET cell (cerulean-Venus). In Figure 7D and 7E, the FRET donor-only calculator (SimFCS program, available at www.lfd.uci.edu) was used to measure the FRET efficiency in the FRET sample cells (B) based on the information of unquenched donor phasor measured using the cell in (A) at 20 MHz and 100 MHz as examples. The FRET efficiency obtained from this analysis was 0.38+/−0.01 using the harmonic frequencies from 20 MHz to 100 MHz, which is the most useful range for typical FLIM measurements. Meanwhile higher frequencies are also possible based on the power spectra in Figure 7C.
Figure 7.
Determination of FRET efficiency at multi-frequencies. Images of CHO-K1 cells expressing A) cerulean donor and B) Cerulean-Venus FRET constructs. C) Normalized power spectra of the donor only cell and the FRET cell. D) 20 MHz and E) 100 MHz phasor plot. The phasor calculator was used to determine graphically the FRET efficiency of Cerulean-Venus cell. Scale bar is 10 μm.
CONCLUSIONS
We report here a practical implementation of parallel multi-frequency widefield FD-FLIM based on the cross-correlation technique. A pulsed supercontinuum laser, a low cost DDS and the phasor analysis method simplified the system construction and data analysis. They also provided a large range of harmonics for parallel multi-frequency detection. Moreover, the pulse modulation at the cathode of image intensifier overcame the defocusing effect and restored the loss of optical resolution caused by the traditional sinusoidal modulation. Our demonstration shows that widefield parallel multi-frequency FLIM can be an important technique in fluorescence imaging area, especially for dynamic process in complicated biological systems. Furthermore, the widefield nature allows coupling of this system to other widefield fluorescence microscope easily. For example, here we constructed the system based on a TIRF microscope, and the applications of FLIM measurement on the TIRF mode is undergoing. Other microscopy techniques such as spinning disk or single plane illumination (SPIM) microscopy can benefit of this development as well.
ACKNOWLEDGMENT
We thank Dr. Cosimo Arnesano for the development of the FPGA pulser circuit. This work was supported by grant numbers: NIH-P41-RRO3155, P41 GM103540 and P50-GM076516.
REFERENCES
- Alcala JR, Gratton E, Jameson DM. A Multifrequency Phase Fluorometer using the Harmonic Content of a Mode-Locked Laser. Anal. Instrum. 1985;14:225. [Google Scholar]
- Alcala RJ, Gratton E. A Multifrequency Phase Fluorometer Using the Harmonic Content of a Mode-Locked Laser. Analytical Instrumentation. 1985;14:225–250. [Google Scholar]
- Berezin MY, Achilefu S. Fluorescence Lifetime Measurements and Biological Imaging. Chemical Reviews. 2012;110(5):2641–2684. doi: 10.1021/cr900343z. [DOI] [PMC free article] [PubMed] [Google Scholar]
- Buurman EP, Sanders R, Draaijer A, Gerritsen HC, van Veen JJF, Houpt PM, Levine YK. Fluorescence lifetime imaging using a confocal laser scanning microscope. Scanning. 1992;14(3):155–159. [Google Scholar]
- Chen Y-C, Clegg R. Fluorescence lifetime-resolved imaging. Photosynthesis Research. 2009;102(2):143–155. doi: 10.1007/s11120-009-9458-7. [DOI] [PubMed] [Google Scholar]
- Clegg RM, Holub O, Gohlke C, Gerard Marriott IP. Methods in Enzymology. Academic Press; 2003. Fluorescence lifetime-resolved imaging: Measuring lifetimes in an image. pp. 509–542. [DOI] [PubMed] [Google Scholar]
- Digman MA, Caiolfa VR, Zamai M, Gratton E. The Phasor Approach to Fluorescence Lifetime Imaging Analysis. Biophysical journal. 2008;94(2):L14–L16. doi: 10.1529/biophysj.107.120154. [DOI] [PMC free article] [PubMed] [Google Scholar]
- Dong CY, French T, So PTC, Buehler C, Berland KM, Gratton E, Leslie W, Paul M. Methods in Cell Biology. Academic Press; 2003. Fluorescence-Lifetime Imaging Techniques for Microscopy. pp. 431–464. [DOI] [PubMed] [Google Scholar]
- Elder A, Schlachter S, Kaminski CF. Theoretical investigation of the photon efficiency in frequency-domain fluorescence lifetime imaging microscopy. J. Opt. Soc. Am. A. 2008;25(2):452–462. doi: 10.1364/josaa.25.000452. [DOI] [PubMed] [Google Scholar]
- Elder AD, Kaminski CF, Frank JH. ϕ2FLIM: a technique for alias-free frequency domain fluorescence lifetime imaging. Opt. Express. 2009;17(25):23181–23203. doi: 10.1364/OE.17.023181. [DOI] [PubMed] [Google Scholar]
- Elder AD, Matthews SM, Swartling J, Yunus K, Frank JH, Brennan CM, Fisher AC, Kaminski CF. The application of frequency-domain Fluorescence Lifetime Imaging Microscopy as a quantitative analytical tool for microfluidic devices. Opt. Express. 2006;14(12):5456–5467. doi: 10.1364/oe.14.005456. [DOI] [PubMed] [Google Scholar]
- Feddersen BA, Piston DW, Gratton E. Digital parallel acquisition in frequency domain fluorimetry. Review of Scientific Instruments. 1989;60(9):2929–2936. [Google Scholar]
- Gratton E BB. Multifrequency phase fluorometry using pulsed sources: Theory and applications. Spectroscopy. 1986;1(6):28–36. [Google Scholar]
- Gratton E, Breusegem S, Sutin J, Ruan Q, Barry N. Fluorescence lifetime imaging for the two-photon microscope: time-domain and frequency-domain methods. Journal of Biomedical Optics. 2003;8(3):381–390. doi: 10.1117/1.1586704. [DOI] [PubMed] [Google Scholar]
- Gratton E, Jameson DM, Hall RD. Multifrequency Phase and Modulation Fluorometry. Annual Review of Biophysics and Bioengineering. 1984;13(1):105–124. doi: 10.1146/annurev.bb.13.060184.000541. [DOI] [PubMed] [Google Scholar]
- Holub O, Seufferheld MJ, Gohlke C, Govindjee G, Clegg RM. Fluorescence Lifetime Imaging (FLI) in Real-Time - a New Technique in Photosynthesis Research. Photosynthetica. 2001;38(4):581–599. [Google Scholar]
- Leray A, Riquet FB, Richard E, Spriet C, Trinel D, Héliot L. Optimized protocol of a frequency domain fluorescence lifetime imaging microscope for FRET measurements. Microscopy Research and Technique. 2009;72(5):371–379. doi: 10.1002/jemt.20665. [DOI] [PubMed] [Google Scholar]
- Morgan CG, Mitchell AC, Murray JG. Prospects for confocal imaging based on nanosecond fluorescence decay time. Journal of Microscopy. 1992;165(1):49–60. [Google Scholar]
- Philip J, Carlsson K. Theoretical investigation of the signal-to-noise ratio in fluorescence lifetime imaging. J. Opt. Soc. Am. A. 2003;20(2):368–379. doi: 10.1364/josaa.20.000368. [DOI] [PubMed] [Google Scholar]
- Piston DW, Sandison DR, Webb WW. Time-resolved fluorescence imaging and background rejection by two-photon excitation in laser-scanning microscopy. Proc. SPIE. 1992;1640:379–389. [Google Scholar]
- Schlachter S, Elder AD, Esposito A, Kaminski GS, Frank JH, van Geest LK, Kaminski CF. mhFLIM: Resolution of heterogeneous fluorescence decays in widefield lifetime microscopy. Opt. Express. 2009;17(3):1557–1570. doi: 10.1364/oe.17.001557. [DOI] [PubMed] [Google Scholar]
- So PTC, French T, Yu WM, Berland KM, Dong CY, Gratton E. Time-resolved fluorescence microscopy using two-photon excitation. Bioimaging. 1995;3(2):49–63. [Google Scholar]
- Spencer RD, Weber G. Measurements of Subnanosecond Fluorescence Lifetimes with a Cross-Correlation Phase Fluorometer. Ann. NY Acad. Sci. 1969;158:361–376. [Google Scholar]
- Squire, Verveer, Bastiaens Multiple frequency fluorescence lifetime imaging microscopy. Journal of Microscopy. 2000;197(2):136–149. doi: 10.1046/j.1365-2818.2000.00651.x. [DOI] [PubMed] [Google Scholar]
- van Munster EB, Gadella TWJ, Rietdorf J. Microscopy Techniques. Springer Berlin; Heidelberg: 2005. Fluorescence Lifetime Imaging Microscopy (FLIM). pp. 1301–1303. [Google Scholar]
- van Munster EB, Goedhart J, Kremers GJ, Manders EMM, Gadella TWJ. Combination of a spinning disc confocal unit with frequency-domain fluorescence lifetime imaging microscopy. Cytometry Part A. 2007;71A(4):207–214. doi: 10.1002/cyto.a.20379. [DOI] [PubMed] [Google Scholar]
- Wu Q, Guo S, Ma Y, Gao F, Yang C, Yang M, Yu X, Zhang X, Rupp RA, Xu J. Optical refocusing three-dimensional wide-field fluorescence lifetime imaging microscopy. Opt. Express. 2012;20(2):960–965. doi: 10.1364/OE.20.000960. [DOI] [PubMed] [Google Scholar]


