

Abstract
Tracking neuroprogenitor cells (NPCs) that are used to target tumors, infarction or inflammation, is paramount for cell-based therapy. We employed ultrasound imaging that can detect a single microbubble because it can distinguish its unique signal from those of surrounding tissues. NPCs efficiently internalized positively charged microbubbles allowing a clinical ultrasound system to detect a single cell at 7 MHz. When injected intravenously, labeled NPCs traversed the lungs to be imaged in the left ventricle and the liver where they accumulated. Internalized microbubbles were not only less sensitive to destruction by ultrasound, but remained visible in vivo for days as compared to minutes when given free. The extended longevity provides ample time to allow cells to reach their intended target. We were also able to transfect NPCs in vitro when microbubbles were preloaded with GFP plasmid only when cells were insonated. Transfection efficiency and cell viability were both greater than 90%.
Keywords: Ultrasound, Neural progenitor cell, Microbubble, Stem cell tracking, Gene delivery
1. Introduction
Stem cell and progenitor cell based therapy is increasingly used to treat cancers, immunological disorders, neurodegenerative diseases, myocardial infarction and stroke [1,2]. Because neuroprogenitor cells (NPCs) naturally home to diseased regions within the central nervous system following direct injection or intrathecal or intravenous administration, they have been exploited as carriers [3–5]. Genetically modified NPCs have been proposed to treat genetic disorders or cancer [6] as they are capable of disseminating bioactive molecules such as retroviral and herpes vectors [7], as well as transgenes or prodrug activating enzymes [8]. For this purpose, transfecting NPCs to express the desired gene in only the intended target, would increase specificity and more important, would increase safety since cells that accumulate outside their intended target would remain silent.
As a prerequisite to the use of stem cells or progenitor cells as drug or gene carriers, it is important to track their accumulation in sites of interest in vivo [9,10], particularly if image-guided drug release or activation is contemplated. Effective labeling of stem cells and progenitor cells [11] have been achieved with reporter genes [12] for nuclear imaging, fluorescent dyes for optical imaging [13,14], iron oxide nanoparticles [15] and perfluorocarbon emulsion for magnetic resonance imaging with a range of minimal detectable cell concentration limits from few hundred to tens of thousands of cells per cm3 of tissue [16–19].
Ultrasound (US) is extremely sensitive to its gas-filled microbubbles (MB)-based contrast agents that are approved for clinical use worldwide. It can detect a single MB [20] because MBs not only reflect a strong signal due to their large acoustic impedance mismatch with tissues, but they also oscillate when exposed to US emitting unique signals that allow for near complete real-time tissue subtraction to generate a large contrast to noise ratio [21]. Although the ability to load MBs into stem cells has been presented [22], the ability to image these cells in vivo and the sensitivity of US to MB-loaded cells are not known. We hypothesized that MBs loaded into NPCs would allow for in vivo tracking of implanted NPCs using US imaging. The advantage of US for cellular imaging is not only its high sensitivity to MBs, but also its high sub-millimeter spatial resolution and its high 10s of milliseconds temporal resolution allowing realtime observation. Further, US is non-ionizing, portable allowing its use at the bedside and in the operating room, and is available worldwide easing translation. More important for cell-based therapy, MB oscillation induced by US can release pre-loaded cargo such as genes directly into the cytosol regardless of whether MBs are within endosomes or attached to the cell surface [21]. Although MB-based US transfection has been demonstrated in vitro and in vivo [9], transfection efficiency and cell viability when cells with internalized MBs are exposed to US is not known. Should DNA-carrying internalized MBs transfect cells to express the desired gene only when exposed to US, it would allow this approach to not only document cell accumulation at the site of interest, but also activate the cells on demand only in the site of interest.
In this study we present the successful labeling of NPCs with MBs and the assessment of MB longevity within NPCs to determine the viability of this approach since free MBs last for only several minutes in vivo. We also present the ability to image these MB-loaded NPCs with US, define the minimum number of cells that can be detected, and document these observations in vivo. We also present preliminary in vitro data that NPCs loaded with DNA-carrying MBs can be transfected and cells survive the US transfection process to express the gene.
2. Materials and methods
2.1. Preparation of MBs
The fluorocarbon gas-filled MBs encapsulated in a lipid shell were prepared by sonicating (Sonic Dismembrator, Fisher Scientific) a lipid mixture covered by per-fluorohexane vapor. To promote cellular uptake the lipid shell was made with a net positive charge by mixing 2.5 mmol 1, 2-distearoyl-sn-glycero-3-phosphocholine (DSPC), 1.4 mmol 1,2-stearoyl-3-trimethylammonium-propane (DSTAP) (Avanti Polar lipids) and 1.6 mmol Polyoxyethylene 40 stearate (Sigma) and the gas-filled MBs collected by flotation and washing with saline. To produce fluorescently labeled MBs, the lipid soluble dyes DiI (1, 1-dioctadecyl-3,3,3,3-tetramethylindocarbocyanine perchlorate) or DiD (1,1-dioctadecyl-3,3,3,3-tetramethylindodicarbocyanine) (Invitrogen Inc.) were added to the lipid mixture before sonication. The size distribution and concentration of MB suspensions were determined by electrozone sensing with a Coulter Multisizer 4 (Beckman-Coulter, Inc.).
2.2. NPC preparation
Mouse neural progenitor cells (C17.2) were kindly provided by Dr. Evan Snyder (Sanford-Burnham Medical Research Institute). NPCs were cultured in Dulbecco's modified Eagle medium (DMEM) containing 4.5 g/L glucose and 1 mm sodium pyruvate supplemented with 10% FBS, 5% horse serum, 2 mm glutamine, 0.25 g/ml Fungizone, and antibiotics (100 U/ml penicillin, 100 g/ml streptomycin sulfate). All cells were cultured in a humidified incubator at 37 °C with 5% CO2. NPCs were passaged every 2–3 days.
2.3. MB labeling of NPCs
106 NPCs/ml were plated in each of a 24-well plate and cultured for 24 h when they became approximately 80% confluent. 35 μl containing 35,000 MBs was added to each well along with 3 ml serum-free DMEM. The entire plate was then covered with sterile parafilm and inverted to float the MBs against the adherent NPCs. Following 2 h of incubation at 37 °C, the cells were washed with DPBS (Dulbecco's phosphate buffered-saline) three times to remove all free MBs. Cell viability was assessed by Trypan blue staining and was >85% before and after MB-labeling.
2.4. Harvesting of MB-labeled NPCs
Once NPCs are labeled and washed from free MBs, they were trypsinized with 0.05% Trypsin/EDTA solution at 37 °C for 2 min and mechanically dissociated to a single cell suspension. Trypsin digestion was stopped by adding a double volume of medium and overdigestion was avoided by checking the detachment under a microscope. The cell suspension was then centrifuged for 5min at 4 °C and 250 × g. Although well labeled NPCs became buoyant and floated to the top, we also collected cell pellets whose cells contained fewer MBs/cell. Cells were resuspended, counted with a hemocytometer (Fisher Scientific) and their viability assessed with trypan blue exclusion. The MB-labeled NPC suspension was then adjusted to yield approximately 4 × 10⁶ live NPCs/ml.
2.5. MB labeling of NPCs for microscopy
NPCs were grown for 24 h on the cover slip of a Dvorak–Stotler-controlled environment chamber and then treated with poly-d-lysine (Sigma Chemical) for 30 min at 37 °C before using. After the cells adhered to the cover slip, the cover slip was sealed into the holder with a Teflon seal and the chamber assembled to produce an enclosed (airtight) system such that the cells were on the interior non-dependent surface. The chamber was positioned onto a confocol stage and its temperature maintained at 37 °C with a heating apparatus. Cells were perfused with pre-warmed DMEM. Once a representative microscopic field was selected, DiI-labeled MBs were infused into the chamber that floated against the cell layer. Time-lapse 12-bit image acquisition was performed using the 543 nm laser line on the Zeiss LSM510 META confocal microscope (Carl Zeiss, Inc.). Corresponding differential interference contrast images were also acquired simultaneously using the transmitted light detector. Confocal z-sections were acquired using a × 100/1.4 NA-Plan-Apochromatic objective lens. For 3D time-lapse imaging, 11 contiguous 0.8 μm thick sections were acquired every minute for 30 min. The DiI positive pixels were orthogonally reconstructed using Volocity software (Improvision). The Z-stack projections of confocal micrographs were assembled using ImageJ software (National Institutes of Health, Bethesda).
2.6. Assessment of internalized MB survival in vitro
Seven flasks were plated with only 105 NPCs each to lengthen the time to confluence. Two days later, 109 MB were added to each flask, the flask filled with growth media, inverted and incubated overnight. All free MBs were then removed by washing the adherent NPCs 3 times with PBS. One flask was processed each day thereafter by performing microscopy and then harvesting the NPCs and counting them as described above. All harvested washed NPCs were then gently suspended in 3 ml of 0.8% low melting point agarose at 40 °C to ensure that bubbles are not introduced and used to fill the bulb of a transfer pipette. Using US gel for proper contact the 15L8 transducer of a Siemens Sequoia 512 imaging system (Siemens Medical Solutions, Mountain View, CA) was placed against the outer wall of the pipette for imaging. This scanner is equipped with a proprietary Contrast Pulse Sequencing (CPS) MB specific imaging technique that is extremely efficient at eliminating all non-MB originating signals to produce a MB only image. Because the MB only image has no echoes without the presence of MBs, a dual display is used where half the image is the MB only image and the other a standard B-mode image reconstructed from the same acquired US data to help orient the sonographer to the anatomy in the imaging field. Both long and short axis views of the pipette were obtained at 7 MHz central transmit frequency at low acoustic pressure (0.1 MI).
2.7. Defining the minimal detectable cell count by US in vitro
NPCs were cultured, labeled with MBs, harvested washed and counted as described above. Serial dilutions of 20,000, 2,000, 200, 20, and 2 MB-labeled NPCs/ml in DMEM with 10% FBS were prepared and mixed in 0.8% low melting point agarose to yield a 3 ml volume that was used to fill the bulb of a transfer pipette. We then used the Siemens Sequoia scanner to acquire both a long and short axis views of the pipette at 7 MHz and low MI as describe above.
2.8. Free and internalized MB behavior in an US field
The behavior of free MBs, and MBs internalized by NPCs were observed in vitro using a custom setup that allows the delivery of focused US pulses at the optical focus of a microscope. NPCs were cultured, labeled with MBs, and harvested. Without washing the free MBs, the NPC suspension was infused into a custom fabricated microchip chamber which was comprised of a coverslip bonded to a slab of PDMS with a 15 μm-deep molded well. The chamber was immersed in a water tank while the cover slip remained above the water surface and secured to a 3D stage (Fig. 2). US pulses were delivered from a submerged, spherically focused 2.25 MHz transducer (V305-Su, Panametrics) with a waterproof connector cable (BCU-58-6W, Panametrics). The US pulse was confocal to the light source and microscope focal plane. The transducer was driven by a 300 W amplifier (VTC2057574 Vox Technologies) connected to an arbitrary waveform generator (PCI 5412, National Instruments) controlled by a custom designed Labview 8.2 program. Each 2.25 MHz pulse lasted for 10 ms with an acoustic intensity of 1.5 MPa. The samples in the microwell chamber allowed positioning a single MB-labeled NPC in the center of the optical field. Optical images at 1024 × 1024 resolution were captured by the camera (Photron FASTCAM 1024 PCI) that was operating at 60 frames per second through a 100X oil immersion Nikon objective (N/A=1.4) as each of 4 US pulse were delivered.
Fig. 2.
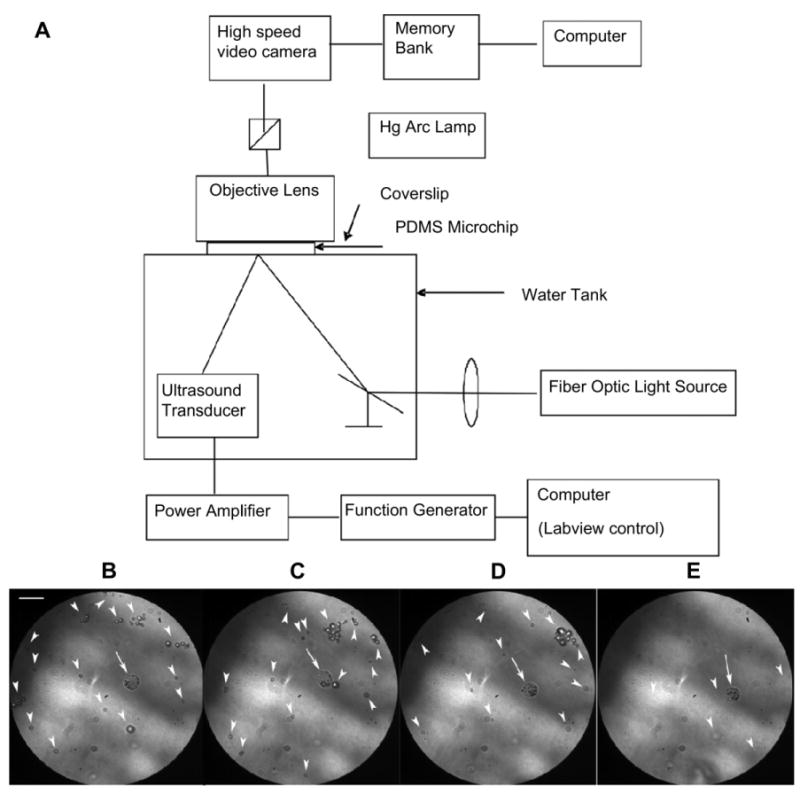
Optical observation of a MB-labeled NPC during insonation at 2.25 MHz and 1.5 MPa peak negative pressure. (A) Schematic of the experimental setup. Note that the focal points of the ultrasound pulse, the microscope, and the light were identical; (B–E) Representative frames from the high speed camera before (B) and following the 1st, 2nd, and 4th consecutive US pulses. Note that MBs within the NPC (arrow) remained intact after the 4th pulse while the many free MBs (arrowheads) diminished in number (E). All free MBs (arrowheads) were recognized from artifacts based on the video recording (See Supplement video) (Scale bar = 10 μm).
2.9. In vitro transfection of MB-labeled NPCs
The plasmid GFP was cloned into Escherichia coli stem DH5α. For preparation, DNA was purified using a standard method (QIAfilter Plasmid Mega Kit, Qiagen, CA, USA), and attached to the positively-charged MBs via electrostatic interaction by gently mixing a 10 μg of plasmid solution with 50 μl of MBs (6 × 108 MB/ml) for 30 min at room temperature. Free DNA was then removed by washing the MB suspension twice with PBS and centrifugation at 1500 rpm for 30 s. Thirty six hours after NPCs were seeded in a 24-well plate, they were labeled with the DNA-carrying MBs as described above. After 1 h incubation, free MBs were washed and half the wells exposed for 30 s to US radiation using a sonoporation device (SoniGene System, VisualSonics, Toronto, Canada) at 2.25 MHz, 2 W/cm2, and 50% duty cycle. NPC cultures underwent all the manipulationas as above, except MBs were not added. Forty hours later, NPCs were evaluated microscopically for GFP expression, harvested and assessed for viability with trypan blue exclusion.
2.10. In vivo imaging of MB-labeled NPCs
All animal research protocols conformed to institutional guidelines for animal research and were approved by the Institutional Animal Care and Research Advisory Committee at the University of California, San Diego.
2.10.1. Heart imaging
Nu/Nu nude mice (Charles River Laboratories, Inc.) were anesthetized by injecting 50 mg/kg ketamine and 10 mg/kg acepromazine cocktail intraperitoneally. With the mice positioned on a heated plate, the right jugular vein was exposed and a 0.047 in OD, 0.025 in ID silicone tubing (Fisher Scientific Inc.) was inserted using a 26G needle. After cleaning the hair from the chest wall, the VFX 13-5 transducer of a Siemens Antares scanner was placed over the heart and fixed in position. Once images were optimized, dynamic range, gain settings, and focus were kept constant. Real-time imaging at 5 MHz center frequency at 0.2 MI was initiated as 250 μl of MB-labeled NPCs (2 × 10⁶ cells/ml) was infused and was observed for approximately 1 min. All mice recovered quickly and had grossly normal neurological function, activity, and eating behavior before they were euthanized.
2.10.2. Liver imaging
NPCs were cultured, labeled with MBs, harvested, washed and counted as described above. Twelve 6-8-week-old normal NIH Swiss female mice (Harlan Sprague Dawley) were maintained in a specific pathogen-free vivarium for a minimum of 3 days before the experiments. Prior to imaging, each mouse was anesthetized by isoflurane in an induction chamber and maintained with a continuous flow of 1–3% isoflurane at 1L/min using medical air. Depth of anesthesia was assessed by pinching the animal's toe while monitoring their breathing. Mice were placed supine on a heating pad and hair over the abdomen clipped and thoroughly removed by exfoliating cream. Mice were treated with 20 μg sodium nitroprusside intravenously prior to NPC administration to minimize cell entrapment in the lungs [23,24].
The 15L8 linear transducer of the Siemens Sequoia scanner was positioned over the liver and the largest cross-section of the liver identified. The scanner was then set for CPS imaging in a dual display mode at 7 MHz central frequency and 0.1 MI using 80 dB dynamic range. Except for overall gain adjustments between sessions, all parameters were kept constant throughout the entire 5-day liver imaging study. While imaging the largest liver cross-section at 1 frame/second to minimize MB destruction, 250 μl of MB-labeled NPCs (6 × 10⁶ cells/ml) were injected intravenously in 8 mice or 250 μl of free MBs (1.7 × 109 MB/ml) in the remaining 4. When peak liver enhancement occurred, imaging was stopped and animals were allowed to recover. At 8 h and then again each day for 5 days, the largest liver cross-section was imaged with the identical imaging parameters as before. To again find the largest liver cross-section the liver was scanned at 1 frame/second and this required less than 10 frames in all animals. When only a few echoes were found, a different plane was imaged at a higher MI of 0.2 and 0.3. Still US images as well as video clips of the liver were recorded for each mouse at each time point for post processing.
To quantify liver enhancement, a representative image from each time point was analyzed with ImageJ. A region of interest was drawn over the liver and the mean videointensity recorded. The liver videointensity of all mice in each group was grouped for each time point including the pre-injection images and the mean and standard error of the mean (SEM) calculated. Statistical significance of liver videointensity was assessed using a 2-way analysis of variance with time and MB formulation (free vs. NPC-loaded) as independent variables.
2.11. Immunohistochemistry
NPC were plated and grown to 80% confluence in two separate flasks, labeled with MBs as described above, and washed. Both flasks were pulsed with a 10 μm nucleoside analog bromodeoxyuridine (BrdU) for 24 h to reach the greatest incorporation of BrdU [25]. One flask was used to assess BrdU incorporation using a flow cytometry kit (BD Pharmingen; San Diego, CA) that was repeated at least once for confirmation. NPCs were harvested from the other flask and 4 × 10⁵ NPCs injected intravenously into 3 normal mice, the mice killed 24 h later by CO2 asphyxiation, and the liver removed and fixed by immersion in 10% neutral buffered formalin. Livers were then embedded in paraffin and 3 μm thick sectioned placed on a glass slide for immunohistochemistry processing. Sections were deparaffinized with 3 washes in xylene and serial washes in 100, 95 and 70% ethanol, followed by 3 final washes in PBS. Endogenous peroxidase was deactivated by 30 min incubation in freshly prepared 3% H2O2/methanol. For DNA denaturation, sections were incubated for 2 h in 50% formamide/2× standard saline citrate (0.3m NaCl and 0.03 m sodium citrate) at 65 °C, rinsed for 5 min in 2× standard saline citrate, incubated for 30 min in 2 N HCl at 37 °C, and rinsed for 10 min in 0.1 m boric acid (pH 8.5). Several rinses in PBS were followed by incubation in PBS/0.1% Triton X-100/3% normal horse serum (PBS-Ths) for 30 min. Sections were incubated with biotinylated mouse anti-BrdU antibodies at room temperature for 1 h. After rinsing in PBS, sections were incubated with Streptavidin-Peroxidase for 10 min and then washed and re-incubate with substrate buffer, DAB and 0.6% Hydrogen Peroxide concentrate according to manufacturer's recommendations (BrdU kit, Invitrogen, Carlsbad, CA) to develop intense brown staining of BrdU-labeled nuclei. Tissue sections were counterstained with Hematoxylin, and an uncoated Superfrost slides cover slip (Fisher Scientific, Santa Clara, CA) with Permount mounting medium on its surface was placed over the tissue slice for microscopy. Hematoxylin and eosin staining was also performed on paraffin-embedded sections.
2.12. Immunofluorescence
The livers were removed and cryopreserved in 30% sucrose in phosphate buffer. Livers were cut in 30-μm sections on a sliding microtome and stained for BrdU to identify prelabeled NPCs, which had undergone active mitosis before transplantation, and nestin, an intermediate filament characteristically expressed in undifferentiated and proliferating progenitor cells. Sections were also treated for DNA denaturation, as described above, followed by several rinses with PBS. The sections were then blocked in 5%BSA + 0.3% triton X-100/PBS for 1 h. The sections were then double-stained with primary antibodies, mouse PE-conjugated anti-nestin (1:100; BD Pharmingen, San Diego, CA) together with mouse FITC-conjugated anti-BrdU (BD Pharmingen, San Diego, CA) (1:100 diluted in 1%BSA+0.3% triton X-100 + PBS) at 4 °C overnight. Sections were then rinsed several times in PBS, prior to mounting on slides with fluorescent mounting medium (DAKO, Carpenteria, CA).
Fluorescent images were obtained with a LSM510 META laser-scanning confocal microscope. Co-localization studies were done of FITC-labeled BrdU (1:100) and PE-labeled nestin (1:100). Images were processed and merged via Adobe Photoshop software.
2.13. Statistical analysis
Experiments were performed at least in triplicate unless otherwise indicated. Statistical analysis was performed using GraphPad Prism version 5 for Windows (GraphPad Software, San Diego, California, USA). Mean values and standard deviations were calculated, and the statistical significance determined using two-tailed Student's t test, one-way or two-way ANOVA as appropriate. Data are expressed as the means ± SEM. A p-value < 0.05 was considered statistically significant.
3. Results
3.1. NPCs labeled with MBs
We manufactured positively charged MBs to promote phagocytosis. The MB suspension contained 1.68 ± 0.3 × 109 MB/ml with a mean diameter of 1.13 ± 0.42 μm (Fig. 1A). Labeled NPCs were evaluated with differential interference contrast microscopy that showed a large number of MBs adhered to or were internalized by NPCs during incubation (Fig. 1B). Trypsinization to harvest the cells had no effect on MB labeling, as the trypsinized NPCs still contained on average 3–4 MBs (Fig. 1C). Trypan blue staining showed >90% cell viability after labeling.
Fig. 1.
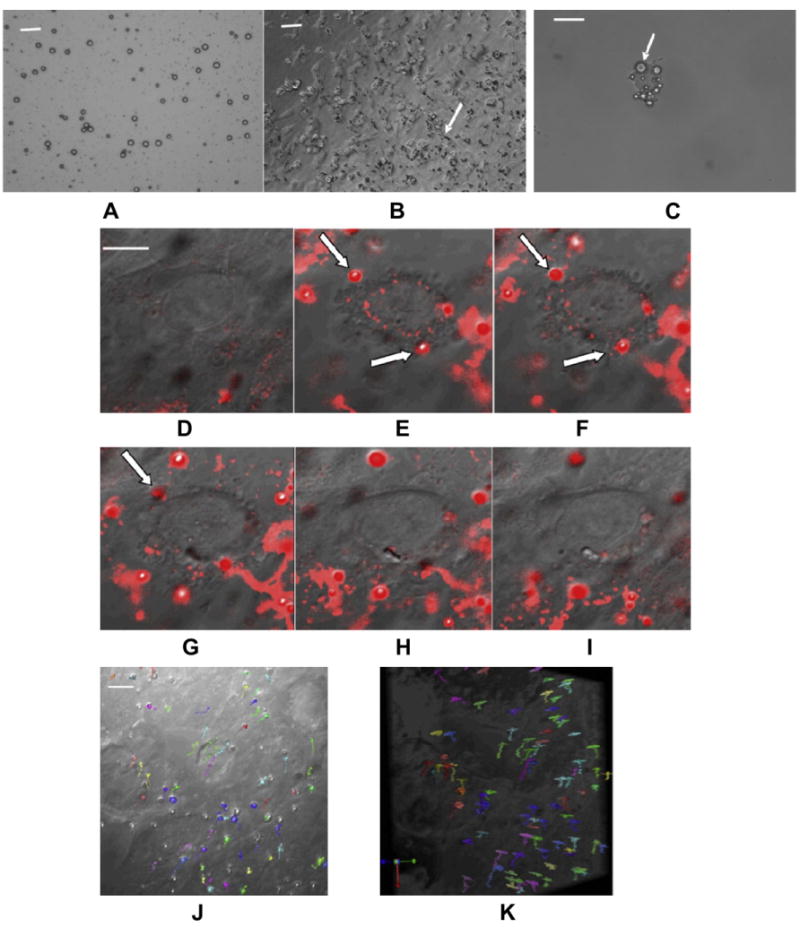
Labeling NPCs with cationic perfluorocarbon gas-filled MBs and tracking single bubbles inside NPCs. (A) DIC image of MB suspension (Scale bar = 10 μm). MBs are dark circles due to light diffraction; (B) DIC image of NPCs labeled with MBs (Scale bar = 20 μm); (C) A single trypsinized NPC containing multiple MBs (arrows) (Scale bar = 10 μm); (D–I) Time course showing the internalization of several MBs by NPCs (arrow) that disappear as they move out of the 0.8 μm slice (Scale bar = 10 μm); (J, K) On-end (J) and side view (K) of the 3-D stack acquired over an 8.8 μm thick slab shows the movement of MBs (each colored arrow) within the volume without localizing to a specific location (Scale bar = 10 μm).
MBs were then labeled with lipophilic dyes DiD or DiI and fluorescence confocal microscopy was used to visualize MB uptake by NPCs during the first 30 min after MBs were added to the culture. Dye density on the MB shell was sufficient to allow the detection of single MBs and track their uptake by NPCs (Fig. 1D–I). Frames from videos of the MB internalization process showed that MBs first adhered to the cell membrane and then entered the cell. Confocal microscopy of an 8.8-μm slab in 11 0.8 μm section was acquired every minute for 30 min to allow the study of MB mobility within the slab (Fig. 1J and K). It showed that MBs moved to different depth and did not cluster, suggesting that MBs moved passively within the cytoplasm.
3.2. Labeled NPCs and MB behavior in the US field
A custom setup was used that allows high resolution high speed capture of microscopic images of an optically transparent microchip chamber when US pulses are applied at the optical focus. We placed a suspension of free MBs and MBs loaded within NPCs within the chamber as 4 consecutive 10 ms pulses of US were delivered at 2.25 MHz and 125 W/cm2. Representative frames from the video are shown in Fig. 2. Note that only few free MBs remained in the field of view while the internalized MBs remained intact (see supplementary video), suggesting that internalized MBs are less sensitive to US.
3.3. Detection limit of MB-labeled NPC's with US
Washed MB-labeled NPCs were embedded in 0.8% low melting point agarose in serial dilutions from 2 to 20,000 cells/ml of agarose by factors of 10, and imaged at low acoustic pressure (MI = 0.1) using a Siemens Sequoia 512 scanner (Siemens Medical Solutions, Mountain View, CA) equipped with a proprietary Contrast Pulse Sequencing (CPS) MB specific imaging technique (Fig. 3). There were five detectable bright echoes out of the expected 6 cells in the 3 ml of agarose phantom at the lowest concentration. This indicates that US can detect a single MB-loaded cell. As expected, increasing cell concentration increased the number of bright echoes on the US image.
Fig. 3.
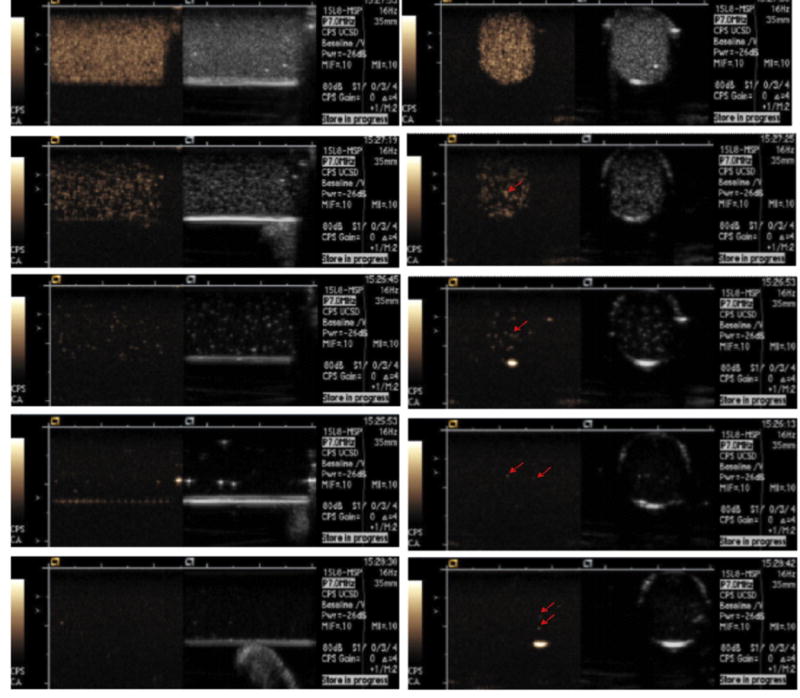
Longitudinal (left column) and axial (right column) ultrasound dual display images of the 3-ml agarose phantom containing MB-labeled NPCs. The left hand image of the dual display is the CPS MB only image and the right hand image is the standard US image. From top to bottom the NPC concentration is 20,000, 2,000, 200, 20, and 2 cells/ml, respectively. Bright echoes (arrows) are MB-labeled NPCs. Five independent echoes were seen at the 2 cells/ml within the 3 ml agarose phantom, two of which are visible on one 1.5 mm thick axial image (arrows in bottom right image) indicating that a single cell can be detected.
3.4. MB survival within NPCs in vitro
The same number of NPCs were plated and were then labeled with the same number of MBs in seven flasks and washed from free MBs. One flask was utilized each day for cell counting and MB detection by microscopy and US. For US imaging, cells were harvested and suspended in 0.8% low melting point agarose and imaged with the Sequoia scanner. MB-labeled NPCs were very echogenic and caused mild attenuation of the far field at 1 day, became sparse by day 4 but were still detectable on day seven (Fig. S1).
3.5. NPC transfection with DNA-carrying MBs
NPCs or NPCs loaded with MBs carrying the GFP plasmid DNA were exposed to US in vitro (2.25 MHz, 2 W/cm2, and 50% duty cycle). GFP-carrying MB-loaded NPCs underwent all the manipulations except US was not applied. GFP expression was assessed 48 h after US exposure and cell viability assessed with Trypan blue exclusion. NPCs loaded with GFP-carrying MBs exposed to US expressed GFP indicating that they survived the US transfection process (Fig. 4 left). NPCs without MBs exposed to US did not express GFP as would be expected, and few NPCs with GFP-carrying MBs not exposed to US showed GFP expression (Fig. 4 middle and right). Cell density at 48 h after transfection was similar and cell viability was >90% in all three preparations.
Fig. 4.
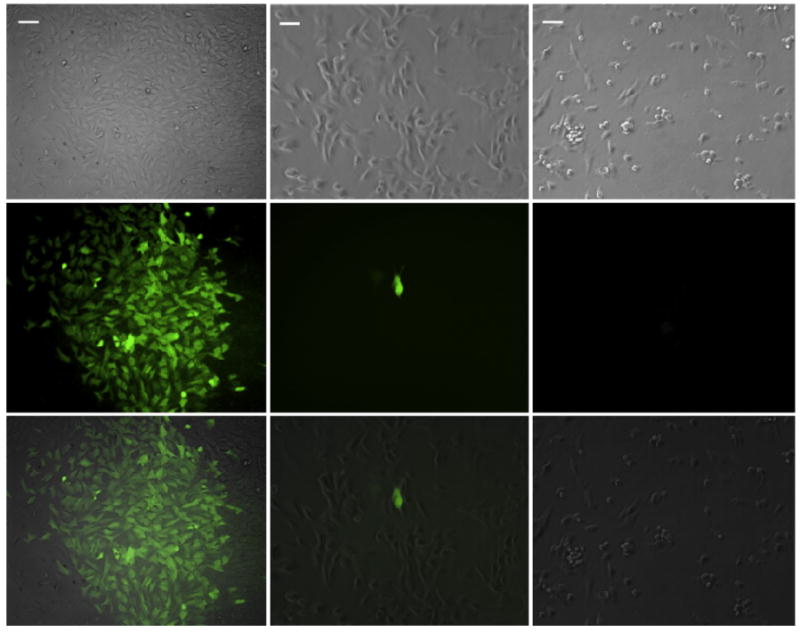
In vitro MB-aided Transfection of NPC with US. Bright-field (top row), epifluorescence (middle row), and their overlay (bottom row) were acquired 48 h after US exposure of MB-loaded NPCs (left column) and non-MB-loaded NPCs (right column) or MB-loaded NPCs not exposed to US (middle column). Note the characteristic appearance of NPCs on bright field and the green fluorescence from the GFP expressing cells after US exposure of MB-loaded NPCs (left column). Very few cells expressed GFP without US exposure, one of which is shown in the middle column. As expected without MBs, US exposure did not elicit GFP expression. (Scale bar = 40 μm).
3.6. In vivo imaging
Harmonic real-time imaging of a mouse heart was performed using the Siemens Antares scanner (Siemens Medical Solutions, Mountain View, CA) at 5 MHz central frequency and low acoustic pressure (0.2 MI) during the intrajugular injection of 250 μl of MB-labeled NPCs (2 × 10⁶ cell/ml). Note that the left ventricular lumen filled with echoes indicating that not only were the MB-labeled cells visible on US in vivo (Fig. 5A), but a significant number of MB-loaded NPCs passed the lungs to reach the left ventricle and systemic circulation.
Fig. 5.
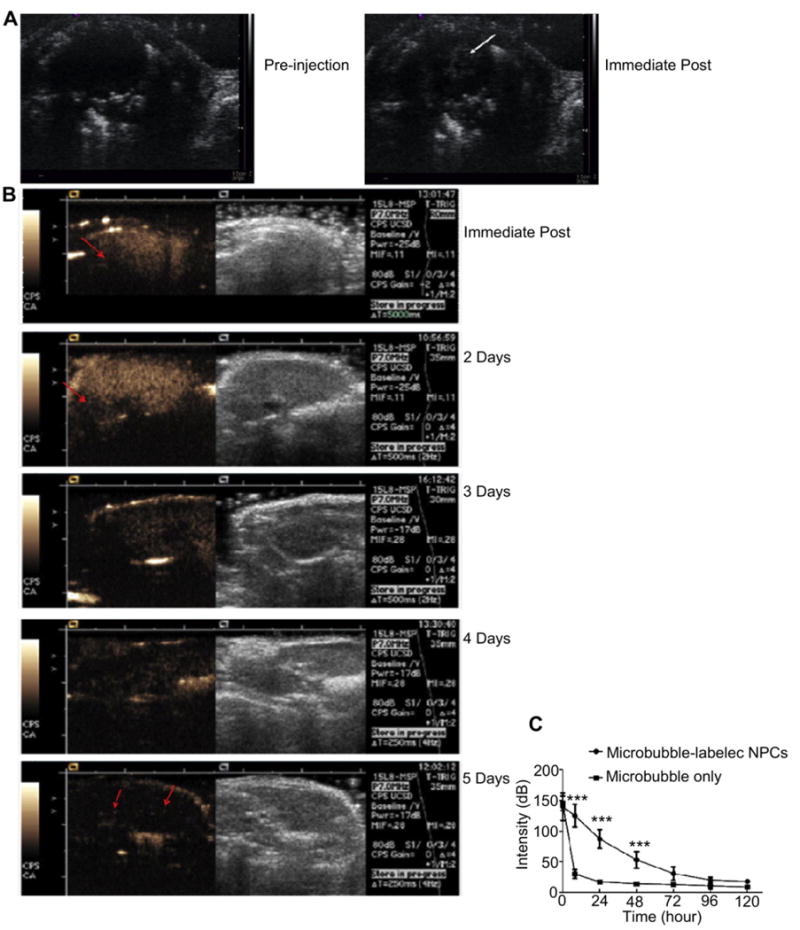
In vivo detection of MB-loaded NPCs. (A) Mouse heart imaged before and immediately after the intravenous injection of MB-labeled NPCs at 5 MHz center frequency. MBs can be seen in the left ventricle; (B) Dual display of B-mode (right) and CPS images (left) of a mouse liver imaged immediately after the IV administration of MB-labeled NPCs, and then again at 2, 3, 4, and 5 days later. Immediately post infusion, the MB-labeled NPC count was so high that the far field of the liver was shadowed (arrow). The shadowing diminished but was still observed at 2 days. The echoes became sparse by 3 days but were still visible by Day 5 (arrows); (C) Mean videointensity signal of the liver ± SEM of mice given MB-loaded NPCs or free MBs are plotted as a function of time. Note the rapid loss of liver signal following the injection of free MBs as compared to the persistent signal following MB-loaded NPCs.
We evaluated US signal persistence of MB-loaded NPCs in vivo using the liver where NPCs initially accumulate after intravenous injection [26]. Livers were imaged in real-time at 7 MHz central frequency and at low acoustic pressure (0.1 MI) in 12 normal mice, 8 injected with 250 μl of MB-labeled NPCs (6 × 10⁶ cells/ml) and 4 injected with 250 μl of free MBs (1.7 × 109 MB/ml) as control. Livers imaged immediately post infusion were sufficiently loaded with MBs in both groups that attenuation of the far field was observed (Fig. 5B). Whereas free MBs were no longer visible at 8 h after infusion and beyond, MB-labeled NPCs continued to cause shadowing at 2 days and were still visible at 5 days, albeit at a much lower echo density. At any time point when a different section of the liver was imaged and/or a higher MI was used, more echoes could be observed indicating that more MB-loaded NPCs were present than noted with low MI imaging. This higher detection sensitivity however is accomplished at the expense of MB destruction and subsequent loss of signal from the imaged section.
When a region of interest analysis was performed over the liver of both groups, increased signal was observed relative to baseline immediately following MB-infusion and decreased gradually over 5 days after the infusion of MB-loaded NPCs but precipitously after free MBs (P < 0.001) (Fig. 5C).
3.7. Immunohistochemistry and immunofluorescence of the liver
NPCs were labeled with bromodeoxyuridine (BrdU) prior to administration to enable their identification on histologic sections. Immunohistochemistry using anti-BrdU and anti-nestin antibodies stained the NPCs on liver sections (Fig. 6). Confocal epifluorescence microscopy co-localized the two stains to help identify the NPCs. When BrdU-positive cells were seen within the confocal plan of section, they were associated with Nestin-positive staining.
Fig. 6.
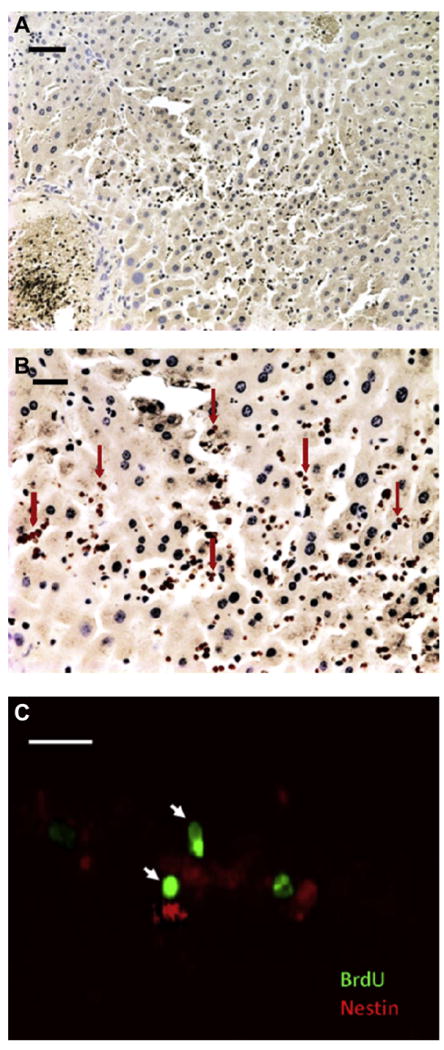
(A) Liver section following Anti-BrdU staining 1 day after MB-labeled NPCs were given intravenously shows widespread distribution of BrdU stained cells (stained brown, DAB) (Scale bar = 50 μm). (B) At higher magnification (Scale bar = 20 μm) taken at the center of the section shown in (A) many brown nuclei labeled with BrdU stain can be seen (arrows). (C) A representative confocal slice shows BrdU (green) and nestin (red) immunofluorescence co-localization. Note the co-staining of two NPCs in the same focal plane with anti-BrdU (nucleus) and anti-nestin (cytoplasm) (arrows) (Scale bar = 20 μm).
4. Discussion
Stable positively charged 1 μm diameter MBs were easily phagocytosed by NPCs where an average of 3–4 MBs were internalized. This also occurred when these positively charged MBs had the negatively charged DNA on their surface. Microscopic analysis of adherent cells when exposed to these MBs showed that MBs become associated with the cell surface and then become internalized. Microscopic observation when a suspension of free MBs and MB-labeled NPCs were simultaneously exposed to US pulses at 2.25 MHz and 125 W/cm2 showed that internalized MBs were more resistant to destruction by US. This is in agreement with the published report that internalized or attached MBs are protected by the much higher viscous damping by the cell [27]. However, internalized MBs were still able to behave non-linearly when exposed to US and to generate harmonic signals [28], and were destroyed by US, albeit at a higher pressure than would be needed for free MBs. Of equal importance for the purpose of tracking cells, internalized MBs were not only resistant to US destruction, but also survived for days both in vitro and in vivo as compared to free MBs that typically last few minutes in vivo. The loss of MB signal over 7 days in vitro is due to the loss of perfluorocarbon gas either during culture and manipulation, deterioration within the endosomes/lysosome or cell death speeding gas loss rather than dilution due to cell division. As cells divide they share the original number of MBs and unlike MR or nuclear reporters that loose signal with dilution, so long as the MB is still present, the cell containing the MB will remain visible since US can detect a single MB [20]. This extreme sensitivity of US to MBs was also confirmed in our study when 5 of the expected 6 cells that were present in a 3-ml agarose container were detected. The combination of US sensitivity to MBs and the extreme effectiveness of MB-specific US imaging at eliminating all non-MB generated signal to produce a total dark background, should ease the detection of one or few adjacent MB-labeled cells in vivo. The ability to detect a single cell would exceed any of the current proposed in vivo cell tracking techniques, particularly PET and MRI.
Increased MB survival when internalized was confirmed in vivo by continuing to detect echoes within the liver out to 5 days after injection, albeit at a much lesser echo density. While the loss of signal in vivo could also be due to MB deterioration or cell death, it is also possible that cells migrated out of the liver to other sites. This possibility was not addressed in our study. Since MBs survived at least 5 days in vivo, it allows the opportunity for cells to home and be detected as they accumulate at sites of interest. More intriguing, is the fact that DNA-carrying MBs were able to transfect these cells in vitro. Since in vivo MB-based US transfection has been well reported [21], it is possible that DNA-carrying MB-labeled cells could be made to express the desired gene at the site of interest. The presence of the MB-labeled NPCs in the site of interest will be confirmed with low acoustic pressure imaging and on demand increase the pressure (still within the FDA limit) to release the DNA and induce transfection. This should provide the opportunity to administer non-activated cells and to activate them at will only at the site of interest to increase safety. Although very few cells were transfected spontaneously without US exposure, nearly all cells exposed to US were transfected. It is possible that spontaneous transfection was aided with the phagocytosis of DNA-carrying MBs as is commonly done with lipofectamine.
5. Conclusions
This study documents and confirms the loading of NPCs with MBs. These internalized MBs are longer lived than free MBs – days in lieu of minutes, and are more resilient to US exposure. US can detect a single MB-loaded NPC and can detect these labeled cells in vivo for days. When the loaded MBs carry DNA, US can release the DNA to transfect the cell and appears not to harm the cell that remains capable of expressing the gene.
Supplementary Material
Acknowledgments
This research was supported in part by the National Institutes of Health grants ICMIC P50 CA128346 and the roadmap R21 EB005360, ST and EO are supported by T32 EB005970; MB is supported by R25 CA153915. We wish to thank Siemens Medical Solutions for providing the Sequoia 512 scanner as an equipment loan and Dr. Evan Snyder (Sanford-Burnham Medical Research Institute) for providing the NPCs.
Footnotes
Appendix A. Supplementary data: Supplementary data related to this article can be found online at http://dx.doi.org/10.1016/j.biomaterials.2013.03.020.
References
- 1.Cohen AR, Gomes FL, Roysam B, Cayouette M. Computational prediction of neural progenitor cell fates. Nat Methods. 2010;7:213–8. doi: 10.1038/nmeth.1424. [DOI] [PubMed] [Google Scholar]
- 2.Wollert KC, Drexler H. Cell therapy for the treatment of coronary heart disease: a critical appraisal. Nat Rev Cardiol. 2010;7:204–15. doi: 10.1038/nrcardio.2010.1. [DOI] [PubMed] [Google Scholar]
- 3.Brown AB, Yang W, Schmidt NO, Carroll R, Leishear KK, Rainov NG, et al. Intravascular delivery of neural stem cell lines to target intracranial and extracranial tumors of neural and non-neural origin. Hum Gene Ther. 2003;14:1777–85. doi: 10.1089/104303403322611782. [DOI] [PubMed] [Google Scholar]
- 4.Staflin K, Honeth G, Kalliomaki S, Kjellman C, Edvardsen K, Lindvall M. Neural progenitor cell lines inhibit rat tumor growth in vivo. Cancer Res. 2004;64:5347–54. doi: 10.1158/0008-5472.CAN-03-1246. [DOI] [PubMed] [Google Scholar]
- 5.Wang L, Martin DR, Baker HJ, Zinn KR, Kappes JC, Ding H, et al. Neural progenitor cell transplantation and imaging in a large animal model. Neurosci Res. 2007;59:327–40. doi: 10.1016/j.neures.2007.08.011. [DOI] [PubMed] [Google Scholar]
- 6.Jandial R, Singec I, Ames CP, Snyder EY. Genetic modification of neural stem cells. Mol Ther. 2008;16:450–7. doi: 10.1038/sj.mt.6300402. [DOI] [PubMed] [Google Scholar]
- 7.Herrlinger U, Woiciechowski C, Sena-Esteves M, Aboody KS, Jacobs AH, Rainov NG, et al. Neural precursor cells for delivery of replication-conditional HSV-1 vectors to intracerebral gliomas. Mol Ther. 2000;1:347–57. doi: 10.1006/mthe.2000.0046. [DOI] [PubMed] [Google Scholar]
- 8.Carro MS, Lim WK, Alvarez MJ, Bollo RJ, Zhao X, Snyder EY, et al. The transcriptional network for mesenchymal transformation of brain tumours. Nature. 2010;463:318–25. doi: 10.1038/nature08712. [DOI] [PMC free article] [PubMed] [Google Scholar]
- 9.Leong-Poi H. Molecular imaging using contrast-enhanced ultrasound: evaluation of angiogenesis and cell therapy. Cardiovasc Res. 2009;84:190–200. doi: 10.1093/cvr/cvp248. [DOI] [PubMed] [Google Scholar]
- 10.Bulte JW, Douglas T, Witwer B, Zhang SC, Strable E, Lewis BK, et al. Magnetodendrimers allow endosomal magnetic labeling and in vivo tracking of stem cells. Nat Biotechnol. 2001;19:1141–7. doi: 10.1038/nbt1201-1141. [DOI] [PubMed] [Google Scholar]
- 11.Bendall SC, Nolan GP. From single cells to deep phenotypes in cancer. Nat Biotechnol. 2012;30:639–47. doi: 10.1038/nbt.2283. [DOI] [PubMed] [Google Scholar]
- 12.Lu R, Neff NF, Quake SR, Weissman IL. Tracking single hematopoietic stem cells in vivo using high-throughput sequencing in conjunction with viral genetic barcoding. Nat Biotechnol. 2011;29:928–33. doi: 10.1038/nbt.1977. [DOI] [PMC free article] [PubMed] [Google Scholar]
- 13.Weber K, Thomaschewski M, Warlich M, Volz T, Cornils K, Niebuhr B, et al. RGB marking facilitates multicolor clonal cell tracking. Nat Med. 2011;17:504–9. doi: 10.1038/nm.2338. [DOI] [PubMed] [Google Scholar]
- 14.Lo Celso C, Fleming HE, Wu JW, Zhao CX, Miake-Lye S, Fujisaki J, et al. Live-animal tracking of individual haematopoietic stem/progenitor cells in their niche. Nature. 2009;457:92–6. doi: 10.1038/nature07434. [DOI] [PMC free article] [PubMed] [Google Scholar]
- 15.Lewin M, Carlesso N, Tung CH, Tang XW, Cory D, Scadden DT, et al. Tat peptide-derivatized magnetic nanoparticles allow in vivo tracking and recovery of progenitor cells. Nat Biotechnol. 2000;18:410–4. doi: 10.1038/74464. [DOI] [PubMed] [Google Scholar]
- 16.Zhang Z, Jiang Q, Jiang F, Ding G, Zhang R, Wang L, et al. In vivo magnetic resonance imaging tracks adult neural progenitor cell targeting of brain tumor. Neuroimage. 2004;23:281–7. doi: 10.1016/j.neuroimage.2004.05.019. [DOI] [PubMed] [Google Scholar]
- 17.Ahrens ET, Flores R, Xu H, Morel PA. In vivo imaging platform for tracking immunotherapeutic cells. Nat Biotechnol. 2005;23:983–7. doi: 10.1038/nbt1121. [DOI] [PubMed] [Google Scholar]
- 18.Genove G, DeMarco U, Xu H, Goins WF, Ahrens ET. A new transgene reporter for in vivo magnetic resonance imaging. Nat Med. 2005;11:450–4. doi: 10.1038/nm1208. [DOI] [PubMed] [Google Scholar]
- 19.Thu MS, Bryant LH, Coppola T, Jordan EK, Budde MD, Lewis BK, et al. Self-assembling nanocomplexes by combining ferumoxytol, heparin and protamine for cell tracking by magnetic resonance imaging. Nat Med. 2012;18:463–7. doi: 10.1038/nm.2666. [DOI] [PMC free article] [PubMed] [Google Scholar]
- 20.Klibanov AL, Rasche PT, Hughes MS, Wojdyla JK, Galen KP, Wible JH, et al. Detection of individual microbubbles of ultrasound contrast agents: imaging of free-floating and targeted bubbles. Invest Radiol. 2004;39:187–95. doi: 10.1097/01.rli.0000115926.96796.75. [DOI] [PubMed] [Google Scholar]
- 21.Ferrara K, Pollard R, Borden M. Ultrasound microbubble contrast agents: fundamentals and application to gene and drug delivery. Annu Rev Biomed Eng. 2007;9:415–47. doi: 10.1146/annurev.bioeng.8.061505.095852. [DOI] [PubMed] [Google Scholar]
- 22.Cui WJ, Chen X, Wang J, Fisher A, Kim K, Carson A, et al. A new method for stem cell imaging using contrast ultrasound. Circulation. 2008;118:S_642. [Google Scholar]
- 23.Fischer UM, Harting MT, Jimenez F, Monzon-Posadas WO, Xue H, Savitz SI, et al. Pulmonary passage is a major obstacle for intravenous stem cell delivery: the pulmonary first-pass effect. Stem Cells Dev. 2009;18:683–92. doi: 10.1089/scd.2008.0253. [DOI] [PMC free article] [PubMed] [Google Scholar]
- 24.Schrepfer S, Deuse T, Reichenspurner H, Fischbein MP, Robbins RC, Pelletier MP. Stem cell transplantation: the lung barrier. Transplant Proc. 2007;39:573–6. doi: 10.1016/j.transproceed.2006.12.019. [DOI] [PubMed] [Google Scholar]
- 25.Luo Y, Mughal MR, Ouyang TG, Jiang H, Luo W, Yu QS, et al. Plumbagin promotes the generation of astrocytes from rat spinal cord neural progenitors via activation of the transcription factor Stat3. J Neurochem. 115:1337–49. doi: 10.1111/j.1471-4159.2010.06780.x. [DOI] [PMC free article] [PubMed] [Google Scholar]
- 26.Pendharkar AV, Chua JY, Andres RH, Wang N, Gaeta X, Wang H, et al. Bio-distribution of neural stem cells after intravascular therapy for hypoxic-ischemia. Stroke. 41:2064–70. doi: 10.1161/STROKEAHA.109.575993. [DOI] [PMC free article] [PubMed] [Google Scholar]
- 27.Lindner JR, Dayton PA, Coggins MP, Ley K, Song J, Ferrara K, et al. Noninvasive imaging of inflammation by ultrasound detection of phagocytosed microbubbles. Circulation. 2000;102:531–8. doi: 10.1161/01.cir.102.5.531. [DOI] [PubMed] [Google Scholar]
- 28.Dayton PA, Chomas JE, Lum AF, Allen JS, Lindner JR, Simon SI, et al. Optical and acoustical dynamics of microbubble contrast agents inside neutrophils. Biophys J. 2001;80:1547–56. doi: 10.1016/S0006-3495(01)76127-9. [DOI] [PMC free article] [PubMed] [Google Scholar]
Associated Data
This section collects any data citations, data availability statements, or supplementary materials included in this article.