

Abstract
The human immunodeficiency virus type 1 (HIV-1) proteins, gp120 and Tat, are believed to play a role in mediating central nervous system (CNS) pathology in HIV-1 infected patients. Using design-based stereology, we examined the role of neonatal intrahippocampal injections of gp120 and Tat on the adult hippocampus (~7½ month). Postnatal day (P)1-treated Sprague-Dawley rats were bilaterally injected with vehicle (VEH, 0.5 μl sterile buffer), gp120 (100 ng), Tat (25 μg) or combined gp120 + Tat (100 ng + 25 μg). Using Nissl-stained tissue sections, we quantified total neurons in five subregions of the rat hippocampus [granual layer (GL), hilus of the dentate gyrus (DGH), cornu ammonis fields (CA)2/3, CA1, and subiculum (SUB)], and total glial cells (astrocytes and oligodendrocytes) in two subregions (DGH and SUB). Estimates of cell area and cell volume were taken in the DGH. There was a significant reduction of neuron number in the CA2/3 subfield by Tat and gp120, and a significant reduction in the DGH by Tat only. For glial cells, numbers of astrocytes in the DGH and SUB were increased by the Tat protein, whereas no effects were noted for gp120. Finally, for oligodendrocytes Tat increased cell number in the DGH but not in any other region; gp120 had no detectable effect in any brain region. Estimates of cell area and cell volume of the three different cell types revealed no significant differences between treatments. Collectively, these results suggest differential effects of gp120 and Tat on the estimated total number of neurons, as well as on the number of glial cells.
Keywords: Tat, gp120, astrocytes, neurons, oligodendrocytes
INTRODUCTION
Pediatric human immunodeficiency virus (HIV) is one of the leading causes of death in children, with a 2.3-times increased prevalence of children (< 15 years) dying of acquired immunodeficiency syndrome (AIDS) compared with adults (UNAIDS/WHO, 2006). The major source of pediatric infection occurs through vertical transmission of the virus from mother to child, transmitted during active labor and delivery, but infection also occurs during pregnancy and/or through postnatal breast-feeding, with the latter occurring specifically in developing countries (WHO, 2006). HIV-1 entry into the central nervous system (CNS) is a critical step in the development of neurological disorders. The clinical syndrome, HIV-1-associated progressive encephalopathy, can be associated with delay or loss of developmental milestones, impairments in motor functions, and deficits in cognitive functions, specifically attention, learning, and information processing (Epstein et al., 1985, 1986; Belman et al., 1988; Wiley and Nelson, 1990; Sharer, 1992). The severity of pediatric HIV-1 infection in the CNS is due to the fact that brain infection occurs at immature stages of development, which may account for the earlier and more rapid clinical presentations of progressive encephalopathy, as compared with the long latencies typically seen with HIV-1-associated dementia (HAD) in adults (Blanche et al., 1994; Mintz, 1994, 2005).
Whether clinical and pathological substrates of HIV-1 infection can be attributed to the direct action of the virus on neurons itself is currently debated (Bagasra et al., 1996; Torres-Munoz et al., 2001; Trillo-Pazos et al., 2003). A study assessing the hippocampus in brains from six adult and two pediatric AIDS patients demonstrated the latent infection of neurons by the virus in vivo (Torres-Munoz et al., 2001). Brain neurons containing HIV-1 DNA sequences were found in the CA1, CA3, and CA4 regions. Results revealed evidence of direct HIV-1 infection of neurons as one potential mechanism for neuronal injury or neuronal death. In contrast to studies demonstrating the presence of HIV-1 in neurons (Bagasra et al., 1996; Torres-Munoz et al., 2001; Trillo-Pazos et al., 2003) other studies report the lack of neurons infected by HIV-1 (Takahashi et al., 1996; Thompson et al., 2004). A study which reported HIV-1 infection of macrophages and microglia in addition to a more latent infection of astrocytes, could not detect HIV-1 infected neurons and/or oligodendrocytes (Takahashi et al., 1996). It is well known that microglia and macrophages are the most commonly infected cells in the brain of AIDS patients (Bagasra et al., 1996), and recent studies confirm the finding that a substantial minority of astrocytes are also harboring the HIV-1 DNA (Takahashi et al., 1996; Thompson et al., 2004). The importance of activated HIV-1 infected macrophages/microglia and astrocytes is that they release cytokines, reactive oxygen species, and several neurotoxins that impair cellular functioning, modify neurotransmitter action, and may be mediators of neuronal loss (Minagar et al., 2002). For example, exposure of neurons to HIV-1 proteins, including gp120 and Tat, is reported to play a role in mediating neuronal dysfunction or death in vitro (Brenneman et al., 1988; Lipton, 1991; Gendelman et al., 1994; Ma and Nath, 1997; Nath and Geiger, 1998). Further, HIV-1 proteins are found to be increased in the brain of AIDS patients (Jones et al., 2000; Valle et al., 2000).
Gp120 is a structural HIV-1 envelope protein that is crucial for viral entry into the CNS (Hao and Lyman, 1999). In vitro and in vivo studies have reported that gp120-induced neurotoxicity is mediated through different cell surface receptors, such as CCR5 and CXCR4 chemokine receptors and N-methyl-d-aspartate receptor mechanisms (Lipton et al., 1995; Barks et al., 1997). A study examining human astrocyte cultures exposed to HIV-1 and gp120 indicated that gp120 is likely responsible for HIV-1 binding to astrocytes (Hao and Lyman, 1999). By binding to these cell surface receptors, gp120 may trigger neuronal apoptosis and excitotoxicity as a result of oxidative stress, perturbed cellular calcium homeostasis and mitochondrial alterations, leading to neuronal death (Lipton, 1991; Corasaniti et al., 2001b; Haughey and Mattson, 2002). Further, gp120 has been shown to activate uninfected macrophages and microglia that express CCR5 and CXCR4 chemokine receptors (Del Corno et al., 2001; Lee et al., 2003; Yi et al., 2004).
Neurobehavioral studies assessing gp120, however, are more controversial in nature. Exposure of gp120 in utero and subcutaneous injection of gp120 during the neonatal period failed to cause any measurable induced neurotoxicity on behavior and histology (Bussiere et al., 1999). Another developmental study reported gp120-induced alterations in complex motor skills but not in developmental milestones of physical and sensory development (Hill et al., 1993). In contrast, recent behavioral studies, injecting gp120 on postnatal day (P)1, indicated that gp120 produced alterations on sensory-motor systems early in development and on preattentive processes later in adulthood (Fitting et al., 2006b, 2007).
Another HIV-1 protein that is of interest is the regulatory protein Tat, which appears to promote HIV-1 neurotoxicity by interacting directly with neurons and causing oxidative stress as an early step in neuronal degeneration (Bansal et al., 2000; Aksenov et al., 2001, 2003, 2005, 2006a,b). Neuronal cell culture studies demonstrated that exposure of neurons to Tat triggered an early increase in intracellular reactive oxygen species production followed by accumulation of oxidatively modified proteins and subsequent neuronal death (Aksenova et al., 2005, 2006a,b). The release of the HIV-1 protein Tat from astrocytes has been reported to produce trimming of neurites, mitochondrial dysfunction, and cell death in neurons (Pocernich et al., 2005). Effects of neonatal Tat administration on behavioral development are reported in numerous studies (Barks et al., 1997; Fitting et al., 2006c). A longitudinal study examining inhibition of the auditory startle response (ASR) in developing rats demonstrated a shift in the peak inhibition and flattening of the latency to startle for males and females, respectively. The authors conclude from these findings that Tat is able to impair the cognitive processes involved in sensorimotor gating (Fitting et al., 2006c). Collectively, it is suggested that both protein neurotoxins, gp120 and Tat, may play distinct but important roles in HIV-1 infection and the development of HIV-1-associated neuropsychological complications, especially in the pediatric population.
The goal of the present study was to determine the long-term impact of gp120- and Tat-induced neurotoxicity as well as their interaction, on the adult hippocampus following intrahippocampal injection on postnatal day (P)1. The selection of the hippocampal brain region was based on human data which provides evidence for HIV-1 encephalitis (HIVE) and high viral load located in the temporal lobe (Wiley et al., 1998). Using unbiased stereological estimates, total neurons (Nissl-stain) were quantified in five major subregions of the rat hippocampus: granual layer (GL), hilus of the dentate gyrus (DGH), cornu ammonis fields (CA)2/3, CA1, and subiculum (SUB). Furthermore, glial cells (astrocytes and oligodendrocytes) were quantified in two major subregions of the rat hippocampus, including the DGH and the SUB. For each cell type, estimates of cell area and cell volume were taken in the DGH to determine alterations in cell morphology. Results from the present study are critical to determine the contribution of the viral proteins, gp120 and Tat, to the neurological and neuropathological impairments consequent to HIV-1 infection and may give important insights for therapeutic targets in HIV-1 treatment in the pediatric population.
MATERIALS AND METHODS
Animals
Pregnant Sprague-Dawley female rats (N = 13) were obtained from Harlan Laboratories (Indianapolis, IN). Following birth, one male pup from each litter was randomly assigned to one of four treatment conditions on postnatal day (P)1 (P0 = day of birth). Animals received bilateral hippocampal injections (each 0.5 μl in volume) of either VEH, 100 ng gp120, 25 μg Tat, or combined 100 ng gp120 + 25 μg Tat. Two animals died during/after surgery (1 VEH and 1 gp120 animal) and for the Tat group only 12 rats were injected, thus resulting in 12 animals per condition, except for the combined gp120 + Tat group (n = 13). All animals were tested in multiple behavioral tests throughout development starting at P3 and lasting until adulthood (unpublished observations). The animals were group-housed with their littermates (2–3/cage) under controlled temperature (21 ± 2)°C, relative humidity (50 ± 10)%, and lighting [12-h light: 12-h dark cycle with lights on at 0700 h (EST)] conditions. All animals had ad libitum access to distilled water and a standard rat chow diet (Pro-Lab Rat, Mouse, Hamster Chow No. 3000). No evidence of any type of tumors, cataracts, or other gross pathology was found in the animals at the time of sacrifice. Furthermore, body weight in young and adult rats was not affected by neonatal protein treatments (unpublished observations). At 221–226 days of age (~7½ month of age), animals were killed and five animals of each group were randomly chosen by an investigator, naive to treatment condition, to be used for histological studies. The experimental protocol was approved by the Institutional Animal Care and Use Committee (IACUC) at the University of South Carolina, Columbia. Animals were maintained according to National Institute for Health (NIH) guidelines in American Association for Accreditation of Laboratory Animal Care (AAALAC) accredited facilities.
Surgical Techniques and Protein Treatment
Directly injecting the HIV-1 proteins into the CNS models the acute exposure of the CNS to the virotoxins; vertical transmission of HIV-1 occurs at partum. Standard stereotaxic surgery techniques, modified for neonates, were used for treatment injection. Individual pups were removed from the dam and cryogenically anesthetized (AVMA, 2001) before being placed in a modified stereotaxic holder for surgery of neonates (Kopf, Inc.), which included a chilled base to maintain cryogenic anesthesia. Rubber head bars held the skull in place while bilateral microinjections (each 0.5 μl in volume) were made directly into the hippocampus using stereotaxic coordinates for injections and a microsyringe (Hamilton Co., NV). The set of stereotaxic coordinates used for injections for the left and right hippocampus were −0.65 mm anterior to the bregma, 1.0 mm lateral to bregma, −2.2 mm dorsal from dura. Animals were bilaterally injected with sterile buffer [vehicle (VEH); 10 mM Tris HCl, 300 nM NaCl, pH = 7.58, sterile], 100 ng gp120 [glycoprotein 120, purified gp120 LAV (T-tropic) envelope protein, Protein Sciences Corp., Meriden, CT], 25 μg Tat [transactivator of transcription, recombinant biologically active Tat 1–72 produced as previously described (Ma and Nath, 1997)] or combined gp120 + Tat (gp120 100 ng + Tat 25 μg). The doses used in the present study were lower than those used in previous research to facilitate the detection of potential interactive effects (Bansal et al., 2000). Analyses of Nissl-stained sections through the hippocampus confirmed placement of injection sites into the dorsal hippocampus.
Tissue Processing
Animals were anesthetized via isoflurane (inhalation for 3 min) and immediately perfused via the left cardic ventricle with ~200 ml 9% NaCl, followed by ~300 ml sodium phosphate-buffered, pH 7.2, 4% paraformaldehyde fixative solution (stored at 4°C), which was administered for no longer than 10 min. After fixation, brains were removed and brain tissue was carefully blocked according to standardized anatomical landmarks. The standardized anatomical landmarks were the rostral (anterior) brain part at the cross of the optic chiasm and the caudal (posterior) part of the brain with the cerebellum. The remaining block of tissue contained the entire hippocampus. After blocking the brain tissue, all brain parts were postfixed in 4% paraformaldehyde fixative solution and stored at 4°C for no longer than 2 h. Subsequently the brains were equilibrated in graded surcrose solution for at least 24 h at 4°C.
Sectioning
The cortical surface of the middle brain part containing the hippocampus was notched on the right rostral side before sectioning to orient the tissue for mounting. The tissue blocks were sectioned into 50 μm thick slices in the transverse/horizontal plane using a microtome cryostat (Microm HM500M, Walldorf, Germany). The free floating technique was used to collect serial sections. Approximately 118–136 consecutive sections were collected throughout the hippocampus from each animal. Collection of tissue sections for analysis started at the most dorsal aspect of the corpus callosum above the hippocampal white matter, indicating the start of the hippocampus. The sections were stored into 3 × 48 well cell culture clusters (Corning, NY) that contained cryoprotective storage solution to prevent tissue from freezing and stored at −30°C.
Cresyl-Violet (Nissl) Staining and Mounting
Systematic random sampling design was used with collecting every 6th section in the series that was cut throughout the entire structure. Free-floating sections were taken out of the cryoprotecive storage solution and rinsed at least 3 × 10 min in PBS (phosphate buffered saline, pH 7.2) to clear of the cryoprotective solution. This was then followed by floating the sections in a cold PBS bath, before mounting them on 25 × 75 × 1 mm3 microscope slides (VWRbrand Superfrost Plus Microslide, VWR Scientific) and letting them air-dry over night at room temperature before staining. The tissue sections were stained with cresyl-violet (Nissl) staining. The Nissl solution was prepared with 1 g cresyl-violet acetate (Sigma, St. Louis, MO, USA) in 400 ml distilled water (pH 4.0). The Nissl staining procedure was as follows: At room temperature the mounted sections were soaked in 70%, 2 × 95%, 100%, 2 × 95%, and 70% alcohol (each time for 5 min), then shortly rinsed in distilled water, and placed in the Nissl solution for 1:30 min. This was followed by slides being rinsed in distilled water, dehydrated through a similar series of alcohol solutions (70%, 2 × 95%, 2 × 100% alcohol each time for 1 min), and placed in xylene to be then coverslipped with a cover glass (Corning Glass works, NY, 24 × 60 mm2, No. 1½) using permanent DPX mounting media (DPX Mountant, Fluka Biochemika 44581). Tissue shrinkage was accompanied during the course of tissue preparation that reduced the z-axis to an average weighted section thickness of ~20 μm.
Definitions of the Five Subregions of the Hippocampus
The hippocampal formation is formed by relatively distinct subregions that have been defined in many stereological based studies (West et al., 1991; Lister et al., 2005). This study includes the five hippocampal cellular layers, GL, DGH, cornu ammonis fields (CA)2/3, CA1, and SUB. For purposes of stereological quantification, the boundaries of the five cellular layers were defined at all levels of each section series consistently across subjects based on morphologic appearance and clearly identifiable cyto-architectural landmarks. The quantified areas that were manually outlined are illustrated in a transverse section of the hippocampus in Figure 1A.
FIGURE 1.

A: Calibration bar; 250 μm, × 4 magnification. Left Panel: The cytoarchitectonic delineation of hippocampal subfields cut in the horizontal plane. Middle Panel: Arrows indicate the hippocampal subfields for analysis. Arrowheads mark the border between the different hippocampal subfields. Right Panel: Boundaries of the cellular layers as outlined on the StereoInvestigator 7.0 system, i.e., the defined regions of interest within cells were counted and cell area and cell volume were taken; B: A more detailed illustration of the different hippocampal subregions with close ups by using × 60 and × 100 magnifications.
The GL is the most densely packed cell layer in the hippocampus and contains the smallest neuronal cell bodies (Fig. 1B, right). The cell bodies are stacked 8–15 cells deep and are not in immediate contact with the other densely packed layers, i.e. the pyramidal cell layers of the CA fields. The granule cells can be defined as the blades of the dentate gyrus. The sectioned profiles of the layer have natural borders and can be readily defined (Fig. 1A).
The DGH includes very large, loosely packed polymorphic cells interposed between the arms of the horseshoe-shape GL (Fig. 1B, right) but excludes the densely packed pyramidal cell layer of the CA3 that often extends into the hilus (Fig. 1A). The DGH can be defined as the polymorphic nuclear region between the blades of the dentate gyrus.
The CA2/3 is a densely packed thin pyramidal cell layer that consist of tightly, closely packed, densely chromophilic neurons and are more loosely organized when extending into the hilus (Figs. 1A,B, top). Because of the small size of the CA2 subfield, it was grouped with the CA3 pyramidal layer in one tracing and is collectively referred to as CA2/3. The end of the CA2/3 layer that extends into the hilus is well defined by the abrupt change in the organization of the neuronal cell bodies (Fig. 1B, upper right). The border of CA2/3 toward the CA1 region is defined where these large neurons give way to the smaller, more densely packed neurons of the CA1 pyramidal layer (Fig. 1B, upper left).
The pyramidal cells and nuclei of the CA1 are smaller than those of the CA2/3 region. Near the CA2/3 region they are tightly packed in a layer 4–5 cells deep (Fig. 1A; Fig. 1B, upper left). Because of its small size, the transition zone at the distal end of the CA1 subfield is included as part of the CA1 subfield (Fig. 1A). Toward the SUB, the deeper cells of the layer become progressively more loosely packed. The border with the SUB is established where the underlying stratum ends, and the large, relatively loosely organized subicular pyramids appear as the dense and evenly packed CA1 pyramids end (Fig. 1A; Fig. 1B, lower left).
The SUB contains pyramidal cells that are about the same size as those seen in the adjacent CA horn but are dispersed along the radial axis and therefore less densely packed than those of CA fields (Fig. 1A; Fig. 1B, lower right). The border between the CA1 and the SUB is defined as the point at which the CA1 cell bodies are no longer densely packed (Fig. 1B, lower left). The distal border of the SUB is marked where those neurons give way to neurons of the perientorhinal areas (Fig. 1A).
The layers presented in Figure 1 were identified at mid-hippocampal levels, where the plane of sections is transverse to the long axis of the hippocampus, and then followed through the horizontal sections in both the septal (dorsal) and temporal (ventral) directions.
Identification Criteria of the Different Cell Types
Every neuron in each of the five subregions was visually identified and manually counted throughout the predefined disector height of the tissue section. Neurons were identified morphologically by their larger, pale nuclei surrounded by darkly stained cytoplasm containing Nissl bodies. For all five subregions, only cell types with a clearly definable visible cell body and nucleus were included in this study. For the DGH and the SUB, additionally, astrocytes, oligodendrocytes and microglia were identified and counted (Fig. 2). Neurons are heavily stained with a large nucleus and single nucleolus (solid gray arrowhead in Fig. 2). Astrocytes display pale staining of the nucleus and a thin rim of Nissl stained cytoplasm immediately adjacent to the nucleus (solid white arrowhead in Fig. 2). Oligodendrocytes are identified by dark nuclei eccentrically located on one end of a polar cell body (solid black arrowhead in Fig. 2). Microglia are characterized by irregular shape, dark stained nuclei and patches of condensed chromatin with little cytoplasmic staining (not shown). In other words, astrocytes were identified from neuronal counts by their relatively smaller size (10 μm in diameter), smaller nucleus (oval pale nucleus), and lack of stained cytoplasm. Oligodendrocytes are smaller (7 μm in diameter) than astrocytes, are somewhat boxlike or pearshaped, and usually appear in clumps or rows. Compared with astrocytes, their round, eccentric nuclei are smaller, darker, and more densely packed with chromatin (Dodd, 1979). Microglia are the smallest of the glial cells (5 μm in diameter) and are mainly located near blood vessels and nerve cell bodies (Dodd, 1979). The nucleus is the smallest, darkest, and most irregular of the glial nuclei; it may be rod-shaped, oval and indented, or bent. In the present study, microglia were not as numerous as the other two types of glial cells. Because the same stereological parameters were used for each cell type (i.e. size of the counting grid, size of the counting frame), only few microglia were counted for each animal (i.e. 1–26 counts in the DGH and 1–14 counts in the SUB for each animal). Because it is necessary to obtain ~100–200 samples of 10–20 sections from one animal to get a low error coefficient (CE of 0.06) (West et al., 1991), microglia counts were not included as a dependent variable in the present study.
FIGURE 2.

A photomicrograph of the hilus of the dentate gyrus at × 100 magnification, illustrating typical cell types based on morphology and Nissl-Staining. Neurons, indicated by the solid gray arrowheads, are heavily stained with a large nucleus and single nucleolus. Astrocytes, indicated by the open arrowheads, display pale staining of the nucleus and a thin rim of Nissl stained cytoplasm immediately adjacent to the nucleus. Oligodendrocytes, indicated by the filled black arrowheads, are identified by dark nuclei eccentrically located on one end of a polar cell body. Microglia, that are not shown here, are characterized by irregular shape, dark stained nuclei and patched of condensed chromatin with little cytoplasmic staining.; Calibration Bar: 25 μm.
Stereology
Imaging system and stereology estimates
The primary data were obtained using a computer (Dell, Microsoft Windows XP Professional) interfaced with a Nikon eclipse E800 microscope (Nikon, Melville, NY) equipped with a motorized LEP MAC 5000 XYZ stage controller (Ludl Electronic Products, NY). The StereoInvestigator software 7.0 (Microbrightfield, Williston, VT) was used. Unbiased estimates of total neuron, astrocyte, and oligodendrocyte number were obtained by using the optical fractionator as a stereological technique (West et al., 1991; Gundersen et al., 1999). The nucleator probe was used within the context of the optical fractionator to estimate the mean cross-sectional cell area and cell volume of neurons, astrocytes, and oligodendrocytes in the DGH.
Optical fractionator
The optical fractionator (combination of performing counting with the optical disector, with fractionator sampling) is a stereological method based on a properly designed systematic random sampling method that by definition yields unbiased estimates of population number (West et al., 1991; Gundersen et al., 1999). In this method, a systematically random series of sections (i.e., in the present study every 6th section in the series by starting with a random starting value within this interval) is overlaid on the area of interest, in a random manner, with a grid of known dimensions [grid(x, y step)]. At each grid intersection, a disector with a counting frame of known dimensions [frame(x, y step)] is placed, and cells are sampled by the disector. The sampling procedure is accomplished by focusing through the depth of the tissue and systematically sampling a known fraction of the section thickness (t, with the fraction being measured by the optical disector height, h). Thus, a sample from a known fraction of the entire hippocampus (fractionator sampling) is generated by the counts with the dissectors and can be used to get an estimate of the total number of each cell type (West et al., 1991).
The optical fractionator sampling scheme that was used in the present study with counting cells directly in a known fraction in the five different hippocampal subregions can be viewed in Table 1. The number of each cell type (C) in each of the subregions is estimated as:
where ΣQ− is the total number of cells actually counted in the disectors that fell within the sectional profiles of the subregion seen on the sampled sections, asf is the areal sampling fraction calculated by the area of the counting frame of the disector, α(frame) and the area associated with each x, y movement, grid(x, y step) {asf 5 [a(frame)/a(x, y step)]}, and ssf is the fraction of the sections sampled or section sampling fraction. On the basis of previous studies this factor is 1/12 and refers to the smoothness in the data from one section to the next (West et al., 1991; Slomianka and West, 2005).
TABLE 1.
Fixed Parameters that Describe the Dimensions of the Disector Samples
| Granular layer | DG hilus | CA2/3 | CA1 | Subiculum | |
|---|---|---|---|---|---|
| ssf | 1/12 | 1/12 | 1/12 | 1/12 | 1/12 |
| asf: α[(frame)/grid(x, y step)] (μm2) | |||||
| α(frame) μm2 | 8 × 8 | 35 × 35 | 16.5 × 16.5 | 15 × 15 | 25 × 25 |
| grid[x, y step] (μm2) | 250 × 250 | 250 × 250 | 250 × 250 | 250 × 250 | 300 × 300 |
| h/ta | |||||
| disect. Ht., h, (μm) | 10 | 10 | 10 | 10 | 10 |
Section thickness, t, varies from counting frame to counting frame and is determined during the process of counting.
Procedure of Sampling With the Optical Dissector
Areas of the five subregions of interest were outlined on one side of the hippocampus per animal (unilateral) using a 4 × objective (Nikon, 4×, Plan Apo 4×/0.2, ∝/−WD 15.7, 2,950 × 2,250 μm). Counts and cellular area and volume estimates were performed using a 1003 oil immersion objective [Nikon Plan Apo TRIF, 100×/1.45 oil (N.A.), DIC H ∝/0.17WD, 0.13; resulting in a field of view on the monitor that was 110 × 85 μm2]. Under a higher magnification (100×), the motorized stage was stepped through the predefined computerized boundary coordinates, and total neuron number was estimated using the optical fractionator (West et al., 1991).
Weighted section thickness was measured in each animal by refocusing to the top of each section at each grid site. Section thickness was measured before counting started for each grid site. To estimate the section thickness the top of the tissue section (upper surface of the section) was defined as the first cell coming into focus, and the bottom of the tissue section (lower surface of the section) was defined as the last cell coming into focus.
From the top of the tissue section the plane was moved 2 μm from the surface of the section into the section, thereby removing any lost caps (West et al., 1991). The counting frame was then focused through 10 μm of the thickness of the section and the number of nuclei was counted with unbiased counting rules. With the optical disector it is only necessary to determine whether or not the first recognizable profile of the object (nucleus) to come into focus is within the counting frame. Nuclei were counted when they came into focus as the plane of focus was moved up and down through the thickness of the sections following the unbiased counting rules for the optical disector. Any nuclei contacting any portion of either of two predesignated sides of the counting frame were not included in the estimation (i.e., forbidden lines, which were considered as out of the bounds). Conversely, any nuclei lying within the frame or touching either of the other two sides of the counting frame were included in the estimation (West et al., 1991). No count was performed if the nucleator simultaneously contacted both an inclusion and a forbidden line. All data in this study were collected by observers naive about animal treatment.
Nucleator
Estimates of cell area and cell volume were generated in the DGH by the nucleator. The nucleator was used within the context of the optical fractionator during the process of counting the cells in the DGH by using the counting frame rules presented in the optical disector procedure section. To place the nucleator at a consistent location within each of the cells the nucleus of each cell type was chosen as a reference point. Four equally spaced radial lines were used for each nucleator that extended out from the central reference point. Estimations of the average cell area and average cell volume for the three cell types were conducted by marking the intersection of each radial line with the boundary of the cells, thus measuring the cell area and cell volume of each sampled cell.
Data Analysis
Data are expressed in figures, tables, and text as mean (± SEM). All data were analyzed using analysis of variance (ANOVA) techniques (SPSS 2005, Version 14.0 for Windows, SPSS). Two-way analyses of variance (ANOVAs) with Tat (2 levels: no, yes) and Gp120 (2 levels: no, yes) as between-subjects factors were conducted for estimates of cell number generated by the optical fractionator and estimates of cell area and cell volume generated by the nucleator. Planned comparisons using the Bonferroni correction factor were performed to determine specific treatment effects. For the DGH and the SUB, data were further analyzed by three-way mixed model ANOVAs, where cell type was taken as a within-subjects factor [Cell type (3 levels: neurons, astrocytes, oligodendrocytes) × Tat (2 levels) × Gp120 (2 levels)]. For the within-subjects term (i.e. cell type), potential violations of sphericity (Winer, 1971) were preferentially handled by the use of orthogonal decomposition or, if necessary, the use of the Greenhouse-Geisser df correction factor (Greenhouse and Geisser, 1959). An α level of P ≤ 0.05 was considered significant for all statistical tests used.
RESULTS
Cell Number in the Different Hippocampal Subregions (Optical Fractionator)
There were five individual regions: the GL, DGH, CA2/3, CA1, and SUB. Results are presented in Figure 3 and Table 2, along with the coefficients of error (CE, calculated using the formula (Gundersen et al., 1999) and the results of the conducted two-way ANOVAs.
FIGURE 3.
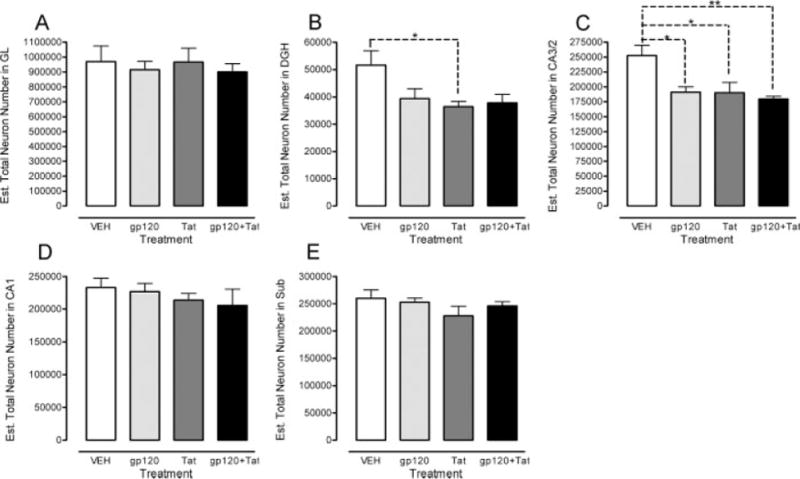
Estimated total number of neurons across the five subregions of the rat hippocampus. Region specific illustration of the total neuron number in the (A) granual layer (GL), (B) hilus of the dentate gyrus (DGH), (C) cornu ammonis fields (CA)2/3, (D) CA1, and (E) subiculum (SUB)., P ≤ 0.05; P ≤ 0.01.
TABLE 2.
Total Number of Cells in the Rat Hippocampus (Unilateral Values).
| Granular Layer
|
DG Hilus
|
CA2/3
|
CA1
|
Subiculum
|
|||||||||||||||
|---|---|---|---|---|---|---|---|---|---|---|---|---|---|---|---|---|---|---|---|
| Litter/Animal | Group | Neurons | Neurons | Astrocytes | Oligoden | Neurons | Neurons | Neurons | Astrocytes | Oligoden | |||||||||
| L1/A | VEH | 717,978 | 0.11 | 39,558 | 0.10 | 36,643 | 0.11 | 72,036 | 0.08 | 224,442 | 0.10 | 242,917 | 0.11 | 236,945 | 0.10 | 33,507 | 0.20 | 119,669 | 0.12 |
| L2/A | VEH | 1,294,658 | 0.10 | 61,895 | 0.09 | 39,065 | 0.14 | 73,563 | 0.14 | 312,927 | 0.10 | 279,442 | 0.14 | 292,634 | 0.13 | 45,140 | 0.19 | 160,326 | 0.12 |
| L3/A | VEH | 1,110,791 | 0.10 | 50,521 | 0.10 | 36,979 | 0.12 | 82,813 | 0.09 | 214,304 | 0.10 | 192,092 | 0.14 | 299,734 | 0.09 | 44,806 | 0.18 | 169,953 | 0.11 |
| L4/A | VEH | 795,167 | 0.13 | 65,074 | 0.11 | 40,335 | 0.15 | 71,528 | 0.10 | 265,545 | 0.12 | 230,229 | 0.14 | 245,397 | 0.09 | 34,849 | 0.21 | 104,548 | 0.13 |
| L5/A | VLH | 931,552 | 0.10 | 41,311 | 0.11 | 24,876 | 0.14 | 73,739 | 0.08 | 245,303 | 0.09 | 220,533 | 0.14 | 226,029 | 0.08 | 34,479 | 0.20 | 132,808 | 0.10 |
| Mean N (CE) | 970,029 | 0.11 | 51,672 | 0.10 | 35,580 | 0.13 | 74,736 | 0.10 | 252,504 | 0.10 | 233,042 | 0.13 | 260,148 | 0.10 | 38,556 | 0.20 | 137,461 | 0.12 | |
| CV | 0.24 | 0.22 | 0.17 | 0.06 | 0.15 | 0.14 | 0.13 | 0.15 | 0.20 | ||||||||||
| L1/B | gp120 | 711,885 | 0.12 | 34,824 | 0.14 | 56,059 | 0.14 | 88,760 | 0.15 | 195,620 | 0.10 | 241,958 | 0.12 | 236,156 | 0.08 | 67,473 | 0.14 | 157,438 | 0.10 |
| L2/B | gp120 | 975,497 | 0.10 | 51,133 | 0.11 | 36,900 | 0.12 | 104,374 | 0.09 | 224,442 | 0.12 | 258,570 | 0.14 | 250,089 | 0.09 | 45,197 | 0.21 | 149,149 | 0.11 |
| L3/B | gp120 | 1,013,741 | 0.11 | 43,520 | 0.13 | 58,208 | 0.10 | 135,457 | 0.07 | 175,831 | 0.11 | 200,851 | 0.16 | 280,690 | 0.09 | 74,411 | 0.14 | 178,276 | 0.09 |
| L4/B | gp120 | 867,099 | 0.12 | 32,151 | 0.12 | 44,022 | 0.14 | 82,108 | 0.09 | 178,906 | 0.11 | 195,837 | 0.16 | 242,186 | 0.09 | 55,997 | 0.16 | 128,793 | 0.11 |
| L5/B | gp120 | 1,007,207 | 0.10 | 35,619 | 0.11 | 48,133 | 0.11 | 92,416 | 0.08 | 180,824 | 0.11 | 238,000 | 0.14 | 255,606 | 0.10 | 52,835 | 0.17 | 161,360 | 0.13 |
| Mean N (CE) | 915,086 | 0.11 | 39,449 | 0.12 | 48,664 | 0.12 | 100,623 | 0.10 | 191,125 | 0.11 | 227,043 | 0.14 | 252,926 | 0.09 | 59,182 | 0.16 | 155,003 | 0.11 | |
| CV | 0.14 | 0.20 | 0.18 | 0.21 | 0.11 | 0.12 | 0.07 | 0.20 | 0.12 | ||||||||||
| L1/C | Tat | 632,666 | 0.12 | 31,349 | 0.13 | 73,148 | 0.09 | 109,320 | 0.09 | 133,016 | 0.14 | 224,684 | 0.12 | 167,121 | 0.10 | 61,940 | 0.15 | 157,772 | 0.09 |
| L2/C | Tat | 982,668 | 0.11 | 43,103 | 0.11 | 67,808 | 0.10 | 141,398 | 0.08 | 237,932 | 0.10 | 248,351 | 0.15 | 214,813 | 0.15 | 37,715 | 0.24 | 152,501 | 0.12 |
| L3/C | Tat | 985,565 | 0.14 | 35,680 | 0.12 | 33,303 | 0.11 | 94,954 | 0.13 | 187,711 | 0.12 | 209,750 | 0.13 | 261,446 | 0.10 | 82,651 | 0.15 | 197,350 | 0.11 |
| L4/C | Tat | 1,208,945 | 0.10 | 34,845 | 0.13 | 77,156 | 0.10 | 131,414 | 0.07 | 179,716 | 0.14 | 192,727 | 0.15 | 234,988 | 0.10 | 76,852 | 0.17 | 192,129 | 0.11 |
| L5/C | Tat | 1,021,743 | 0.10 | 37,057 | 0.12 | 57,961 | 0.09 | 100,719 | 0.08 | 212,217 | 0.10 | 193,280 | 0.14 | 259,469 | 0.09 | 67,628 | 0.15 | 149,057 | 0.13 |
| Mean N (CE) | 966,317 | 0.11 | 36,407 | 0.12 | 67,875 | 0.10 | 115,561 | 0.09 | 190,118 | 0.12 | 213,758 | 0.14 | 227,568 | 0.11 | 65,357 | 0.17 | 169,762 | 0.11 | |
| CV | 0.22 | 0.12 | 0.11 | 0.17 | 0.21 | 0.11 | 0.17 | 0.27 | 0.14 | ||||||||||
| L1/D | gp120 + Tat | 917,963 | 0.10 | 38,126 | 0.12 | 56,159 | 0.11 | 120,046 | 0.08 | 168,870 | 0.11 | 214,008 | 0.11 | 256,456 | 0.12 | 48,274 | 0.18 | 117,668 | 0.12 |
| L2/D | gp120 + Tat | 1,087,001 | 0.10 | 48,267 | 0.11 | 71,864 | 0.09 | 130,856 | 0.08 | 192,707 | 0.15 | 298,875 | 0.15 | 246,797 | 0.09 | 90,176 | 0.15 | 164,532 | 0.13 |
| L3/D | gp120 + Tat | 918,625 | 0.13 | 39,105 | 0.14 | 60,482 | 0.10 | 107,407 | 0.08 | 181,511 | 0.11 | 175,888 | 0.22 | 269,240 | 0.08 | 62,721 | 0.17 | 148,388 | 0.11 |
| L4/D | gp120 + Tat | 820,314 | 0.10 | 34,115 | 0.17 | 52,902 | 0.11 | 105,310 | 0.09 | 185,971 | 0.10 | 184,041 | 0.13 | 229,327 | 0.11 | 75,027 | 0.15 | 171,287 | 0.11 |
| L5/D | gp120 + Tat | 760,282 | 0.11 | 29,773 | 0.12 | 46,848 | 0.11 | 91,945 | 0.10 | 169,270 | 0.11 | 154,983 | 0.17 | 226,675 | 0.10 | 66,375 | 0.13 | 161,553 | 0.09 |
| Mean N (CE) | 900,849 | 0.11 | 37,877 | 0.13 | 57,651 | 0.10 | 111,113 | 0.09 | 179,666 | 0.12 | 205,559 | 0.16 | 245,699 | 0.10 | 68,514 | 0.16 | 152,686 | 0.11 | |
| CV | 0.14 | 0.18 | 0.16 | 0.13 | 0.06 | 0.27 | 0.07 | 0.23 | 0.14 | ||||||||||
| 2-way ANOVA | Tat | 0.0 (P ≤ .913) | 5.4 (P ≤ .033) | 32.7 (P ≤ .001) | 12.1 (P ≤ .003) | 7.6 (P ≤ .014) | 1.5 (P ≤ .236) | 2.4 (P ≤ .139) | 9.1 (P ≤ .008) | 2.2 (P ≤ .159) | |||||||||
| F(1, 16) | Gp120 | 0.6 (P ≤ .467) | 2.2 (P ≤ .156) | 0.2 (P ≤ .697) | 2.1 (P ≤ .165) | 7.2 (P ≤ .016) | 0.2 (P ≤ .674) | 0.2 (P ≤ .675) | 4.0 (P ≤ .064) | 0.0 (P ≤ .982) | |||||||||
| (P-value) | TatxGp120 | 0.0 (P ≤ .949) | 3.6 (P ≤ .076) | 10.4 (P ≤ .005) | 4.2 (P ≤ .056) | 3.6 (P ≤ .075) | 0.0 (P ≤ .948) | 1.0 (P ≤ .336) | 2.1 (P ≤ .163) | 2.9 (P ≤ .108) | |||||||||
Estimated total number of neurons revealed differential HIV-1 protein effects on the DGH and the CA2/3 region, indicating specific effects of neuronal loss in these two particular regions. As illustrated in Figure 3 and Table 2, total neuron numbers in the CA2/3 were reduced by gp120 treatment, whereas the HIV-1 Tat protein decreased the number of neurons in the DGH in addition to the CA2/3 subfield neurons. For the CA2/3 region, planned comparisons revealed significant effects for all HIV-1 protein-treated groups compared with the VEH-treated group (gp120: P ≤ 0.031; Tat: P ≤ 0.027; gp120 + Tat: P ≤ 0.009) (Fig. 3C). No other effects were noted, indicating that the combined gp120 + Tat group did not show any interactive effects. For the DGH, planned comparisons revealed a significant effect for the Tat-treated group compared with the VEH-treated group (P ≤ 0.052) (Fig. 3B). No other significant effect was noted for the DGH.
As for the estimated total number of neurons, HIV-1 proteins gp120 and Tat had a differential effect on the number of glial cells on the DGH and the SUB (Table 2). Separate three-way mixed model ANOVAs (Cell Type × Tat × Gp120) were conducted on the DGH and the SUB (see Fig. 4).
FIGURE 4.

Estimated total number of neurons, astrocytes and oligodendrocytes in the (A) hilus of the dentate gyrus (DGH) and (B) subiculum (SUB), P ≤ 0.05; P ≤ 0.01, P ≤ 0.001.
Data for the DGH are illustrated in Figure 4A. A significant main effect of Tat [F(1, 16) = 10.2, P ≤ 0.006] was noted, indicating that the HIV-1 Tat protein had a significant effect on estimates of the total number of glial cells and neurons. Further, a significant cell type effect was noted (F(2, 32) = 235.0, PGG ≤ 0.001), that interacted significantly with Tat [Cell Type × Tat interaction: F(2, 32) = 20.1, PGG ≤ 0.001], with gp120 [Cell Type × gp120 interaction: F(2, 32) = 3.9, PGG ≤ 0.041], and gp120 × Tat [Cell Type × Tat × gp120 interaction: F(2, 32) = 8.3, PGG ≤ 0.003]. Two-way ANOVAs for each of the regions separately were run to identify the source of the interaction effects. A differential effect on astrocytes was noted by a significant gp120 × Tat interaction and supported by a significant Tat effect, but a nonsignificant effect of gp120 (see Table 2). As illustrated in Figure 4A for astrocytes, and supported by planned comparisons, significant increases of the estimated total number of astrocytes were noted for the Tat-treated group compared to the VEH-treated group (P ≤ 0.001), for the combined gp120 + Tat group compared with the VEH-treated group (P ≤ 0.003), for the Tat-treated group compared with the gp120-treated group (P ≤ 0.010). No difference was noted for the gp120-treated group compared with the VEH-treated group. For the oligodendrocytes, only the HIV-1 Tat protein revealed a significant increase in the estimated total number of oligodendrocytes (see Table 2). Figure 4A for oligodendrocytes indicates a significant increase of the estimated total number of oligodendrocytes for the Tat-treated group compared to the VEH-treated group and for the combined gp120 + Tat group compared to the VEH-treated group, which is supported by planned comparisons (P ≤ 0.007 and P ≤ 0.018, respectively). Again, no difference was noted for the gp120-treated group compared to the VEH-treated group.
Data for the SUB are illustrated in Figure 4B. The three-way mixed model ANOVA (Cell Type × Tat × Gp120) revealed a significant main effect of cell type [F(2, 32) = 6.0, PGG ≤ 0.001], that interacted significantly with Tat [Cell Type × Tat interaction: F(2, 32) = 7.5, PGG ≤ 0.005], and gp120 × Tat [Cell Type × Tat × gp120 interaction: F(2, 32) = 4.0, PGG ≤ 0.041]. Two-way ANOVAs for each of the regions separately were conducted to identify the source of the interaction effects. A differential effect on astrocytes was noted by a significant HIV-1 Tat protein effect but not gp120 (see Table 2). As illustrated in Figure 4B for astrocytes and supported by planned comparisons significant increases were noted of the estimated total number of astrocytes for the Tat-treated group compared to the VEH-treated group (P ≤ 0.036) and for the combined gp120 + Tat group compared to the VEH-treated group (P ≤ 0.016). No other effect was noted to be significant. For oligodendrocytes no significant HIV-1 protein treatment effect was noted (see Table 2).
Cell Volume and Cell Area (Nucleator)
A three-way mixed model ANOVA (Cell Type × Tat × gp120) was conducted on the cell morphology in the DGH, including cell volume and cell area.
For cell volume, a significant main effect of cell type was noted, F(2, 32) = 481.0, PGG ≤ 0.001, with neurons > astrocytes > oligodendrocytes. No other significant effect or interaction was revealed, indicating that HIV-1 protein treatment did not affect cell volume of any of the three cell types (Fig. 5A).
FIGURE 5.
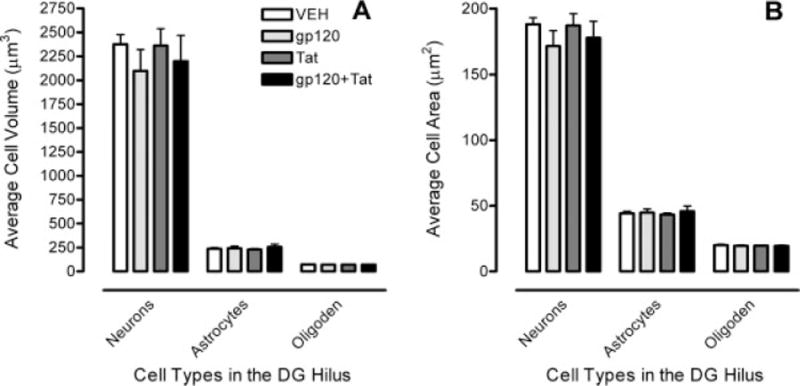
Cell morphology data in the hilus of the dentate gyrus (DGH) illustrate (A) cell volume with a significant cell type effect and (B) cell area with a significant cell type effect.
For cell area, the same effects were revealed as for cell volume. A main effect of cell type was noted, F(2, 32) = 1139.9, PGG ≤ 0.001, with neurons > astrocytes > oligodendrocytes. No other significant effect or interaction was demonstrated, indicating that HIV-1 protein treatment did not affect cell area of any of the three cell types (Fig. 5B).
DISCUSSION
The present developmental study provides evidence for a differential long-term impact of the HIV-1 proteins gp120 and Tat on the neuroanatomical parameters of the hippocampus in adult rats (~7½ month) following intrahippocampal injection on postnatal day (P)1. Using the optical fractionator as an unbiased stereological estimate, total neuron numbers in the CA2/3 were reduced by gp120 treatment, whereas the HIV-1 Tat protein decreased the number of neurons in the DGH in addition to the CA2/3 subfield neurons. Further, for glial cells, numbers of astrocytes in the DGH and SUB were increased by Tat protein, whereas no effects were noted for gp120. Finally, for oligodendrocytes Tat increased cell number in the DGH but not in any other region; gp120 had no detectable effects in any brain region.
The optical fractionator is a design-based stereological method, which is used to perform systematic random sampling of populations distributed within a series of serial sections containing the entire structure of interest to estimate true cell number in a volume of interest (West et al., 1991). The total neuron number estimated in each of the five subregions of the hippocampus is comparable with previous estimates that used the optical fractionator (West et al., 1991; Rapp and Gallagher, 1996; Sousa et al., 1997, 1998; Grady et al., 2003; Lister et al., 2005). The estimates approximate each other, with the small differences perhaps being attributable to the diversity of strains and ages of the animals used by the investigators.
The HIV-1 protein-induced neurotoxicity on the DGH and/or the CA2/3 subfield, specifically for Tat, is supported by other studies in adult animals and highlights the vulnerability of key components of the hippocampal trisynaptic circuit. Neuropathological findings indicate that Tat causes neuronal damage, synaptic alterations and glia activation in hippocampal regions, selectively in CA1, CA3/4 areas and dentate gyrus (Cheng et al., 1998; Bruce-Keller et al., 2003; Maragos et al., 2003; Behnisch et al., 2004; Fitting et al., 2006a). In one of these studies, continuous Tat 1–86 production was obtained by genetically engineered rat C6 glioma cells stereotaxically infused into the rat striatum and the hippocampus (Bruce-Keller et al., 2003). Results demonstrated that Tat was transported along anatomical pathways from the dentate gyrus to the CA3/4 region and from the striatum to the substantia nigra, resulting in impaired rotorod performance, neuronal damage, and reactive gliosis.
Both animal and tissue culture studies have shown that gp120 produces cell death in rodent hippocampal neurons (Brenneman et al., 1988; Lipton et al., 1995). A human study assessing the CA1, CA3, and CA4 regions of the hippocampus from eight AIDS-infected brains further supports the finding that specific regions of the hippocampus are particularly vulnerable to the virus or its components (Torres-Munoz et al., 2001). The selective vulnerability of hippocampal regions for HIV-1 infection is demonstrated by the expression of HIV-1 chemokine co-receptors on hippocampal pyramidal neurons. The expression of the HIV-1 chemokine co-receptors, CXCR4 and CCR5, on these neurons, is reported to correlate with AIDS-related injury (Petito et al., 2001). HIVE cases displayed increased neuronal CXCR4 and decreased neuronal CCR5 expression compared to non-HIVE AIDS patients as well as controls, with changes being most severe in CA3 and CA4 and lowest in CA1 regions. The commonalities of the findings of the Petito et al. (2000) study and the current study indicate the importance of the HIV-1 proteins and their major impact on the hippocampus.
Presently, the supporting glial cells, i.e. astrocytes and oligodendrocytes, were counted in two subareas of the hippocampus, the DGH and the SUB. The estimated total numbers of astrocytes and oligodendrocytes were increased by the HIV-1 Tat protein treatment, specifically in the DGH. No clear effect was noted for gp120 treatment. The counts of microglia were insufficient to make a precise estimate of the total number of cells, suggesting this cell type was not activated at the time point of sacrifice. However, astrogliosis is frequently reported in pediatric HIV-1 infection (Saito et al., 1994; Tornatore et al., 1994; Vallat et al., 1998) and is suggested to occur only if the insult includes the activation of microglia and the production of inflammatory cytokines in the perinatal CNS (Yong, 1998; Corasaniti et al., 2001a). Collectively, the present findings suggest that perinatal injection of the HIV-1 Tat protein at P1 likely induces an early activation of microglia and the production of inflammatory cytokines in the perinatal CNS. The activation of microglia immediately after acute HIV-1 protein injections at P1 would be expected to dissipate, but might induce a long-term astrocytic response. Future studies using specific immunohistochemical techniques for glia subtypes might be helpful to clearly distinguish oligodendrocytes from astrocytes and microglia.
Comparing our estimates of the total number of glial cells with the work of others, there is little basis of comparison. Estimates of the total number of astrocytes in the DGH for control animals of previous studies indicate similar results to our current study for the neonatal VEH-injected animals, with an estimation of ~52,000 astrocytes in the DGH (Grady et al., 2003) and an estimation of ~33,406 in the dentate gyrus (Sousa et al., 1997). For estimates of the total number of oligodendrocytes one would not argue close agreement with a prior study that estimated number of oligodendrocytes (Grady et al., 2003) and our developmental study. However, given the different parameters used in both of the studies, such as examining non-treated adult control animals (Grady et al., 2003) versus examining neonatal VEH-injected control animals, as well as large age differences at sacrifice (~P70 vs. ~P225, respectively), no valid conclusions can be made.
Even though differential effects were noted for neuronal number as well as glial cells, no interactive effects were observed for the combined gp120 + Tat treatment. This appears in contrast to previous in vivo or in vitro studies that demonstrated greater toxicity for the combined condition relative to either protein alone (Bansal et al., 2000; Wallace et al., 2006).
The lack of an interactive effect for the combined gp120 + Tat group in the present study needs to be further investigated with dose-response studies examining this issue in more detail. We addressed the question of combined effects for Tat and gp120 by mixing both proteins together prior to injection. Separate injections were not pursued due to the constraint of injection volume in neonatal brains.
Regarding the cell morphology in the DGH, the present study found no HIV-1 protein effects on cell volume and cell area. The lack of a significant HIV-1 protein effect on the morphology of neurons, astrocytes or oligodendrocytes versus the significant HIV-1 protein-induced neurotoxicity on number of cells, suggest that long-term effects might to be determined by the decreased number of neurons and increased number of glial cells rather than an alteration in cell morphology. The finding of specific long-term effects of the HIV-1 proteins on estimates of the total number of neurons and glial cells in particular subregions of the hippocampus are critical for the development of effective therapies that could enable the targeting of specific cellular reservoirs within the developing CNS.
Collectively, based on the data of the present developmental study there are three main findings that may contribute to the vulnerability to the HIV-1-induced effects: (1) Differential effects of gp120 and Tat on the estimated total number of neurons, as well as glial cells in specific hippocampal subregions. A relationship between neuronal loss and gliosis induced by HIV-1 protein neurotoxicity is suggested, which is consistent with the hypothesis that neuronal dysfunction or death could be secondary to HIV-1-related astrocyte dysfunction, the cell types that harbor HIV-1 infection (Brack-Werner, 1999). (2) A selective vulnerability of hippocampal neurons in the CA2/3 and the DGH to HIV-1 protein-related injury that finds support in human studies reporting a selective vulnerability of CA3 hippocampal neurons to AIDS-related injury (Petito et al., 2001). (3) HIV-1 protein effects on glial cells with an increase of the estimated total number of astrocytes and oligodendrocytes by Tat. Overall, these neuropathological alterations may, in part, explain the cognitive impairments seen following perinatal HIV-1 infection.
Acknowledgments
Grant sponsor: National Institute on Drug Abuse; Grant numbers: DA013137, DA014401; Grant sponsor: National Institute of Child Health and Human Development; Grant number: HD043680.
References
- Aksenov MY, Hasselrot U, Bansal AK, Wu G, Nath A, Anderson C, Mactutus CF, Booze RM. Oxidative damage induced by the injection of HIV-1 Tat protein in the rat striatum. Neurosci Lett. 2001;305:5–8. doi: 10.1016/s0304-3940(01)01786-4. [DOI] [PubMed] [Google Scholar]
- Aksenov MY, Hasselrot U, Wu G, Nath A, Anderson C, Mactutus CF, Booze RM. Temporal relationships between HIV-1 Tat-induced neuronal degeneration, OX-42 immunoreactivity, reactive astrocytosis, and protein oxidation in the rat striatum. Brain Res. 2003;987:1–9. doi: 10.1016/s0006-8993(03)03194-9. [DOI] [PubMed] [Google Scholar]
- Aksenova MV, Aksenov MY, Mactutus CF, Booze RM. Cell culture models of oxidative stress and injury in the central nervous system. Curr Neurovasc Res. 2005;2:73–89. doi: 10.2174/1567202052773463. [DOI] [PubMed] [Google Scholar]
- Aksenov MY, Aksenova MV, Nath A, Ray PD, Mactutus CF, Booze RM. Cocaine-mediated enhancement of Tat toxicity in rat hippocampal cell cultures: The role of oxidative stress and D1 dopamine receptor. Neurotoxicology. 2006a;27:217–228. doi: 10.1016/j.neuro.2005.10.003. [DOI] [PubMed] [Google Scholar]
- Aksenova MV, Silvers JM, Aksenov MY, Nath A, Ray PD, Mactutus CF, Booze RM. HIV-1 Tat neurotoxicity in primary cultures of rat midbrain fetal neurons: Changes in dopamine transporter binding and immunoreactivity. Neurosci Lett. 2006b;395:235–239. doi: 10.1016/j.neulet.2005.10.095. [DOI] [PubMed] [Google Scholar]
- AVMA. Report of the AVMA panel of euthanasia. Am Vet Med Assoc. 2001;218:671–696. doi: 10.2460/javma.2001.218.669. [DOI] [PubMed] [Google Scholar]
- Bagasra O, Lavi E, Bobroski L, Khalili K, Pestaner JP, Tawadros R, Pomerantz RJ. Cellular reservoirs of HIV-1 in the central nervous system of infected individuals: Identification by the combination of in situ polymerase chain reaction and immunohistochemistry. AIDS. 1996;10:573–585. doi: 10.1097/00002030-199606000-00002. [DOI] [PubMed] [Google Scholar]
- Bansal AK, Mactutus CF, Nath A, Maragos W, Hauser KF, Booze RM. Neurotoxicity of HIV-1 proteins gp120 and Tat in the rat striatum. Brain Res. 2000;879:42–49. doi: 10.1016/s0006-8993(00)02725-6. [DOI] [PubMed] [Google Scholar]
- Barks JD, Liu XH, Sun R, Silverstein FS. gp120, A human immunodeficiency virus-1 coat protein, augments excitotoxic hippocampal injury in perinatal rats. Neuroscience. 1997;76:397–409. doi: 10.1016/s0306-4522(96)00373-9. [DOI] [PubMed] [Google Scholar]
- Behnisch T, Francesconi W, Sanna PP. HIV secreted protein Tat prevents long-term potentiation in the hippocampal CA1 region. Brain Res. 2004;1012:187–189. doi: 10.1016/j.brainres.2004.03.037. [DOI] [PubMed] [Google Scholar]
- Belman AL, Diamond G, Dickson D, Horoupian D, Llena J, Lantos G, Rubinstein A. Pediatric acquired immunodeficiency syndrome. Neurologic syndromes. Am J Dis Child. 1988;142:29–35. doi: 10.1001/archpedi.1988.02150010039017. [DOI] [PubMed] [Google Scholar]
- Blanche S, Mayaux M-J, Rouzioux C, Teglas J-P, Firtion G, Monpoux F, Cicaru-Vigneron N, Meier F, Tricoire J, Courpotin C, Vilmer E, Griscelli C, Delfraissy J-F. Relation of the course of HIV infection in children to the severity of the disease in their mothers at delivery. N Engl J Med. 1994;330:308–312. doi: 10.1056/NEJM199402033300502. [DOI] [PubMed] [Google Scholar]
- Brack-Werner R. Astrocytes: HIV cellular reservoirs and important participants in neuropathogenesis. AIDS. 1999;13:1–22. doi: 10.1097/00002030-199901140-00003. [DOI] [PubMed] [Google Scholar]
- Brenneman DE, Westbrook GL, Fitzgerald SP, Ennist DL, Elkins KL, Ruff MR, Pert CB. Neuronal cell killing by the envelope protein of HIV and its prevention by vasoactive intestinal peptide. Nature. 1988;335:639–642. doi: 10.1038/335639a0. [DOI] [PubMed] [Google Scholar]
- Bruce-Keller AJ, Chauhan A, Dimayuga FO, Gee J, Keller JN, Nath A. Synaptic transport of human immunodeficiency virus-Tat protein causes neurotoxicity and gliosis in rat brain. J Neurosci. 2003;23:8417–8422. doi: 10.1523/JNEUROSCI.23-23-08417.2003. [DOI] [PMC free article] [PubMed] [Google Scholar]
- Bussiere JL, Hardy LM, Peterson M, Foss JA, Garman RH, Hoberman AM, Christian MS. Lack of developmental neurotoxicity of MN rgp 120/HIV-1 administered subcutaneously to neonatal rats. Toxicol Sci. 1999;48:90–99. doi: 10.1093/toxsci/48.1.90. [DOI] [PubMed] [Google Scholar]
- Cheng J, Nath A, Kundsen B, Hochman S, Geiger JD, Ma M, Magnuson DSK. Neuronal excitatory properties of human immunodeficiency virus type 1 Tat protein. Neuroscience. 1998;82:97–106. doi: 10.1016/s0306-4522(97)00174-7. [DOI] [PubMed] [Google Scholar]
- Corasaniti MT, Nistico R, Costa A, Rotiroti D, Bagetta G. The HIV-1 envelope protein, gp120, causes neuronal apoptosis in the neocortex of the adult rat: A useful experimental model to study NeuroAIDS. Funct Neurol. 2001a;16:31–38. [PubMed] [Google Scholar]
- Corasaniti MT, Piccirilli S, Paoletti A, Nistico R, Stringaro A, Malorni W, Finazzi-Agro A, Bagetta G. Evidence that the HIV-1 coat protein gp120 causes neuronal apoptosis in the neocortex of rat via a mechanism involving CXCR4 chemokine receptor. Neurosci Lett. 2001b;312:67–70. doi: 10.1016/s0304-3940(01)02191-7. [DOI] [PubMed] [Google Scholar]
- Del Corno M, Liu QH, Schols D, de Clercq E, Gessani S, Freedman BD, Collman RG. HIV-1 gp120 and chemokine activation of Pyk2 and mitogen-activated protein kinases in primary macrophages mediated by calcium-dependent, pertussis toxin-insensitive chemokine receptor signaling. Blood. 2001;98:2909–2916. doi: 10.1182/blood.v98.10.2909. [DOI] [PubMed] [Google Scholar]
- Dodd EE. Atlas of Histology. New York: McGraw-Hill; 1979. [Google Scholar]
- Epstein LG, Sharer LR, Joshi VV, Fojas MM, Koenigsberger MR, Oleske JM. Progressive encephalopathy in children with acquired immune deficiency syndrome. Ann Neurol. 1985;17:488–496. doi: 10.1002/ana.410170512. [DOI] [PubMed] [Google Scholar]
- Epstein LG, Sharer LR, Oleske JM, Connor EM, Goudsmit J, Bagdon L, Robert-Guroff M, Koenigsberger MR. Neurologic manifestations of human immunodeficiency virus infection in children. Pediatrics. 1986;78:678–687. [PubMed] [Google Scholar]
- Fitting S, Booze RM, Hasselrot U, Mactutus CF. Intrahippocampal injections of Tat: Effects on prepulse inhibition of the auditory startle response in adult male rats. Pharmacol Biochem Behav. 2006a;84:189–196. doi: 10.1016/j.pbb.2006.04.014. [DOI] [PubMed] [Google Scholar]
- Fitting S, Booze RM, Mactutus CF. Neonatal intrahippocampal glycoprotein 120 injection: The role of dopaminergic alterations in prepulse inhibition in adult rats. J Pharmacol Exp Ther. 2006b;318:1352–1358. doi: 10.1124/jpet.106.105742. [DOI] [PubMed] [Google Scholar]
- Fitting S, Booze RM, Mactutus CF. Neonatal hippocampal Tat injections: Developmental effects on prepulse inhibition (PPI) of the auditory startle response. Int J Dev Neurosci. 2006c;24:275–283. doi: 10.1016/j.ijdevneu.2006.02.001. [DOI] [PMC free article] [PubMed] [Google Scholar]
- Fitting S, Booze RM, Mactutus CF. Neonatal intrahippocampal gp120 injection: An examination early in development. Neurotoxicology. 2007;28:101–107. doi: 10.1016/j.neuro.2006.07.014. [DOI] [PMC free article] [PubMed] [Google Scholar]
- Gendelman HE, Lipton SA, Tardieu M, Bukrinsky MI, Nottet HS. The neuropathogenesis of HIV-1 infection. J Leukoc Biol. 1994;56:389–398. doi: 10.1002/jlb.56.3.389. [DOI] [PubMed] [Google Scholar]
- Grady MS, Charleston JS, Maris D, Witgen BM, Lifshitz J. Neuronal and glial cell number in the hippocampus after experimental traumatic brain injury: Analysis by stereological estimation. J Neurotrauma. 2003;20:929–941. doi: 10.1089/089771503770195786. [DOI] [PubMed] [Google Scholar]
- Greenhouse SW, Geisser S. On methods in the analysis of profile data. Psychometrika. 1959;32:95–112. [Google Scholar]
- Gundersen HJ, Jensen EB, Kieu K, Nielsen J. The efficiency of systematic sampling in stereology—Reconsidered. J Microsc. 1999;193:199–211. doi: 10.1046/j.1365-2818.1999.00457.x. [DOI] [PubMed] [Google Scholar]
- Hao HN, Lyman WD. HIV infection of fetal human astrocytes: The potential role of a receptor-mediated endocytic pathway. Brain Res. 1999;823:24–32. doi: 10.1016/s0006-8993(98)01371-7. [DOI] [PubMed] [Google Scholar]
- Haughey NJ, Mattson MP. Calcium dysregulation and neuronal apoptosis by the HIV-1 proteins Tat and gp120. J Acquir Immune Defic Syndr. 2002;31:555–561. doi: 10.1097/00126334-200210012-00005. [DOI] [PubMed] [Google Scholar]
- Hill JM, Mervis RF, Avidor R, Moody TW, Brenneman DE. HIV envelope protein-induced neuronal damage and retardation of behavioral development in rat neonates. Brain Res. 1993;603:222–233. doi: 10.1016/0006-8993(93)91241-j. [DOI] [PubMed] [Google Scholar]
- Jones MV, Bell JE, Nath A. Immunolocalization of HIV envelope gp120 in HIV encephalitis with dementia. AIDS. 2000;14:2709–2713. doi: 10.1097/00002030-200012010-00010. [DOI] [PubMed] [Google Scholar]
- Lee C, Liu QH, Tomkowicz B, Yi Y, Freedman BD, Collman RG. Macrophage activation through CCR5- and CXCR4-mediated gp120-elicited signaling pathways. J Leukoc Biol. 2003;74:676–682. doi: 10.1189/jlb.0503206. [DOI] [PubMed] [Google Scholar]
- Lipton SA. HIV-related neurotoxicity. Brain Pathol. 1991;1:193–199. doi: 10.1111/j.1750-3639.1991.tb00659.x. [DOI] [PubMed] [Google Scholar]
- Lipton SA, Brenneman DE, Silverstein FS, Masliah E, Mucke L. gp120 and neurotoxicity in vivo. Trends Pharmacol Sci. 1995;16:122. doi: 10.1016/s0165-6147(00)88998-1. [DOI] [PubMed] [Google Scholar]
- Lister JP, Blatt GJ, DeBassio WA, Kemper TL, Tonkiss J, Galler JR, Rosene DL. Effect of prenatal protein malnutrition on numbers of neurons in the principal cell layers of the adult rat hippocampal formation. Hippocampus. 2005;15:393–403. doi: 10.1002/hipo.20065. [DOI] [PubMed] [Google Scholar]
- Ma M, Nath A. Molecular determinants for cellular uptake of Tat protein of human immunodeficiency virus type 1 in brain cells. J Virol. 1997;71:2495–2499. doi: 10.1128/jvi.71.3.2495-2499.1997. [DOI] [PMC free article] [PubMed] [Google Scholar]
- Maragos WF, Tillman P, Jones M, Bruce-Keller AJ, Roth S, Bell JE, Nath A. Neuronal injury in hippocampus with human immunodeficiency virus transactivating protein, Tat. Neuroscience. 2003;117:43–53. doi: 10.1016/s0306-4522(02)00713-3. [DOI] [PubMed] [Google Scholar]
- Minagar A, Shapshak P, Fujimura R, Ownby R, Heyes M, Eisdorfer C. The role of macrophage/microglia and astrocytes in the pathogenesis of three neurologic disorders: HIV-associated dementia, Alzheimer disease, and multiple sclerosis. J Neurol Sci. 2002;202:13–23. doi: 10.1016/s0022-510x(02)00207-1. [DOI] [PubMed] [Google Scholar]
- Mintz M. Clinical comparison of adult and pediatric NeuroAIDS. Adv in Neuroimmunol. 1994;4:207–221. doi: 10.1016/s0960-5428(06)80259-7. [DOI] [PubMed] [Google Scholar]
- Mintz M. Neurological findings in pediatric HIV/AIDS Clinical features. In: Gendelman HE, Grant I, Everall IP, Lipton SA, Swindells S, editors. The Neurology of AIDS. Oxford: University Press; 2005. pp. 639–658. [Google Scholar]
- Nath A, Geiger J. Neurobiological aspects of human immunodeficiency virus infection: Neurotoxic mechanisms. Prog Neurobiol. 1998;54:19–33. doi: 10.1016/s0301-0082(97)00053-1. [DOI] [PubMed] [Google Scholar]
- Petito CK, Roberts B, Cantando JD, Rabinstein A, Duncan R. Hippocampal injury and alterations in neuronal chemokine co-receptor expression in patients with AIDS. J Neuropathol Exp Neurol. 2001;60:377–385. doi: 10.1093/jnen/60.4.377. [DOI] [PubMed] [Google Scholar]
- Pocernich CB, Boyd-Kimball D, Poon HF, Thongboonkerd V, Lynn BC, Klein JB, Calebrese V, Nath A, Butterfield DA. Proteomics analysis of human astrocytes expressing the HIV protein Tat. Mol Brain Res. 2005;133:307–316. doi: 10.1016/j.molbrainres.2004.10.023. [DOI] [PubMed] [Google Scholar]
- Rapp PR, Gallagher M. Preserved neuron number in the hippocampus of aged rats with spatial learning deficits. Proc Natl Acad Sci USA. 1996;93:9926–9930. doi: 10.1073/pnas.93.18.9926. [DOI] [PMC free article] [PubMed] [Google Scholar]
- Saito Y, Sharer LR, Epstein LG, Michaels J, Mintz M, Louder M, Golding K, Cvetkovich TA, Blumberg BM. Overexpression of nef as a marker for restricted HIV-1 infection of astrocytes in postmortem pediatric central nervous tissues. Neurology. 1994;44:474–481. doi: 10.1212/wnl.44.3_part_1.474. [DOI] [PubMed] [Google Scholar]
- Sharer LR. Pathology of HIV-1 infection of the central nervous system. J Neuropathol Exp Neurol. 1992;51:3–11. doi: 10.1097/00005072-199201000-00002. [DOI] [PubMed] [Google Scholar]
- Slomianka L, West MJ. Estimators of the precision of stereological estimates: An example based on the CA1 pyramidal cell layer of rats. Neuroscience. 2005;136:757–767. doi: 10.1016/j.neuroscience.2005.06.086. [DOI] [PubMed] [Google Scholar]
- Sousa N, Madeira MD, Paula-Barbosa MM. Structural alterations of the hippocampal formation of adrenalectomized rats: An unbiased stereological study. J Neurocytol. 1997;26:423–438. doi: 10.1023/a:1018573105987. [DOI] [PubMed] [Google Scholar]
- Sousa N, Madeira MD, Paula-Barbosa MM. Effects of corticosterone treatment and rehabilitation on the hippocampal formation of neonatal and adult rats. An unbiased stereological study. Brain Res. 1998;794:199–210. doi: 10.1016/s0006-8993(98)00218-2. [DOI] [PubMed] [Google Scholar]
- Takahashi K, Wesselingh SL, Griffin DE, McArthur JC, Johnson RT, Glass JD. Localization of HIV-1 in human brain using polymerase chain reaction/in situ hybridization and immunocytochemistry. Ann Neurol. 1996;39:705–711. doi: 10.1002/ana.410390606. [DOI] [PubMed] [Google Scholar]
- Thompson KA, Churchill MJ, Gorry PR, Sterjovski J, Oelrichs RB, Wesselingh SL, McLean CA. Astrocyte specific viral strains in HIV dementia. Ann Neurol. 2004;56:873–877. doi: 10.1002/ana.20304. [DOI] [PubMed] [Google Scholar]
- Tornatore C, Chandra R, Berger JR, Major EO. HIV-1 infection of subcortical astrocytes in the pediatric central nervous system. Neurology. 1994;44:481–487. doi: 10.1212/wnl.44.3_part_1.481. [DOI] [PubMed] [Google Scholar]
- Torres-Munoz J, Stockton P, Tacoronte N, Roberts B, Maronpot RR, Petito CK. Detection of HIV-1 gene sequences in hippocampal neurons isolated from postmortem AIDS brains by laser capture microdissection. J Neuropathol Exp Neurol. 2001;60:885–892. doi: 10.1093/jnen/60.9.885. [DOI] [PubMed] [Google Scholar]
- Trillo-Pazos G, Diamanturos A, Rislove L, Menza T, Chao W, Belem P, Sadiq S, Morgello S, Sharer L, Volsky DJ. Detection of HIV-1 DNA in microglia/macrophages, astrocytes and neurons isolated from brain tissue with HIV-1 encephalitis by laser capture microdissection. Brain Pathol. 2003;13:144–154. doi: 10.1111/j.1750-3639.2003.tb00014.x. [DOI] [PMC free article] [PubMed] [Google Scholar]
- UNAIDS/WHO. AIDS Epidemic Update. UNAIDS; 2006. Online Database. [Google Scholar]
- Vallat AV, De GU, He J, Mhashilkar A, Marasco W, Shi B, Gray F, Bell J, Keohane C, Smith TW, Gabuzda D. Localization of HIV-1 co-receptors CCR5 and CXCR4 in the brain of children with AIDS. Am J Pathol. 1998;152:167–178. [PMC free article] [PubMed] [Google Scholar]
- Valle LD, Croul S, Morgello S, Amini S, Rappaport J, Khalili K. Detection of HIV-1 Tat and JCV capsid protein, VP1, in AIDS brain with progressive multifocal leukoencephalopathy. J Neurovirol. 2000;6:221–228. doi: 10.3109/13550280009015824. [DOI] [PubMed] [Google Scholar]
- Wallace DR, Dodson S, Nath A, Booze RM. Estrogene attenuates gp120- and tat1-72-induced oxidative stress and prevents loss of dopamine transporter function. Synapse. 2006;59:51–60. doi: 10.1002/syn.20214. [DOI] [PubMed] [Google Scholar]
- West MJ, Slomianka L, Gundersen HJ. Unbiased stereological estimation of the total number of neurons in the subdivisions of the rat hippocampus using the optical fractionator. The Anat Rec. 1991;231:482–497. doi: 10.1002/ar.1092310411. [DOI] [PubMed] [Google Scholar]
- WHO. Epidemiological Fact Sheets on HIV/AIDS and Sexually Transmitted Infections. Update. UNAIDS/WHO; 2006. Global HIV/AIDS. Online Database. [Google Scholar]
- Wiley CA, Nelson JA. Human immunodeficiency virus: Infection of the nervous system. Current Topics in Microbiology and Immunology. 1990;160:157–172. doi: 10.1007/978-3-642-75267-4_10. [DOI] [PubMed] [Google Scholar]
- Wiley CA, Soontornniyomkij V, Radhakrishnan L, Masliah E, Mellors J, Hermann SA, Dailey P, Achim CL. Distribution of brain HIV load in AIDS. Brain Pathol. 1998;8:277–284. doi: 10.1111/j.1750-3639.1998.tb00153.x. [DOI] [PMC free article] [PubMed] [Google Scholar]
- Winer BJ. Statistical Principles in Experimental Design. New York: McGraw-Hill; 1971. [Google Scholar]
- Yi Y, Lee C, Liu QH, Freedman BD, Collman RG. Chemokine receptor utilization and macrophage signaling by human immunodeficiency virus type 1 gp120: Implications for neuropathogenesis. J Neurovirol. 2004;10(Suppl 1):91–96. doi: 10.1080/753312758. [DOI] [PubMed] [Google Scholar]
- Yong VW. Response of astrocytes and oligodendrocytes to injury. Ment Retard Dev Disabil. 1998;4:193–199. [Google Scholar]