Abstract
Purpose
σRs are non-opioid, non-phencyclidine binding sites with robust neuroprotective properties. Previously, we induced death in the RGC-5 cell line using very high concentrations (1 mM) of the excitatory amino acids glutamate (Glu) and homocysteine (Hcy) and demonstrated that the σR1 ligand (+)-pentazocine ((+)-PTZ) could protect against cell death. The purpose of the present study was to establish a physiologically relevant paradigm for testing the neuroprotective effect of (+)-PTZ in retinal ganglion cells.
Methods
Primary ganglion cells (1°GCs) were isolated by immunopanning from retinas of 1-day-old mice, maintained in culture for 3 days and then exposed to 10, 20, 25 or 50 µM Glu or 10, 25, 50 or 100 µM Hcy for 6 or 18 h in the presence or absence of (+)-PTZ (0.5, 1, 3 µM). Cell viability was measured using the Live/Dead and ApopTag Fluorescein In Situ Assays. Expression of σR1 was assessed by immunocytochemistry, RT-PCR and western blotting. Morphological appearance of live ganglion cells and their processes was examined over time (0, 3, 6, 18 h) by differential interference contrast (DIC) microscopy following exposure to excitotoxins in the presence or absence of (+)-PTZ.
Results
1°GCs showed robust σR1 expression. The cells are exquisitely sensitive to Glu or Hcy toxicity (6 h treatment with 25 or 50 µM Glu or 50 or 100 µM Hcy induced marked cell death). 1°GCs pre-treated 1 h with (+)-PTZ followed by 18 h co-treatment with 25 µM Glu and (+)-PTZ showed a marked decrease in cell death: (25 µM Glu alone: 50%; 25 µM Glu/0.5 µM (+)-PTZ: 38%; 25 µM Glu/1 µM (+)-PTZ: 20%; 25 µM Glu/3 µM (+)-PTZ: 18%). Similar results were obtained with Hcy. σR1 mRNA and protein levels did not change in the presence of the excitotoxins. DIC examination of cells exposed to excitotoxins revealed substantial disruption of neuronal processes; co-treatment with (+)-PTZ revealed marked preservation of these processes. The stereoselective effect of (+)-PTZ for σR1 was established in experiments in which (−)-PTZ, the levo-isomer form of pentazocine, had no neuroprotective effect on excitotoxin-induced ganglion cell death.
Conclusions
1°GCs express σR1; their marked sensitivity to Glu and Hcy toxicity mimics the sensitivity observed in vivo, making them a highly relevant model for testing neuroprotection. Pre-treatment of cells with 1–3 µM (+)-PTZ, but not (−)-PTZ affords significant protection against Glu- and Hcy-induced cell death. σR1 ligands may be very useful therapeutic agents in retinal diseases in which ganglion cells die.
Keywords: sigma receptor, ganglion cells, neuroprotection, (+)-pentazocine ((+)-PTZ), primary neuronal culture
Introduction
Sigma receptors represent unique non-opiate, non-phencyclidine binding sites in mammalian brain and peripheral organs, distinct from other known receptors [1]. To date, two types of sigma receptors, distinguishable by biochemical and pharmacological means, have been identified [2]. The cDNA encoding type 1 sigma receptor (σR1), the better characterized of the two subtypes, was cloned initially from guinea pig [3] and subsequently from human, mouse and rat [4–7]. The σR1 cDNA predicts a protein of 223 amino acids (Mr 25–28 kD) [3]. Ligands for σR1 demonstrate robust neuroprotective properties, particularly against excitotoxic insults, including decreased neuronal responsivity to NMDA receptor stimulation [8, 9], attenuation of postsynaptic glutamate-evoked calcium influx [10, 11], inhibition of ischemia-induced glutamate release [12, 13], and reduced NO production [14, 15].
σR1 expression has been demonstrated in ocular tissues including lacrimal gland [16], iris-ciliary body [17, 18], lens [18, 19] and retina [18, 20]. Using molecular and biochemical methods we have studied σR1 in mouse retina [18, 21, 22]. RT-PCR analysis amplified σR1 in neural retina and the RPE-choroid complex. In situ hybridization studies revealed abundant expression of σR1 in the ganglion cell layer, inner nuclear layer, inner segments of photoreceptor cells, and RPE cells. Immunohistochemical analysis confirmed these observations. Recent studies using primary cultures of mouse Müller cells localized σR1 to the ER and nuclear membranes [22]. These cells and other retinal cell types demonstrate robust σR1 binding activity with an apparent Kd value of ~ 25 nM [22].
Additional studies from our lab have focused on retinal ganglion cells, the second order neurons of the visual system. Ganglion cells die in several retinal diseases including glaucoma and diabetic retinopathy [23, 24]. Our earlier work showed that σR1 continues to be expressed in neural retina under hyperglycemic conditions and during diabetic retinopathy [21], making it a promising target for neuroprotection against cell death in these diseases. To test the neuroprotective properties of σR1 ligands in ganglion cells, we first used the rat ganglion cell line, RGC-5 to determine whether (+)-pentazocine ((+)-PTZ), a highly selective benzomorphan-based sigma receptor ligand [25], can block RGC-5 cell death induced by excitotoxins such as glutamate (Glu) [26]. The results were promising. The concentrations of Glu required to induce death in this cell line, however, were extremely high (millimolar range), despite the fact that in vivo ganglion cells are sensitive to micromolar (greater than 15 µM) concentrations of Glu [27]. In addition, RGC-5 cells, like many transformed cell lines, replicate in culture, which is not a characteristic feature of neurons in vivo. Finally, the RGC-5 cell line does not form extensive processes characteristic of neurons, making it impossible to analyze effects of excitotoxins on neuronal processes. For these reasons, it was essential to determine whether our earlier promising results of neuroprotective effects of (+)-PTZ observed in the RGC-5 cell line could be replicated in a physiologically relevant system. Recently, we established the culture of primary ganglion cells from the mouse retina. Using the immunopanning procedures initially described for rats, we optimized the isolation and purification of these cells from neonatal mouse retina [28]. The cells are positive for neuronal markers and for Thy1, which is considered a specific marker of retinal ganglion cells. In the present study we found that the primary ganglion cells, like ganglion cells in the intact retina, form extensive neuronal processes and are exquisitely sensitive to glutamate; hence the model is highly relevant to studies of neuroprotection.
In addition to assessing the efficacy of σR1 ligands in preventing Glu-induced ganglion cell death, we wanted to explore more fully the toxic effects of homocysteine (Hcy) on primary ganglion cells and to determine whether deleterious effects of exposure to Hcy were reversible using (+)-PTZ. Hcy, a non-protein sulfur amino acid, is a metabolite of the essential amino acid methionine. Modest plasma elevation of Hcy is a risk factor in cardiovascular and neurodegenerative diseases [29–31]. Less is known about the effects of Hcy on retinal function, though several clinical studies implicate Hcy in maculopathy, retinal vein occlusion, open-angle glaucoma, pseudoexfoliation glaucoma, and diabetic retinopathy [32–40]. A recent report of a child with severe hyperhomocysteinemia due to methionine synthase deficiency demonstrated decreased rod response and RGC loss as analyzed by ERG and visual evoked potential [41]. We have attempted to understand the consequences of elevated levels of Hcy on retinal function using in vitro and in vivo models. In a study using mice, we injected micromolar concentrations of Hcy intravitreally and observed apoptotic RGC death [27], thus providing the first report of homocysteine-induced retinal ganglion cell death in vivo. The present study explored the sensitivity of primary ganglion cells to micromolar concentrations of Hcy and analyzed the role of σR1 in preventing this excitotoxin-induced cell death. The data show that primary ganglion cells are exquisitely sensitive to the toxic effects of Glu and Hcy; (+)-PTZ can prevent that cell death.
Materials and Methods
Reagents
Reagents were obtained from the following sources: Neurobasal™ medium, B27, TRIzol reagent (Gibco-Life Technologies, Rockville, MD); trypsin inhibitor (Roche Applied Science, Indianapolis, IN); papain (Worthington Biochemical, Lakewood, NJ); brain-derived neurotrophic factor (BDNF), ciliary neurotrophic factor (CNTF), and basic fibroblast growth factor (bFGF), (PeproTech, Rocky Hill, N.J.); Affinipure goat anti-rabbit IgG (H+L) and goat anti-rat IgG (H+L), (Jackson ImmunoResearch Laboratories, West Grove, PA); goat anti-mouse IgG-HRP, goat anti-rabbit IgG-HRP (Santa Cruz Biotechnology, Santa Cruz, CA); ECL detection kit, (Pierce Biotechnology, Rockford, IL); GeneAmp RNA PCR kit, (Applied Biosystems, Branchburg, NJ); TaKaRa Taq PCR kit (Takara Bio Inc, Otsu, Shiga, Japan); sense and antisense primers for σR1 (Integrated DNA Technologies, Coralville, IA); Live-Dead Assay (Molecular Probes, Eugene, OR); ApopTag Fluorescein In Situ Apoptosis Detection Kit (Chemicon International, Temecula, CA); D,L-homocysteine thiolactone hydrochloride (MP Biomedical, Inc., Solon, OH); L-glutamate, (+)-pentazocine, (−)-pentazocine, monoclonal antibodies to β–actin and neurofilament 160 (NF-160), and all other chemicals (Sigma-Aldrich Chemical Company, St. Louis, MO).
Isolation and culture of primary ganglion cells
Retinal ganglion cells (1°GCs) were isolated from ~1–2 day-old C57BL/6J mice, which were the offspring of breeding pairs purchased from Harlan Sprague-Dawley, Indianapolis, IN. Care and use of the mice adhered to the principles set forth in the ARVO statement for use of animals in ophthalmic and vision research. The immunopanning procedures and verification of purity of the cells have been described in detail [28]. Cells were cultured on poly D–lysine and laminin-coated coverslips in Neurobasal medium containing 5 µg/ml insulin, 1 mM sodium pyruvate, 0.1 mg/ml transferrin, 60 ng/ml progesterone, 16 µg/ml putrescine, 40 ng/ml sodium selenite, 40 ng/ml triiodothyronine, 1 mM L–glutamine, 60 µg/ml N–acetyl cysteine, 2% B27, 50 ng/ml BDNF, 10 ng/ml CNTF, 10 ng/ml forskolin, 10 ng/ml bFGF, and 0.1 mg/ml BSA.
Immunocytochemical analysis of σR1
To establish the presence of σR1 in 1°GCs, cells were cultured on coverslips, fixed in methanol, blocked with Power Block and incubated 3 h at room temperature with either antibody against σR1 [26] or antibody against NF 160, a known neuronal cell marker. Proteins were detected using Alexa-Fluor-488–conjugated anti-rabbit IgG for σR1 and Alexa-Fluor-488–conjugated anti-mouse IgG for NF 160. Samples were washed with PBS and slides were covered with Vectashield mounting medium containing 4,6-diamidino-2-phenylindole (DAPI) to stain nuclei. σR1 and NF-160 were detected by epifluorescence using a Zeiss Axioplan–2 microscope, equipped with the axiovision program, and an HRM camera.
Sensitivity of 1°GCs to excitotoxic amino acids and treatment with (+)- pentazocine
To determine the concentration of the excitotoxin that induced 50% cell death, 1°GCs, cultured on coverslips in 24-well plates, were exposed to varying concentrations of Glu (10, 20, 25 or 50 µM) and subjected to the Live-Dead Assay, which uses calcein-acetoxymethyl ester to detect living cells and ethidium homodimer-1 to detect dead cells, following the manufacturer’s instructions. Cells were viewed by epifluorescence using different filters to detect cells with green fluorescence (live) or red fluorescence (dead). Cell viability was confirmed using the ApopTag kit following the directions of the manufacturer. The kit is based on the detection of DNA strand breaks via terminal dUTP nick end labeling (TUNEL) analysis. In experiments testing the effects of Hcy (10, 25, 50, 100 µM) on ganglion cell viability, TUNEL analysis was used. The effects of exposure of excitotoxin-treated cells to (+)-PTZ were assessed by treating cells with either 25 µM Glu or 50 µM Hcy in the presence of varying concentrations of (+)-PTZ (0.5, 1 or 3 µM). Cell viability was assessed using the ApopTag kit. Treatment paradigms included co-culture of cells with the excitotoxin and (+)-PTZ for 6 h or pre-treatment of cells 1 h with (+)-PTZ, followed by co-culture with the excitotoxin and (+)-PTZ for 6 or 18 h. Cells were examined by epifluorescence using standard fluorescein excitation and emission filters and data were captured for image analysis. Each field was examined systematically for the presence of green fluorescence, indicative of apoptosis, and data were expressed per total number of cells in the field. In these experiments, at least three coverslips were prepared. Per coverslip, images were captured from at least 4 fields using the Axiovision software system. Data were analyzed by one-way Analysis of Variance using the SPSS statistical package (version 15.0). LSD (least significant difference) was the post-hoc test. A p value of <0.05 was considered significant. Additional experiments were performed in which 1°GCs were pre-treated 1 h with either (−)-PTZ (the levo-isomer of pentazocine) or (+)-PTZ (the dextro-isomer) and were then co-incubated with 25 µM Glu for 18 h. In further experiments, live ganglion cells were subjected to differential interference contrast (DIC) microscopy using a Nikon eclipse TE300 inverted microscope. The cell bodies and fibers radiating from them were photographed using a CoolSnap camera at 0, 3, 6 and 18 h following treatment with Glu or Hcy in the presence or absence of (+)-PTZ.
Semiquantitative and real-time RT-PCR analysis of σR1 mRNA
To determine whether σR1 gene expression was altered in 1°GCs treated with excitotoxins in the presence or absence of (+)-PTZ, total RNA was prepared from the cells using TRIzol. RT-PCR was carried out using primer pairs specific for mouse σR1 [42]. The sense primer 5’-TAT CGC AGT GCT GAT CCA −3’ and the antisense primer 5’-TAC TCC ACC ATC CAC GTG TT-3’ correspond to nucleotide position 75–92 and 520–539, respectively, in the cloned mouse σR1 cDNA (GenBank accession no. AF030198). The expected PCR product size is 465 bp. 18S RNA was the internal standard. RT-PCR was done at 35 cycles, with a denaturing phase of 1 min at 94°C, annealing phase of 1 min at 60°C, and an extension of 2 min at 75°C. 20 µl of the PCR products were gel electrophoresed and stained with ethidium bromide. The signals were quantified using the STORM phosphorimaging system as described [26].
For real-time RT-PCR, total RNA was extracted using TRIzol Reagent and quantified. RNA (5 µg) was reverse transcribed using the GeneAmp RNA PCR Kit (Applied Biosystems). cDNA's were amplified for 45 cycles in an iCycler (Bio-Rad,) using iQ™SYBR Green Supermix (Bio-Rad Laboratories, Hercules, CA) and sequence-specific primers for mouse σR1 (sense primer 5’-CTC GCT GTC TGA GTA CGT G-3’; anti-sense primer 5’-AAG AAA GTG TCG GCT AGT GCA A-3’). The internal reference was hypoxanthine phosphoribosyltransferase 1 (HPRT1) for which the primers were: sense primer 5’-GCG TCG TGA TTA GCG ATG ATG AAC-3’; anti-sense primer 5’-CCT CCC ATC TCC TTC ATG ACA TCT-3’. Expression of σR1 relative to HPRT1 was calculated by comparison of Ct values (delta-delta Ct).
Immunoblot analysis of σR1
Western blotting of σR1 protein in primary retinal ganglion cells followed our published method [22]. After protein samples were subjected to SDS-PAGE and transferred to nitrocellulose membranes, the membranes were incubated with anti-σR1 antibody (1:500) followed by incubation with HRP-conjugated goat anti-rabbit IgG antibody (1:3000). Proteins were visualized using the ECL western blot detection system. Membranes were reprobed with mouse monoclonal anti-β-actin antibody (1:5000) as a loading control. The films were analyzed using the AlphaIMager 2200 digital imaging system as described [21].
Results
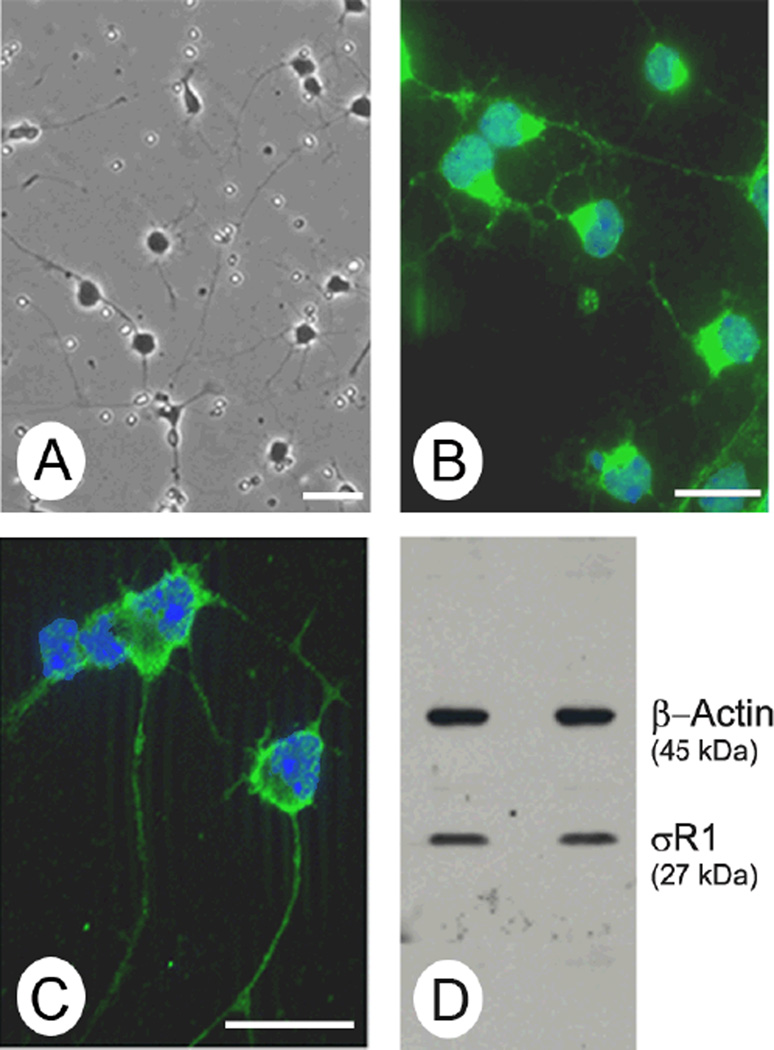
σR1 has been detected in intact retinal tissue including cells of the ganglion cell layer [18]. To determine whether the 1°GCs used in this study express σR1, we performed immunocytochemistry and immunoblotting. The 1°GCs develop extensive processes and variably sized cell bodies (Fig. 1A), which are characteristic of ganglion cells in vivo. They are positive for the neuronal cell marker NF-160 (Fig. 1B) and the ganglion cell-specific marker Thy-1 [28]. σR1 is detected in 1°GCs by immunocytochemistry (Fig. 1C) and by immunoblotting (Fig. 1D). Thus, the cells are a useful and relevant model for studies of the protective role of σR1 ligands.
Fig. 1. Detection of σR1 in 1°GCs isolated from mouse retina.
(A). Phase contrast images of primary mouse retinal ganglion cells (1°GCs) after 3 days in culture. The cells have long processes extending from the variably sized cell bodies, which are characteristics of ganglion cells. (B). Immunolabeling of 1°GCs with an antibody against NF-160, a neuronal marker detected with Alexafluor 488 (green), nuclei stained with DAPI (blue). (C). Immunolabeling of 1°GCs with an affinity-purified polyclonal antibody against σR1, detected with Alexafluor 488 (green), nuclei stained with DAPI (blue). (D). Two separate preparations (left and right lanes) of 1°GCs used for immunoblotting with an affinity-purified antibody against σR1 (Mr ~27 kDa) and an antibody against β-actin (Mr ~45 kDa, internal loading control). (Magnification bar = 15 µm)
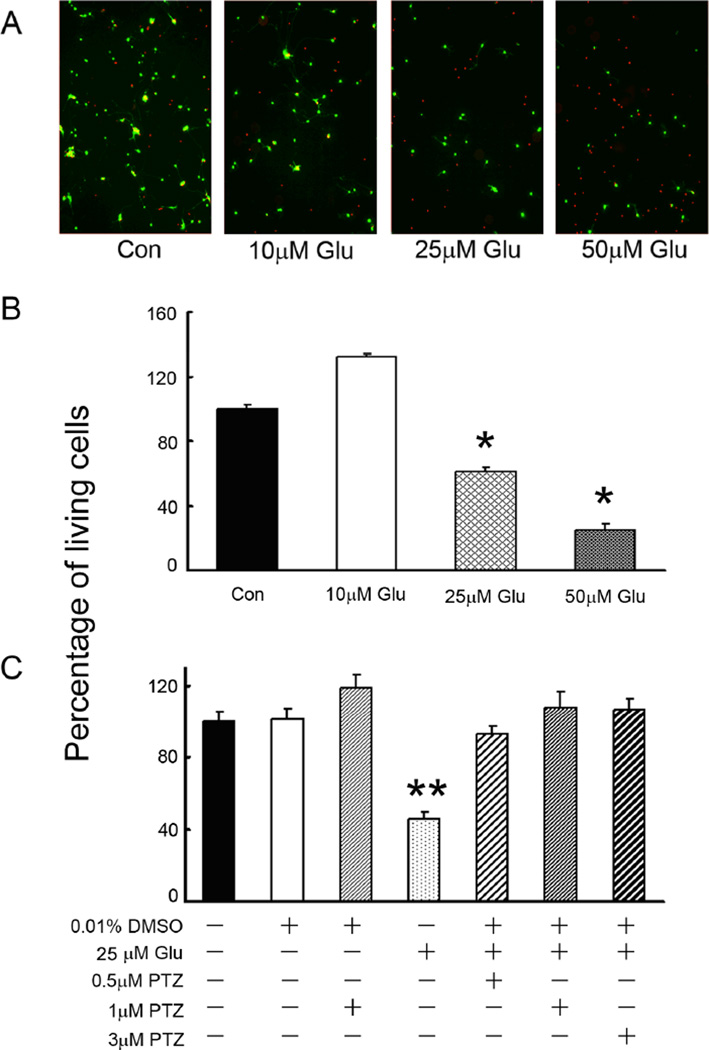
In vivo, the intracellular concentration of Glu in neurons can be as high as 10 mM; however the extracellular concentration of Glu must be maintained in the micromolar range to avoid toxicity [43]. To determine whether the 1°GCs used in this study exhibited similar sensitivity to extracellular Glu as in in vivo, the cells were cultured in Neurobasal supplemented-medium for 3 days and then 6 h in medium containing increasing concentrations of Glu. Cell viability was assessed using the live/dead assay (Fig. 2A); living cells are green and dead/dying cells are red. Cells incubated in medium with a final concentration of 10 µM Glu had excellent viability, but in the presence of 25 µM or 50 µM Glu, cell viability decreased by ~50% and ~80%, respectively (Fig. 2B). Subsequent experiments used 25 µM Glu to induce cell death in the 1°GCs. Using the live/dead assay, the number of living cells were determined in 1°GCs exposed to 25 µM Glu alone or in 1°GCs pre-treated for 1 h with varying concentrations of (+)-PTZ and then co-incubated 16 h with (+)-PTZ and 25 µM Glu. Pretreatment of cells with 0.5, 1 or 3 µM (+)-PTZ resulted in markedly fewer dead cells than in cells exposed to Glu in the absence of (+)-PTZ (Fig. 2C).
Fig. 2. Neuroprotective effect of (+)-PTZ on glutamate (Glu)-induced 1°GC death.
(A) Photomicrographs of the live/dead assay in 1°GCs exposed 6 h to Neurobasal medium with no additional Glu (control) or to Neurobasal containing 10 µM, 25 µM and 50 µM Glu. Living cells fluoresce green; dead cells fluoresce red. (B) Quantitation of live 1°GCs following exposure to Glu (10, 25 and 50 µM) for 6 h, (*, significantly different from control and 10 µM Glu, p<0.001); (C) 1°GCs were pretreated with (+)-PTZ (0.5, 1, 3 µM) for 1 h and then co-exposed to 25 µM Glu and (+)-PTZ (0.5, 1, 3 µM) for an additional 16 h. Cells were subjected to the live/dead assay to determine viability. (**, significantly different from control cells (not treated with Glu) and from cells exposed to Glu and (+)-PTZ, p<0.001). Data in panels B and C are expressed as the mean and S.E. of the ratio of living cells to the total number of cells; data were normalized to the control value which was considered 100%, n = 10
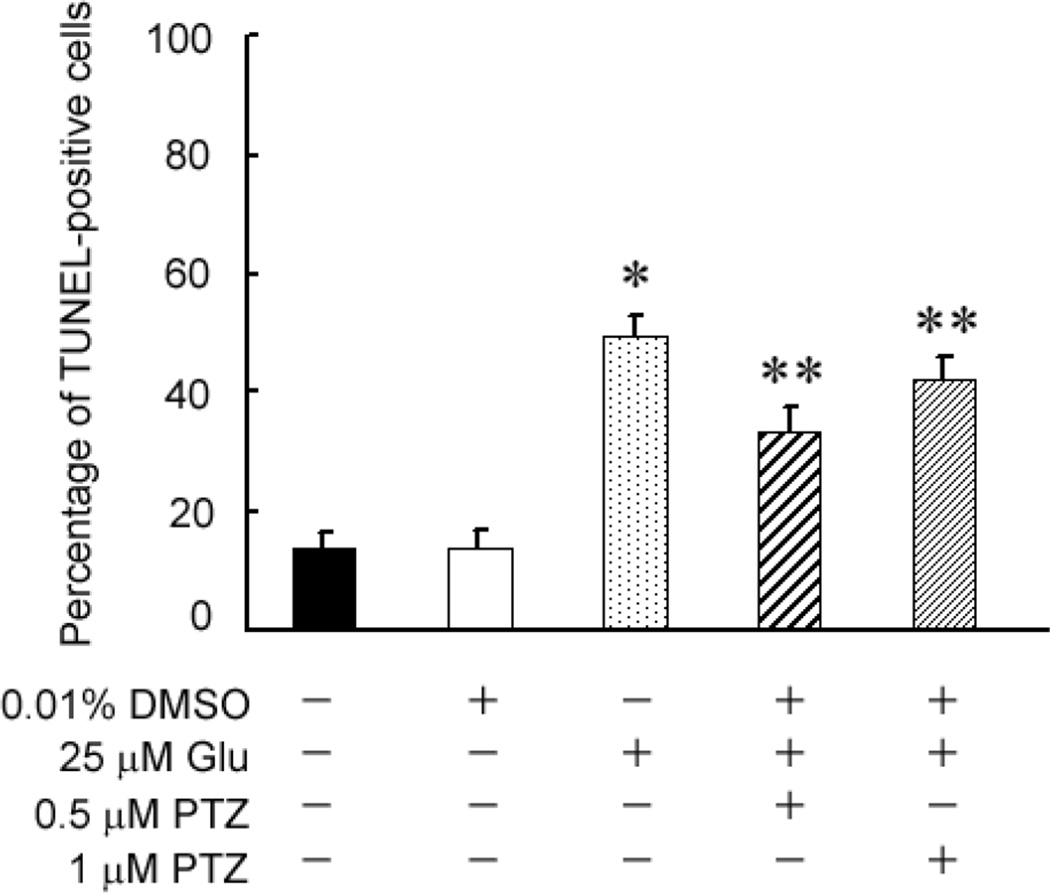
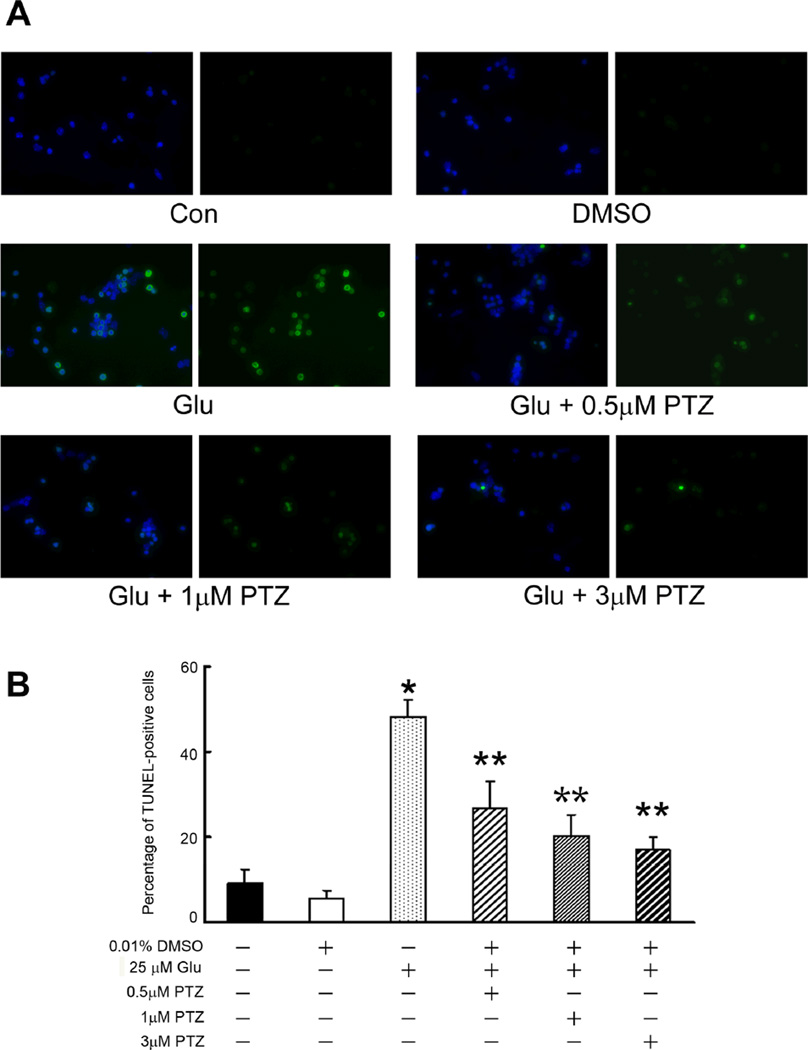
To confirm and extend the findings described in figure 2, a second cell viability measure, the TUNEL assay, which detects DNA strand breaks in cells and is an indicator of apoptosis, was used. We asked whether pre-treating the cells 1 h with varying concentrations of (+)-PTZ followed by a 6 h co-treatment with 25 µM Glu and (+)-PTZ would protect the cells against death. Fig. 3 shows that control cells and cells incubated with 0.01% DMSO (vehicle control), had ~10% TUNEL-positive cells. Exposure of cells for 6 h to 25 µM Glu led to ~50% TUNEL-positive cells, consistent with data obtained using the live/dead assay (Fig. 2B). Pre-treatment of 1°GCs with (+)-PTZ and followed by 6 h co-treatment with Glu and (+)-PTZ reduced the number of TUNEL-positive cells slightly, but significantly, compared to cells treated with Glu alone. We next asked whether a longer co-treatment time period with Glu and (+)-PTZ would alter the incidence of cell death (Fig. 4). Cells were pre-treated with (+)-PTZ (0.5, 1 or 3 µM) for 1 h followed by 18 h co-incubation with these concentrations of (+)-PTZ and 25 µM Glu. Fig. 4A shows representative photomicrographs of the TUNEL assay when cells received no treatment, were treated with vehicle (0.01% DMSO), Glu (25 µM) or Glu plus (+)-PTZ (0.5, 1, or 3 µM). The green fluorescence reflects cells undergoing apoptosis. Cells treated with increasing dosages of (+)-PTZ showed significantly fewer TUNEL-positive cells. These results were quantified (Fig. 4B) and the data show that the longer co-treatment time (18 h) led to a highly significant decrease in the number of TUNEL-positive cells.
Fig. 3. Assessment of the number of TUNEL-positive 1°GCs following 6 h incubation with Glu in the absence or presence of (+)-pentazocine ((+)-PTZ).
1°GCs were pre-treated for 1 h with or without (+)-PTZ (0.5 or 1 µM) followed by co-incubation for 6 h with Glu (25 µM) and (+)-PTZ (0.5 or 1 µM); the number of TUNEL-positive cells was determined using the ApopTag fluorescein method. Data are expressed as the mean and S.E. of the ratio of dead/dying (TUNEL-positive) cells to the total number of cells, n = 10 (*, significantly different from untreated control or vehicle (DMSO) control at p<0.001; **, significantly different from treatment with 25 µM Glu alone (without (+)-(+)-PTZ)).
Fig. 4. Assessment of the number of TUNEL-positive 1°GCs when pretreated with (+)-PTZ and then co-incubated 18 h with Glu and (+)-PTZ.
(A) Representative photomicrographs showing results of the TUNEL assay. Cells that fluoresce green are TUNEL-positive indicative of apoptosis. All samples were labeled also with DAPI (blue) to stain nuclei. For each pair of photomicrographs, the left image shows the merged (DAPI plus TUNEL staining) and the right image shows only the TUNEL staining. From above downward, the top panels show representative images of cells that received no Glu exposure (control, DMSO vehicle control); the middle panel (Glu) shows marked increase in TUNEL-positive cells following 18 h exposure to 25 µM glutamate. The remaining three panels show fewer TUNEL-positive cells when pre-treated and co-incubated with (+)-PTZ (0.5, 1 or 3 µM). (B) Quantification of the data from TUNEL analysis shown in panel A. The number of TUNEL-positive cells was determined per 100 cells counted. Data are expressed as the mean and S.E. of the ratio of dead/dying cells to the total number of cells, n = 10 (*, significantly different from control, p<0.001; **, significantly different from treatment with 25 µM Glu alone (without (+)-(+)-PTZ)).
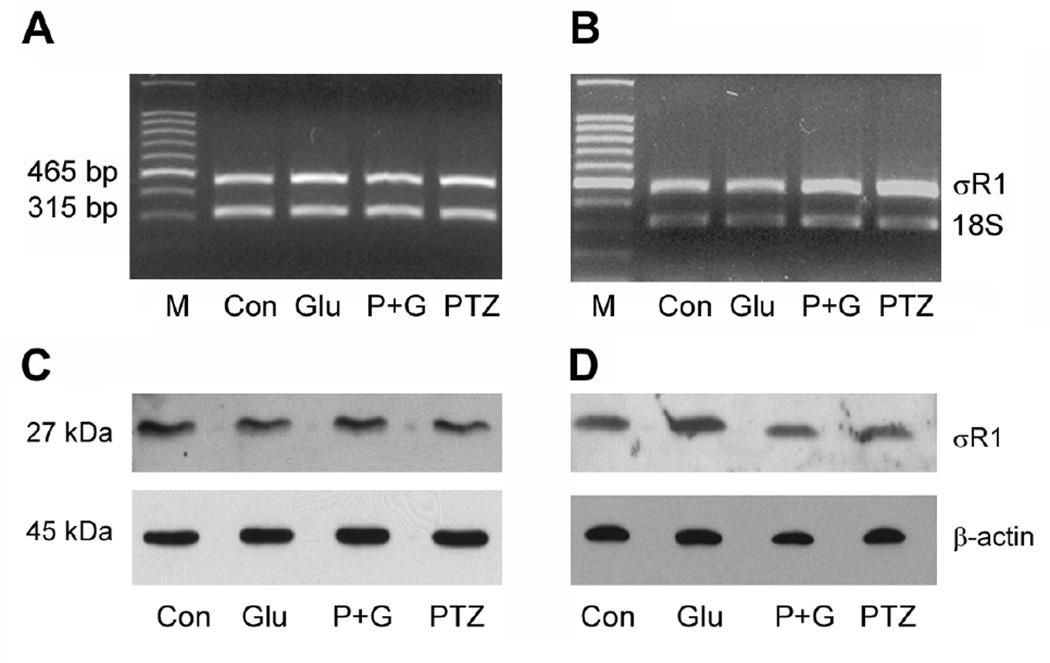
To determine whether the protective effects of (+)-PTZ against Glu-induced cell death were associated with alterations in σR1 gene expression, 1°GCs were cultured in the presence of 25 µM Glu for 6 or 18 h in the presence or absence of 3 µM (+)-PTZ (pre-treatment 1 h plus co-treatment). Semi-quantitative RT-PCR was performed with RNA isolated from control and treated cells. 18S mRNA was analyzed as an internal control. The data showing RT-PCR amplification of the two bands (465 and 315 bp) representing σR1 and 18S, respectively are presented in Fig. 5A (6 h co-treatment) and 5B (18 h co-treatment). Quantitation of the band densities showed that there were negligible differences in the expression of σR1 in 1°GCs whether they were exposed to 25 µM Glu for 6 or 18 h in the presence or absence of (+)-PTZ (data not shown). While the σR1 mRNA levels were similar in 1°GCs exposed to Glu in the presence or absence of (+)-PTZ, it was not certain that protein levels were comparable. To investigate this 1°GCs were cultured in medium containing 25 µM Glu for 6 or 18 h in the presence or absence of 3 µM (+)-PTZ (pre-treatment 1 h, plus co-treatment) and immunoblotting was performed. Immunoblotting experiments, using an antibody generated against σR1 [21], detected a band of the appropriate molecular weight (Mr ~26–27 kDa) in control cells and those treated with 25 µM Glu in the presence or absence of (+)-PTZ and in cells treated with (+)-PTZ alone (Fig. 5C and 5D). Blots were stripped and re-probed with β-actin (Mr ~45 kDa) as an internal control. Quantification of the band intensities revealed that there were no significant differences in σR1 protein levels between Glu-treated cells and controls or those treated with (+)-PTZ (data not shown).
Fig. 5. σR1 mRNA and protein levels in 1°GC following treatment with Glu and (+)-PTZ.
1°GCs were incubated for 6 h (A & C) or 18 h (B & D) in the absence or presence of 25 µM Glu and the absence or presence of 3 µM (+)-PTZ. A and B: total RNA was isolated and used for semiquantitative RT-PCR. Primer pairs specific for mouse σR1 mRNA (465 bp) were used. 18S RNA (315 bp) was analyzed in the same RNA samples as the internal control. RT-PCR products were run on a gel and stained with ethidium bromide. C and D: Proteins were extracted from cells and subjected to SDS-PAGE, followed by immunoblotting using an affinity purified antibody against σR1, Mr ~27 kDa or β-actin, Mr ~45 kDa (internal loading control). (M, DNA marker; Con, control; Glu, 25 µM glutamate-treated cells; P + G, (+)-PTZ 3 µM plus 25 µM glutamate; (+)-PTZ, 3 µM (+)-PTZ incubation alone).
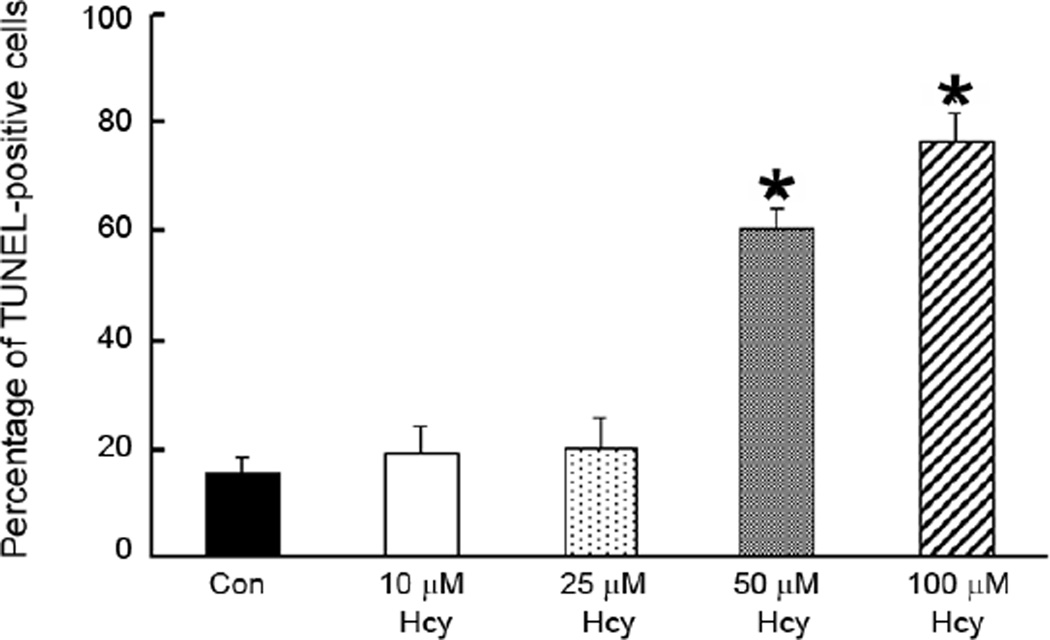
In addition to analyzing the effects of Glu on 1°GCs, we also examined the effects of increasing concentrations of homocysteine (Hcy) on 1°GC survival and investigated whether (+)-PTZ could alter these effects. Fig. 6 shows the dose response data for 1°GCs that were cultured in the Neurobasal supplemented-medium for 3 days and then incubated 6 h in medium containing increasing concentrations of Hcy (10, 25, 50 and 100 µM). While earlier studies with the RGC-5 cell line required millimolar concentrations of Hcy to induce cell death [26], the present experiments using the 1°GCs showed that exposure of cells to 10 or 25 µM Hcy led to a slight elevation (~20 %) in the number of TUNEL-positive cells compared with untreated controls. When the cells were exposed to 50 µM or 100 µM Hcy, 60% and 80% of the cells were TUNEL-positive, respectively. This marked sensitivity of the 1°GCs is in keeping with the evidence that micromolar quantities of Hcy can induce apoptotic ganglion cell death in vivo [27] and supports the relevance of the 1°GCs in studying Hcy-induced toxicity. Based on these data, subsequent experiments used the 50 µM Hcy to induce cell death.
Fig. 6. Dose-dependent increase in TUNEL-positive 1°GCs following exposure to homocysteine (Hcy).
The number of TUNEL-positive cells was determined using the ApopTag fluorescein method in 1°GCs exposed to Hcy (10, 25, 50 and 100 µM) for 6 h. Data are expressed as the mean and S.E. of the ratio of dead/dying cells to the total number of cells, n = 10. (*, significantly different from control, p <0.001).
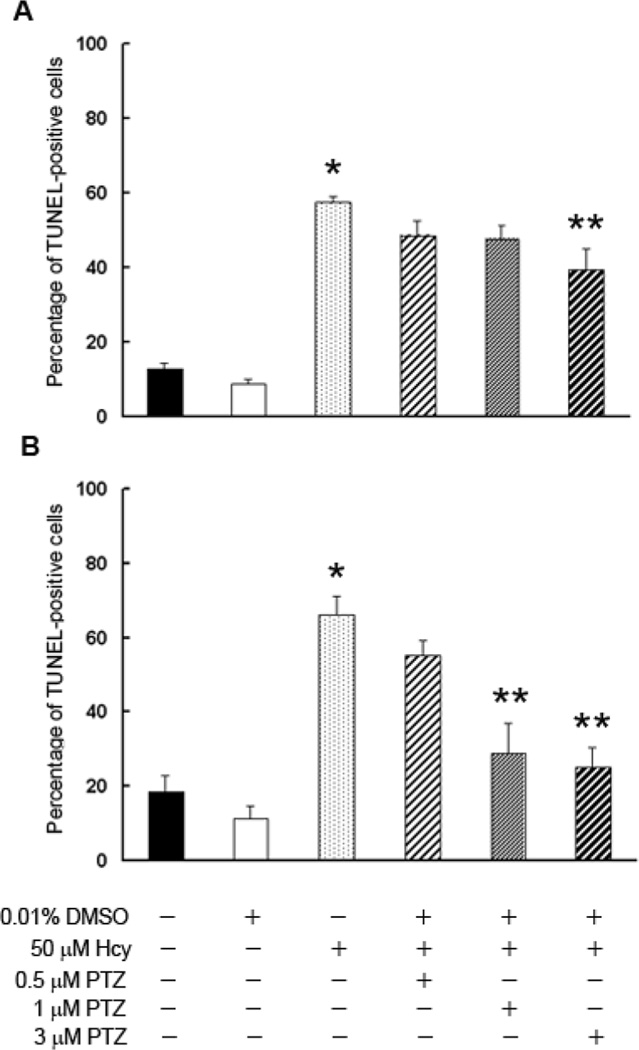
The efficacy of (+)-PTZ as a neuroprotectant in the Hcy-induced 1°GC death was tested (Fig. 7). When cells received 1 h pre-treatment with (+)-PTZ, followed by 6 h co-treatment with 50 µM Hcy and 0.5 or 1 µM (+)-PTZ, there was a slight decrease in the number of TUNEL-positive cells, but the difference did not reach statistical significance (Fig. 7A). However, pre-treatment/co-treatment of cells for 6 h with 3 µM (+)-PTZ led to a significant decrease in the number of dying cells (Fig. 7A). When cells were pre-treated 1 h with (+)-PTZ followed by 18 h co-treatment with 50 µM Hcy in the presence of (+)-PTZ, there was a dose-dependent decrease in the incidence of cell death (Fig. 7B). 1°GCs treated with 1 and 3 µM (+)-PTZ showed a highly significant decrease in the number of TUNEL-positive cells (28% and 25%, respectively compared to 66% cell death in the Hcy-treated cells). Thus (+)-PTZ treatment afforded marked protection against neuronal cell death induced by this excitotoxin as well as Glu.
Fig. 7. Assessment of the number of TUNEL-positive 1°GCs following 6 or 18 h incubation with homocysteine (Hcy) and (+)-PTZ.
1°GCs were pre-treated for 1 h with (+)-PTZ (0.5, 1 or 3 µM) followed by co-incubation for 6 h (A) or 18 h (B) with Hcy (50 µM) and (+)-PTZ (0.5, 1 or 3 µM). The number of TUNEL-positive cells was determined using the ApopTag fluorescein method. Data are expressed as the mean and S.E. of the ratio of dead/dying cells to the total number of cells, n = 10. (*, significantly different from control, p <0.001; **, significantly different from cells treated with 50 µM Hcy, p<0.001).
As with the studies analyzing effects of excess Glu on expression of σR1 (Fig. 5), we examined the expression of σR1 following treatment of cells with Hcy. RT-PCR showed no difference in the expression of σR1 mRNA levels regardless whether cells were exposed for 6 or 18 h to Hcy or whether they received (+)-PTZ treatment prior to Hcy exposure (data not shown). These data were confirmed by real-time RT-PCR. Similarly, there was no difference in σR1 protein levels following the same duration of Hcy exposure in the presence or absence of (+)-PTZ as examined by western blot. The data suggest that the neuroprotective effects of (+)-PTZ involve σR1 activation rather than altered σR1 expression.
An advantage of using 1°GCs is that the cells develop extensive processes that are reminiscent of neurons in vivo. This feature can be monitored and the consequence of exposure to excitotoxins evaluated. Using DIC microscopy, 1°GCs were examined over a period of 18 h following exposure to 25 µM Glu or 50 µM Hcy (in the absence or presence of (+)-PTZ) and images were captured. A panel of representative photomicrographs is provided in Fig. 8. Control cells, which received no excitotoxin treatment, had plump cell bodies typical of healthy neurons that measured ~7–8 µm in diameter. Intact processes radiated from many cell bodies. Typically there were 3–5 of these processes per cell body extending ~10–15 µm before they branched into more complex networks. The top row of images in Fig. 8 shows control cells viewed over the 18 h time period. When cells were treated with Glu, there was progressive loss of the processes. Minimal disruption was evident at 3 h post-treatment; however, by 6 h the cell bodies were shrunken, the processes were shortened, and the complex extensions from the processes were no longer present. By 18 h, cells treated with Glu were markedly altered in appearance compared to non-treated controls. A few cells retained short processes, but many had no processes at all. Cell bodies were often shriveled and had very condensed nuclei. Similarly, when cells were treated with Hcy there was clear disruption of fibers especially after 6 h treatment; the processes were stubby and appeared clipped. After 18 h incubation with Hcy, the fibers were either no longer present or had contracted significantly forming a small network around the cell body. Interestingly, cells pre-treated with (+)-PTZ for 1 h and then co-treated with either Glu or Hcy showed marked preservation of the neuronal processes. The cell bodies were similar to the non-treated control cells and the fibers emanated in complex arrays. These morphological studies supported the TUNEL assays regarding the effects of Glu or Hcy on cell viability. They also demonstrate the profound neuroprotective effects of (+)-PTZ on the cells.
Fig. 8. Differential interference contrast microscopic analysis of cells exposed to Glu or homocysteine (Hcy) and (+)-PTZ.
1°GCs were isolated and cultured as described. Control cells (Con) were not exposed to excitotoxins; the row of photographs labeled “Glu” shows cells that were incubated with 25 µM Glu over a period of 18 h; photomicrographs were acquired at 0, 3, 6, 18 h post-incubation. The row of photographs labeled “Hcy” shows cells that were incubated with 50 µM Hcy over an 18 h period and photographed at 0, 3, 6 and 18 h post-incubation. In additional experiments, cells were pretreated with (+)-PTZ for 1 h and then co-incubated with (+)-PTZ and the excitotoxin for 18 h. Cell bodies and processes of cells co-treated with either Glu or Hcy and (+)-PTZ were similar in appearance to control cells. In the top left panel (control, 0 time) the arrow points to a process extending from the cell body. (Magnification bar = 15 µm). All photomicrographs are the same magnification.
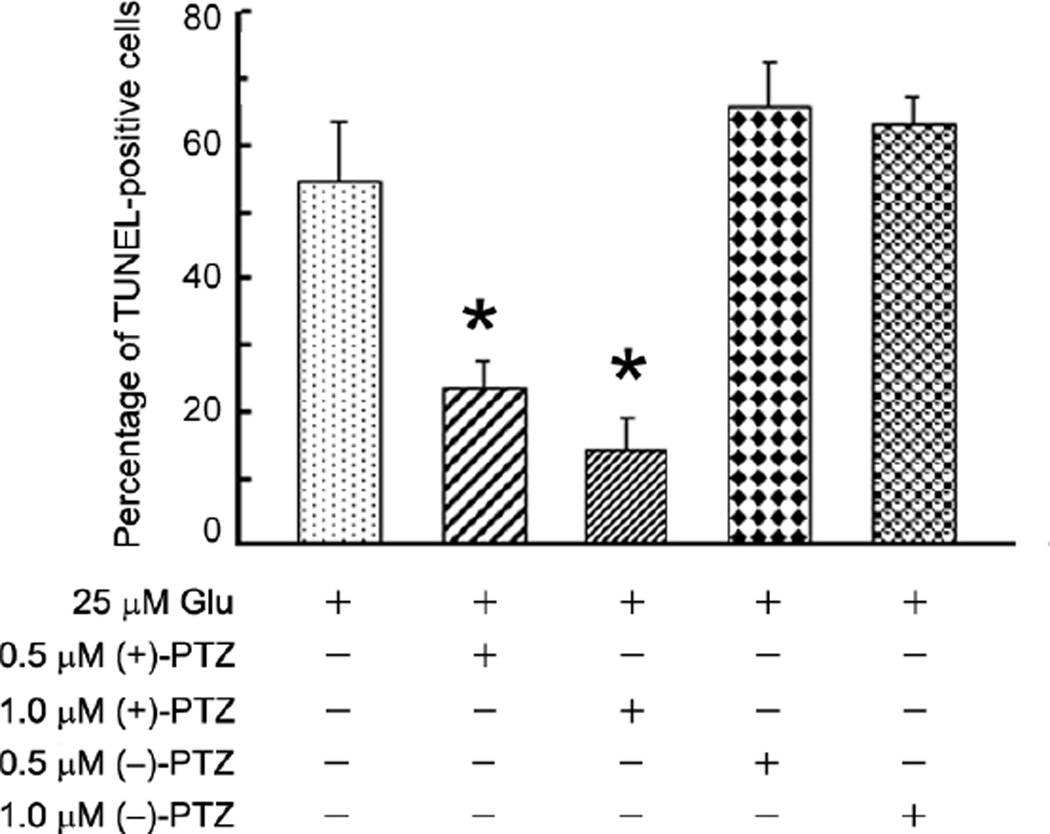
(+)-PTZ was chosen for use in this study because of its potency and its high selectivity as a ligand for σR1 [25,44]. Compared to (+)-PTZ, (−)-PTZ has several orders of magnitude less affinity towards σR1. To provide further support that the observed protective effects of (+)-PTZ in 1°GCs against excitotoxicity are mediated via σR1, we compared the efficacy of neuroprotection of (+)-PTZ to (−)-PTZ. 1°GCs were pre-treated with either (+)-PTZ or (−)-PTZ for 1 hour followed by co-incubation with these compounds in the presence of 25 µM Glu. After 18 h, the cells were subjected to the TUNEL assay and the number of TUNEL positive cells determined. As expected, treatment of cells with (+)-PTZ decreased the incidence of TUNEL-positive cells significantly; treatment of cells with (−)-PTZ had no effect on the incidence of apoptosis induced by Glu (Fig. 9). The data demonstrate the selective role of σR1 activation in the observed protective effects.
Fig. 9. Assessment of the number of TUNEL-positive 1°GCs pretreated with either (+)-PTZ or (−)-PTZ followed by 18 h co- incubation with Glu.
1°GCs were incubated 1 h with (+)-PTZ or (−)-PTZ (0.5, 1.0 µM) followed by co-incubation with PTZ and 25 µM Glu for 18 h. TUNEL-positive cells were determined using the ApopTag kit. The number of TUNEL-positive cells was determined per 100 cells counted. Data are expressed as the mean and S.E. of the ratio of dead/dying cells to the total number of cells, n = 10 (*, significantly different from treatment with 25 µM Glu alone, p<0.001).
Discussion
The purpose of this study was to determine whether ligands for σR1 afford neuroprotection in an excitotoxic model of retinal neuronal death. Earlier studies from our lab suggested that the σR1 ligand (+)-PTZ could prevent cell death induced by Glu and Hcy in the RGC-5 (ganglion) cell line. The concentration of the excitotoxins required to induce death in this cell line was quite high (millimolar range). Though it was considered a first step in assessing neuroprotection by the σR1 ligand, it was not likely to be physiologically relevant since considerably lower concentrations of Glu and Hcy induced ganglion cell apoptosis in vivo [27]. Using methods adapted from rats, we optimized the isolation and maintenance of ganglion cells from neonatal mice [28] and used these cells for the present studies. The cells are notable for their expression of neuronal and ganglion cell-specific markers and their extensive processes characteristic of ganglion cells.
Using 1°GCs, we first established that σR1 was present in these cells as it is in the intact mouse retina. Our immunocytochemical and immunoblotting studies showed robust expression of σR1 in these cells. We next established that these cells are exquisitely sensitive to the toxic effects of Glu and Hcy. Approximately 50% of the cells died when exposed to micromolar quantities of Glu (25 µM) or Hcy (50 µM). It is worth noting that the active form of Hcy is thought to be the L-isomer, however Hcy can only be purchased commercially as D,L-homocysteine thiolactone hydrochloride. It is likely that the 50 µM D,L-Hcy used in this study reflects ~25 µM of the active (L-isomer form) of the Hcy, underscoring how sensitive the primary ganglion cells are to this excitotoxin. In addition to quantifying the incidence of apoptosis, we were able to visualize the effects of these excitotoxins on the cell morphology over the course of the experiment and observed that the cell bodies shrunk and neuronal processes retracted markedly as a result of exposure to these excitotoxins.
The σR1 ligand (+)-PTZ showed marked neuroprotective effects, particularly when the cells were pre-incubated for one hour prior to exposure to the excitotoxins. Within 6 h, there was improvement in cell viability and over the 18 h exposure to (+)-PTZ, the effects were considerable. Interestingly, microscopic examination of the cells revealed marked preservation of the plump cell body and extensive neuronal processes emanating from the cells that had been treated with (+)-PTZ. It is noteworthy that the pre-treatment followed by co-treatment yielded a better result than the co-treatment alone.
It was of interest to determine whether the neuroprotective effects of (+)-PTZ were mediated by an alteration of σR1 gene or protein expression. The RT-PCR analysis and immunoblotting data suggest that they are not. This was true regardless whether Glu or Hcy was used to induce the cell death. It is logical to assume then that the neuroprotective effects are related to activation of σR1 through (+)-PTZ binding. The concentration of (+)-PTZ (500 nM) at which it serves as a neuroprotectant in the current study correlates well with the known affinity of (+)-PTZ for the σR1 (Kd ~25 nM) [22,43]. Furthermore, the neuroprotective effects of (+)-PTZ were shown to be mediated via σR1 as experiments using (−)-PTZ, the levo-isomer of pentazocine showed no neuroprotection. Similar findings confirming the specificity of (+)-PTZ for σR1 have been reported in brain [15].
We showed in earlier studies using primary Müller cells cultured from mouse retina that σR1 binding activity increased when cells were exposed to oxidative stress [22]. Such studies were feasible using the primary Müller cells because, upon harvesting, the cells proliferate. This is not the case with the 1°GCs. In keeping with their phenotype as a neuronal cell, they do not proliferate. Therefore, it is difficult, if not impossible to obtain sufficient 1°GCs to monitor (+)-PTZ binding unless extraordinary numbers of mice are used. This technical limitation is a hindrance also in studying the signaling events that follow (+)-PTZ-induced σR1 activation. There have been studies from other laboratories using different model systems, which showed activation of protein kinase C following (+)-PTZ-induced σR1 activation [44]. Whether this signaling pathway plays a role in (+)-PTZ-mediated protection of 1°GCs observed in the present study, remains to be seen. There is also evidence for protein-protein interaction between σR1 and specific ion channels in the plasma membrane [45]. Binding of ligands to σR1 induces receptor translocation from intracellular sites to the plasma membrane where protein-protein interaction leads to alterations in the activity of specific ion channels. This would influence intracellular calcium signaling. Thus, there are potentially diverse mechanisms which could mediate the protection of 1°GCs from excitotoxicity following (+)-PTZ-induced σR1 activation. We plan to focus in future studies on the signaling events related to σR1 activation in these cells.
The results of this study bring us closer to a physiologically relevant model for exploring the neuroprotective effects of σR1 ligands for retinopathy, particularly ganglion cell death. It is imperative to determine whether the results obtained in this in vitro system are relevant in vivo. Hence, the time is ripe to test σR1 ligands in an animal model in which these cells die, such as is observed in diabetic retinopathy or glaucoma.
Acknowledgements
We thank Barbara Mysona and Angeline Martin-Studdard for helpful discussions regarding these experiments.
Literature Cited
- 1.Hayashi T, Su TP. Sigma-1 receptor ligands: potential in the treatment of neuropsychiatric disorders. CNS Drugs. 2004;18:269–284. doi: 10.2165/00023210-200418050-00001. [DOI] [PubMed] [Google Scholar]
- 2.Quirion R, Bowen WD, Itzhak JL, et al. A proposal for the classification of sigma binding sites. Trends Pharmacol. Sci. 1992;13:85–86. doi: 10.1016/0165-6147(92)90030-a. [DOI] [PubMed] [Google Scholar]
- 3.Hanner M, Moebius FF, Flandorfer A, et al. Purification, molecular cloning, and expression of the mammalian sigma 1-binding site. Proc. Natl. Acad. Sci. USA. 1996;93:8072–8077. doi: 10.1073/pnas.93.15.8072. [DOI] [PMC free article] [PubMed] [Google Scholar]
- 4.Kekuda R, Prasad PD, Fei YJ, et al. Cloning and functional expression of the human type 1 sigma receptor (hSigmaR1) Biochem. Biophys. Res. Commun. 1996;229:553–558. doi: 10.1006/bbrc.1996.1842. [DOI] [PubMed] [Google Scholar]
- 5.Prasad PD, Li HW, Fei YJ, et al. Exon-intron structure, analysis of promoter region, and chromosomal localization of the human type 1 sigma receptor gene. J. Neurochem. 1998;70:443–451. doi: 10.1046/j.1471-4159.1998.70020443.x. [DOI] [PubMed] [Google Scholar]
- 6.Seth P, Leibach FH, Ganapathy V. Cloning and structural analysis of the cDNA and the gene encoding the murine Type 1 sigma receptor. Biochem. Biophys. Res. Comm. 1997;241:535–540. doi: 10.1006/bbrc.1997.7840. [DOI] [PubMed] [Google Scholar]
- 7.Seth P, Fei Y-J, Li HW, et al. Cloning and functional characterization σ from rat brain. J. Neurochem. 1998;70:922–931. doi: 10.1046/j.1471-4159.1998.70030922.x. [DOI] [PubMed] [Google Scholar]
- 8.Yamamoto H, Yamamoto T, Sagi N, et al. Sigma ligands indirectly modulate the NMDA receptor-ion channel complex on intact neuronal cells via sigma 1 site. J. Neurosci. 1995;15:731–736. doi: 10.1523/JNEUROSCI.15-01-00731.1995. [DOI] [PMC free article] [PubMed] [Google Scholar]
- 9.Bhardwaj A, Sawada M, London ED, et al. Potent σ1-receptor ligand 4-phenyl-1-(4-phenylbutyl)-piperidine modulates basal and N-methyl-D-aspartate–evoked nitric oxide production in vivo. Stroke. 1998;29:2404–2411. [PubMed] [Google Scholar]
- 10.Klette KL, DeCoster MA, Moreton JE, et al. Role of calcium in sigma-mediated neuroprotection in rat primary cortical cultures. Brain Res. 1995;704:31–41. doi: 10.1016/0006-8993(95)01103-x. [DOI] [PubMed] [Google Scholar]
- 11.Katnik C, Guerrero WR, Pennypacker KR, et al. Sigma-1 receptor activation prevents intracellular calcium dysregulation in cortical neurons during in vitro ischemia. J Pharmacol Exp Ther. 2006;319:1355–1365. doi: 10.1124/jpet.106.107557. [DOI] [PubMed] [Google Scholar]
- 12.Lobner D, Lipton P. σ-Ligands and non-competitive NMDA antagonists inhibit glutamate release during cerebral ischemia. Neurosci. Lett. 1990;117:169–174. doi: 10.1016/0304-3940(90)90139-z. [DOI] [PubMed] [Google Scholar]
- 13.Lockhart BP, Soulard P, Benicourt C, et al. Distinct neuroprotective profiles for σ-ligands against N-methyl-D-aspartate (NMDA), and hypoxia-mediated neurotoxicity in neuronal culture toxicity studies. Brain Res. 1995;675:110–120. doi: 10.1016/0006-8993(95)00049-v. [DOI] [PubMed] [Google Scholar]
- 14.Bhardwaj A, Sawada M, London ED, et al. Potent σ1-receptor ligand 4-phenyl-1-(4-phenylbutyl)-piperidine modulates basal and N-methyl-D-aspartate–evoked nitric oxide production in vivo. Stroke. 1998;29:2404–2411. [PubMed] [Google Scholar]
- 15.Vagnerova K, Hurn PD, Bhardwaj A, et al. Sigma 1 receptor agonists act as neuroprotective drugs through inhibition of inducible nitric oxide synthase. Anesth Analg. 2006;103:430–434. doi: 10.1213/01.ane.0000226133.85114.91. [DOI] [PubMed] [Google Scholar]
- 16.Schoenwald RD, Barfknecht CR, Xia E, et al. The presence of σ receptor in the lacrimal gland. J. Ocular Pharmacol. 1993;9:125–139. doi: 10.1089/jop.1993.9.125. [DOI] [PubMed] [Google Scholar]
- 17.Bucolo C, Campana C, Di Toro R, et al. Sigma 1 recognition sites in rabbit iris-ciliary body: topical sigma 1-site ligands lower intraocular pressure. J. Pharmacol. Exp. Ther. 1999;289:1362–1369. [PubMed] [Google Scholar]
- 18.Ola MS, Moore PM, El-Sherbeny A, et al. Expression pattern of sigma receptor 1 mRNA and protein in mammalian retina. Mol. Brain Res. 2001;95:86–95. doi: 10.1016/s0169-328x(01)00249-2. [DOI] [PMC free article] [PubMed] [Google Scholar]
- 19.Wang L, Duncan G. Silencing of sigma-1 receptor induces cell death in human lens cells. Exp Cell Res. 2006;312:1439–1446. doi: 10.1016/j.yexcr.2006.01.004. [DOI] [PubMed] [Google Scholar]
- 20.Senda T, Matsuno K, Mita S. The presence of sigma receptor subtypes in bovine retinal membranes. Exp Eye Res. 1997;64:857–860. doi: 10.1006/exer.1996.0272. [DOI] [PubMed] [Google Scholar]
- 21.Ola MS, Martin PM, Maddox D, et al. Analysis of Sigma Receptor (σR1) expression in retinal ganglion cells cultured under hyperglycemic conditions and in diabetic mice. Brain Res Mol Brain Res. 2002;107:97–107. doi: 10.1016/s0169-328x(02)00444-8. [DOI] [PMC free article] [PubMed] [Google Scholar]
- 22.Jiang G, Mysona B, Dun Y, et al. Expression, subcellular localization and regulation of sigma receptor in retinal Müller cells. Invest. Ophthamol. Vis. Sci. 2006;47:5576–5558. doi: 10.1167/iovs.06-0608. [DOI] [PMC free article] [PubMed] [Google Scholar]
- 23.Gardner TW, Antonetti DA, Barber AJ, et al. Diabetic retinopathy: more than meets the eye. Surv Ophthalmol. 2002;47(Suppl 2):S253–S262. doi: 10.1016/s0039-6257(02)00387-9. [DOI] [PubMed] [Google Scholar]
- 24.Levin LA, Gordon LK. Retinal ganglion cell disorders: types and treatments. Prog Retin Eye Res. 2002;21:465–484. doi: 10.1016/s1350-9462(02)00012-5. [DOI] [PubMed] [Google Scholar]
- 25.de Costa BR, Bowen WD, Hellewell SB, Walker JM, Thurkauf A, Jacobson AE, Rice KC. Synthesis and evaluation of optically pure [3H]-(+)-pentazocine, a highly potent and selective radioligand for sigma receptors. FEBS Lett. 1989;251:53–58. doi: 10.1016/0014-5793(89)81427-9. [DOI] [PubMed] [Google Scholar]
- 26.Martin PM, Ola MS, Agarwal N, et al. The Sigma Receptor (σR) Ligand (+)-pentazocine prevents retinal ganglion cell death induced in vitro by homocysteine and glutamate. Brain Research Mol Brain Res. 2004;123:66–75. doi: 10.1016/j.molbrainres.2003.12.019. [DOI] [PMC free article] [PubMed] [Google Scholar]
- 27.Moore P, El-Sherbeny A, Roon P, et al. Apoptotic retinal ganglion cell death is induced in vivo by the excitatory amino acid homocysteine. Exp. Eye Res. 2001;73:45–57. doi: 10.1006/exer.2001.1009. [DOI] [PubMed] [Google Scholar]
- 28.Dun Y, Mysona B, Van Ells TK, et al. Expression of the glutamate-cysteine (xc-) exchanger in cultured retinal ganglion cells and regulation by nitric oxide and oxidative stress. Cell Tiss. Res. 2006;324:189–202. doi: 10.1007/s00441-005-0116-x. [DOI] [PMC free article] [PubMed] [Google Scholar]
- 29.Selhub J, Bagley LC, Miller J, et al. B vitamins, homocysteine, and neurocognitive function in the elderly. Am. J. Clin. Nutr. 2000;71:614S–620S. doi: 10.1093/ajcn/71.2.614s. [DOI] [PubMed] [Google Scholar]
- 30.Austin RC, Lentz SR, Werstuck GH. Role of hyperhomocysteinemia in endothelial dysfunction and atherothrombotic disease. Cell Death Differ. 2004;(Suppl. 1):S56–S64. doi: 10.1038/sj.cdd.4401451. [DOI] [PubMed] [Google Scholar]
- 31.Mattson MP, Shea TB. Folate and homocysteine metabolism in neural plasticity and neurodegenerative disorders. Trends Neurosci. 2003;26:137–146. doi: 10.1016/S0166-2236(03)00032-8. [DOI] [PubMed] [Google Scholar]
- 32.Heuberger RA, Fisher AI, Jacques PF, et al. Relation of blood homocysteine and its nutritional determinants to age-related maculopathy in the third National Health and Nutrition Examination Survey. Am. J. Clin. Nutr. 2002;76:897–902. doi: 10.1093/ajcn/76.4.897. [DOI] [PubMed] [Google Scholar]
- 33.Axer-Siegel R, Bourla D, Ehrlich R, et al. Association of neovascular age-related macular degeneration and hyperhomocysteinemia. Am. J. Ophthalmol. 2004;137:84–89. doi: 10.1016/s0002-9394(03)00864-x. [DOI] [PubMed] [Google Scholar]
- 34.Weger M, Stanger O, Deutschmann H, et al. Hyperhomocyst(e)inemia, but not methylenetetrahydrofolate reductase C677T mutation, as a risk factor in branch retinal vein occlusion. Ophthalmol. 2002;109:1105–1109. doi: 10.1016/s0161-6420(02)01044-8. [DOI] [PubMed] [Google Scholar]
- 35.Bleich S, Junemann A, von Ahsen N, et al. Homocysteine and risk of open-angle glaucoma. J. Neural. Transm. 2002;109:1499–1504. doi: 10.1007/s007020200097. [DOI] [PubMed] [Google Scholar]
- 36.Bleich S, Roedl J, Von Ahsen N, et al. Elevated homocysteine levels in aqueous humor of patients with pseudoexfoliation glaucoma. Am. J. Ophthalmol. 2004;138:162–164. doi: 10.1016/j.ajo.2004.02.027. [DOI] [PubMed] [Google Scholar]
- 37.Yang G, Lu J, Pan C. The impact of plasma homocysteine level on development of retinopathy in type 2 diabetes mellitus. Zhonghua Ne.i Ke. Za. Zhi. 2002;41:34–38. [PubMed] [Google Scholar]
- 38.Cahill MT, Stinnett SS, Fekrat S. Meta-analysis of plasma homocysteine, serum folate, serum vitamin B(12), and thermolabile MTHFR genotype as risk factors for retinal vascular occlusive disease. Am. J. Ophthalmol. 2003;136:1136–1150. doi: 10.1016/s0002-9394(03)00571-3. [DOI] [PubMed] [Google Scholar]
- 39.Seddon JM, Gensler G, Klein ML, et al. Evaluation of plasma homocysteine and risk of age-related macular degeneration. Am. J. Ophthalmol. 2006;141:201–203. doi: 10.1016/j.ajo.2005.07.059. [DOI] [PubMed] [Google Scholar]
- 40.Wang NC, Lai CC, Chen TL, et al. Branch retinal artery occlusion in a young man with hyperhomocysteinemia. Retina. 2005;25:940–942. doi: 10.1097/00006982-200510000-00020. [DOI] [PubMed] [Google Scholar]
- 41.Poloschek CM, Fowler B, Unsold R, et al. Disturbed visual system function in methionine synthase deficiency. Graefe’s Arch. Ophthalmol. 2005;243:497–500. doi: 10.1007/s00417-004-1044-2. [DOI] [PubMed] [Google Scholar]
- 42.Trotti D, Rossi D, Gjesdal O, et al. Peroxynitrite inhibits glutamate transporter subtypes. J. Biol. Chem. 1996;271:5976–5979. doi: 10.1074/jbc.271.11.5976. [DOI] [PubMed] [Google Scholar]
- 43.Ramachandran S, Lu H, Prabhu U, Ruoho AE. Purification and characterization of the guinea pig sigma-1 receptor functionally expressed in Escherichia coli. Protein Expr Purif. 2007;51:283–392. doi: 10.1016/j.pep.2006.07.019. [DOI] [PMC free article] [PubMed] [Google Scholar]
- 44.Nuwayhid SJ, Werling LL. Sigma-1 receptor agonist-mediated regulation of N-methyl-D-aspartate–stimulated [3H] dopamine release is dependent upon protein kinase C. J. Pharmacol. Exp Ther. 2003;304:364–369. doi: 10.1124/jpet.102.043398. [DOI] [PubMed] [Google Scholar]
- 45.Hayashi T, Su TP. Intracellular dynamics of sigma-1 receptors (sigma(1) binding sites) in NG108-15 cells. J. Pharmacol. Exp Ther. 2003;306:726–733. doi: 10.1124/jpet.103.051292. [DOI] [PubMed] [Google Scholar]


