

Abstract
Independently, metformin (MET) and the prebiotic, oligofructose (OFS), have been shown to increase glucagon-like peptide (GLP-1) secretion. Our objective was to determine whether using OFS as an adjunct with MET augments GLP-1 secretion in obese rats. Male, diet-induced obese Sprague Dawley rats were randomized to: 1) high-fat/-sucrose diet [HFHS; control (C); 20% fat, 50% sucrose wt:wt]; 2) HFHS+10% OFS (OFS); 3) HFHS + MET [300 mg/kg/d (MET)]; 4) HFHS+10% OFS+MET (OFS +MET). Body composition, glycemia, satiety hormones, and mechanisms related to dipeptidyl peptidase 4 (DPP4) activity in plasma, hepatic AMP-activated protein kinase (AMPK; Western blots), and gut microbiota (qPCR) were examined. Direct effects of MET and SCFA were examined in human enteroendocrine cells. The interaction between OFS and MET affected fat mass, hepatic TG, secretion of glucose-dependent insulinotropic polypeptide (GIP) and leptin, and AMPKα2 mRNA and phosphorylated acetyl CoA carboxylase (pACC) levels (P < 0.05). Combined, OFS and MET reduced GIP secretion to a greater extent than either treatment alone (P < 0.05). The hepatic pACC level was increased by OFS+MET by at least 50% above all other treatments, which did not differ from each other (P < 0.05). OFS decreased plasma DPP4 activity (P < 0.001). Cecal Bifidobacteria (P < 0.001) were markedly increased and C. leptum decreased (P < 0.001) with OFS consumption. In human enteroendocrine cells, the interaction between MET and SCFA affected GLP-1 secretion (P < 0.04) but was not associated with higher GLP-1 than the highest individual doses. In conclusion, the combined actions of OFS and MET were associated with important interaction effects that have the potential to improve metabolic outcomes associated with obesity.
Introduction
Obesity exacerbates metabolic abnormalities, including impaired fasting glucose, postprandial glucose intolerance, and insulin resistance (1). Although the causes of obesity are multi-factorial, defects in the secretion of the anorexigenic and insulinotropic hormone, GLP-15, could contribute. Basal and/or nutrient-stimulated GLP-1 secretion is reduced in obesity (2–4), whereas habitual overconsumption of energy blunts GLP-1 mediated satiety and augments the energy required to generate feelings of fullness (5).
Prebiotic fibers, including OFS, are unique soluble and fermentable nondigestible carbohydrates with low energy value (1.5 kcal/g) (6) and putative hypoglycemic effects (7,8). Prebiotics enhance the secretion of GLP-1, in part via upregulation of proglucagon gene expression in the distal intestine (9,10). Furthermore, fermentation of prebiotics leads to production of SCFA, which in the case of resistant starch has been shown to occur over a 24-h period in rats and promotes a daylong elevation in the anorexigenic peptides, GLP-1 and PYY (11). In overweight and obese adults, OFS supplementation has been shown to improve glycemic control in conjunction with reduced body fat and energy intake and enhanced secretion of PYY (8). OFS promotes the growth of Bifidobacterium spp. in the gut and has been shown to reduce metabolic endotoxemia associated with the consumption of a high-fat diet (12).
MET is a first-line antidiabetic agent used to improve glycemic control and limit weight gain in individuals with type 2 diabetes (13). MET primarily acts to improve peripheral glucose clearance through the phosphorylation of AMPK at Thr-172, decreasing gluconeogenesis and increasing peripheral glucose uptake in hepatic and skeletal tissue, respectively (14). Once phosphorylated, AMPK inactivates ACC through phosphorylation, which decreases malonyl-CoA and ultimately reduces the synthesis and promotes the oxidation of fatty acids (15).
In addition to the well-established role of OFS in enhancing GLP-1 secretion, there is evidence that MET also stimulates its release (16,17) and could, therefore, serve as a promising adjunct to a dietary intervention that enhances endogenous GLP-1 secretion. Accordingly, our objective was to determine if the combined actions of MET and OFS alleviated metabolic perturbations resulting from consumption of a HFHS diet better than either treatment alone. Mechanisms related to the degradation of GLP-1 via DPP4, SCFA, and gut microbiota and phosphorylation of hepatic AMPK and its downstream target, ACC, were examined.
Methods
Rats and treatments
Ethical approval for the experimental protocol was submitted to and approved by the University of Calgary Health Sciences Animal Care Committee. All procedures conformed to the Guide for Care and Use of Laboratory Animals. Obesity was induced in 8-wk-old (n = 80) male Sprague-Dawley rats (Charles River) that consumed ad libitum a HFHS diet for 6 wk. The diet consisted of (g/100 g): casein (20.0), sucrose (49.9), soybean oil (10.0), lard (10.0), Alphacel (5.0), AIN-93M mineral mix (3.5), AIN-93 vitamin mix (1.0), DL-methionine (0.3), and choline bitartrate (0.25) (Dyets). At 14 wk of age, rats in the top 50th percentile of weight gain (n = 40) were randomized to 1 of 4 groups for 7 wk: 1) high-fat/high-sucrose (HFHS) control (C); 2) HFHS + 10% oligofructose (OFS); 3) HFHS + MET (300 mg/kg) (MET); and 4) HFHS + 10% OFS+MET (300 mg/kg) (OFS+MET). There were n = 10 rats/group. The OFS diet was prepared by mixing 90 g of HFHS diet with 10 g of OFS (Raftilose P95, Quadra Chemicals). The composition was (g/100 g): casein (18.0), sucrose (44.9), soybean oil (9.0), lard (9.0), Alphacel (4.5), AIN-93M mineral mix (3.2), AIN-93 vitamin mix (0.9), DL-methionine (0.3), choline bitartrate (0.23), and OFS (10.0).The energy density of the diets was 4.6 and 4.3 kcal/g for the HFHS and OFS groups, respectively. MET was administered orally in drinking water according to previous work (18) and adjusted twice weekly to meet MET dose requirements. Body weight was measured weekly and food intake daily. One day prior to the end of the study, rats were lightly anesthetized (isoflurane) and a DXA scan was performed (Hologic ODR 4500; Hologic).
Plasma collection
One week prior to the end of the study, rats were feed deprived overnight and a blood sample was taken via tail nick. An oral glucose gavage (2 g/kg) was administered and additional blood samples were taken from the tail at 15, 30, 60, and 90 min. Blood glucose was measured immediately using a One Touch Blood Glucose Meter (LifeScan Canada Ltd.) At the end of the study, a second OGTT was performed for satiety hormone analysis. Following overnight feed deprivation, rats were anesthetized and a baseline cardiac blood sample was taken. Rats were allowed to wake and were given an oral load of glucose (2 g/kg). Rats were reanesthetized for the remainder of the procedure and subsequent blood samples were collected into chilled vacutainers containing EDTA (1 g/L), diprotinin-A (0.034 g/L blood; MP Biomedicals), Sigma protease inhibitor (1 g/L blood; Sigma Aldrich), and Roche Pefabloc (1 g/L of blood) at 15, 30, 60, and 90 min postgavage. Plasma was stored at −80°C.
Tissue collection
Following the final blood draw, rats were killed by overanesthetization and aortic cut. The entire intestine was excised, flushed, and measured. Samples from the distal duodenum, jejunum, and ileum, proximal colon, liver, stomach, and cecum were snap-frozen and stored at −80°C.
Plasma analysis
Active GLP-1 was measured using a commercial ELISA kit (Millipore). A Rat Gut Hormone Multiplex kit (Millipore) was used to measure insulin, active amylin, active ghrelin, leptin, total PYY, and total GIP according to our previous work (19). HOMA-IR was calculated using baseline glucose and insulin [HOMA-IR = (IF × GF)/22.5]. Plasma NEFA were quantified using the colorimetric WAKO enzymatic HR series NEFA-HR (2) method per the manufacturer’s directions (Wako Chemicals USA).
Hepatic TG content
TG were measured using TG (GPO) reagent set (Point Scientific) according to our previous work (20).
DPP4 mRNA and enzyme assay in plasma
DPP4 mRNA levels were measured in ileum, colon, and liver with real-time PCR according to our previous work (21). DPP4 activity in plasma was measured according to Kirino et al. (22) using the cleavage rate of 7-amino-4-methyl-coumarin from the synthetic substrate H-glycyl-prolyl-7-amino-4-methyl-coumarin (Sigma).
Western blots for hepatic AMPK and ACC
Western-blot analysis was performed using a 1:1000 dilution of pAMPK (Thr-172), 1:1000 dilution of pACC (Ser-79), 1:1000 dilution of total AMPK (nonphosphorylated AMPKα), and a 1:1000 dilution of total ACC (Cell Signaling Technology) (23).
Microbial profiling using qPCR
Microbial profiling was performed according to our previous work (24). Total bacterial DNA was extracted from ~200 mg of cecal sample using FastDNA Spin Kit for Feces (MP Biomedicals) and quantified using a PicoGreen DNA quantification kit (Invitrogen). qPCR was performed with group-specific primers as previously published for total bacteria, Clostridium leptum (Group IV), Clostridium coccoides (group XIV), Lactobacillus spp., Bacteroides/Prevotella, Bifidobacterium spp., and Enterobacteriaceae (24). Cell numbers of bacteria were calculated from threshold cycle values and expressed as mean pg bacterial DNA/ng total genomic DNA.
In vitro enteroendocrine experiment
GLP-1 secretion from human enteroendocrine cells (NCI-H716) was assayed according to our previous work (25). Cells were incubated for 2 h at 37°C with increasing concentrations of MET, SCFA, or a combination of both dissolved in KRB buffer (control). The SCFA mixture was composed of sodium acetate, propionate, and butyrate at a molar ratio of 68:23:9. Supernatants and cells were collected with the addition of 0.05 g/L PMSF and diprotin-A (0.034 g/L) and measured using an active GLP-1 ELISA. GLP-1 release from the cells was normalized to the amount of GLP-1 in the cells prior to normalization to control.
Statistical analysis
All data are presented as mean ± SEM. Two-way ANOVA was used to determine the main effects of diet (control vs. OFS) and drug (vehicle vs. MET) and their interaction. In vitro work was assessed by 2-way ANOVA to determine the main effects of SCFA and MET and their interaction. Differences were considered significant when P < 0.05. When main effects of diet or drug were found and there was no significant interaction effect, data were pooled (by diet or drug) and post hoc pairwise analysis was performed. When a significant interaction effect was found, differences among all 4 groups were determined using Tukey’s test. Levene’s test was used to test the assumption of equal variance among the groups. Unequal variance was identified in the qPCR data of 4 bacterial groups. Analysis was therefore performed on log-transformed data. Weekly body weight and the time course of each hormone and glucose during the OGTT were analyzed by 2-way repeated-measures ANOVA followed by Tukey’s post hoc test. Pearson correlation tests were used to evaluate the association of the gut microbiota to body weight and body fat as well as blood biochemistry and energy intake. Data were analyzed with IBM SPSS v. 19 software (IBM).
Results
Independent and combined actions on food intake and body weight
Both OFS (P = 0.042) and MET (P < 0.001) reduced food intake and energy intake (P < 0.003) (Table 1). Body weight over the course of the 7 wk was affected by the interactions of diet × time (P = 0.002), drug × time (P < 0.001), and diet × drug × time (P = 0.019). Final body weight and total weight gain were lower in rats treated with MET (P = 0.001). By wk 2, body weight was lower in OFS+MET than in C rats and less than in the C and OFS groups at wk 3 (Fig. 1). For the duration of the study (wk 4–7), body weight was lower for rats in the OFS+MET and MET groups compared to those in the C and OFS groups (P = 0.04).
TABLE 1.
Energy intake and body composition of obese rats treated with OFS, MET, both, or neither for 7 wk1
| Treatment | C | OFS | MET | OFS+MET | Diet | Drug | Diet x drug |
|---|---|---|---|---|---|---|---|
| P-value | |||||||
| Food intake,2 g/d | 27 ± 1.4 | 24 ± 1.1 | 20 ± 1.4 | 18 ± 1.2 | 0.042 | 0.001 | 0.68 |
| Energy intake, kcal/d | 120 ± 6.5 | 100 ± 4.7 | 92 ± 6.4 | 76 ± 5.1 | 0.003 | 0.001 | 0.57 |
| Final body weight, g | 649 ± 13.7 | 624 ± 16.4 | 495 ± 22.4 | 499 ± 14.9 | 0.44 | 0.001 | 0.30 |
| Total weight change, g/7 wk | 144 ± 10.0 | 119 ± 10.1 | −12.9 ± 14.2 | −12.5 ± 16.7 | 0.36 | 0.001 | 0.34 |
| Fat mass, g | 199 ± 14.1c | 149 ± 12.2b | 84.4 ± 6.63a | 85.6 ± 9.85a | 0.035 | 0.001 | 0.028 |
| Lean mass, g | 434 ± 10.3 | 444 ± 8.01 | 390 ± 16.4 | 401 ± 13.2 | 0.40 | 0.001 | 0.97 |
| Percent fat, % | 30.4 ± 1.77 | 24.2 ± 1.72 | 18.2 ± 1.14 | 17.0 ± 1.76 | 0.028 | 0.001 | 0.13 |
| Bone mineral content, g/cm | 16.7 ± 0.24 | 16.3 ± 0.25 | 14.1 ± 0.53 | 14.8 ± 0.27 | 0.74 | 0.001 | 0.16 |
| BMD, g/cm3 | 0.176 ± 0.002 | 0.180 ± 0.002 | 0.171 ± 0.002 | 0.178 ± 0.002 | 0.012 | 0.12 | 0.12 |
| Liver TG, mmol/L | 18.3 ± 2.31 | 12.1 ± 0.48 | 13.6 ± 1.14 | 12.7 ± 0.69 | 0.12 | 0.29 | 0.06 |
| Total liver TG, mmol | 291 ± 28.2b | 197 ± 8.19a | 183 ± 12.9a | 191 ± 9.81a | 0.022 | 0.003 | 0.007 |
Values are mean ± SEM, n = 9–10. Labeled means in a row without a common letter differ, P < 0.05. BMD, bone mineral density; C, control; MET, metformin; OFS, oligofructose.
Refers to mean daily food intake over the 7-wk study.
FIGURE 1.
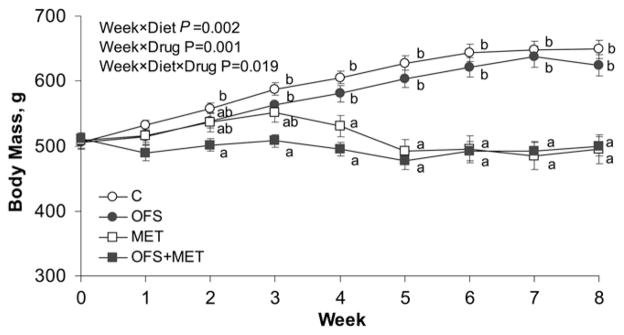
Body weight of obese rats treated with OFS, MET, both, or neither for 7 wk. Values are mean ± SEM, n = 10. Labeled means at a time without a common letter differ, P < 0.05. C, control; MET, metformin; OFS, oligofructose.
Both OFS and MET alter body composition. Both diet (P = 0.035) and drug (P < 0.001) and their interaction (P = 0.028) affected fat mass (Table 1), with rats in the OFS group having lower fat mass than C rats, and rats in the MET and OFS+MET groups having lower fat mass than those in the C and OFS groups. The percent body fat was reduced by OFS (P = 0.028) and MET (P < 0.001). MET was associated with reduced lean mass (P < 0.001) and decreased bone mineral content (P < 0.001), whereas rats fed OFS had greater BMD than those not consuming OFS (P = 0.012). The gut trophic effect of OFS was evident in a diet effect (P < 0.001) for empty cecum weight in which groups fed OFS had greater cecal weight (2.2 ± 0.1 g) than rats not consuming OFS (1.0 ± 0.1 g). Diet (P = 0.022), drug (P = 0.003), and their interaction (P = 0.007) resulted in a lower total liver TG content in the OFS, MET, and OFS+MET groups, which did not differ from one another, compared to the C group (Table 1).
Glycemic and insulinemic response
To assess glycemic control, we examined the response to oral glucose. There was an effect of time (P < 0.001) on blood glucose during the OGTT as well as an effect of both diet (P = 0.002) and drug (P = 0.013) on lowering blood glucose (Fig. 2A). Glucose AUC was also reduced by OFS (P = 0.002) and MET (P = 0.025) (Table 2). Confirming the known insulin-sensitizing effect of MET, insulin levels were lower for MET (P < 0.001) over the 90-min OGTT (Fig. 2B) and for insulin AUC (P < 0.001) (Table 2). Amylin, cosecreted with insulin, was also lower with MET during the OGTT (Fig. 2C) and AUC (both P < 0.001). Insulin resistance, estimated using HOMA-IR, was reduced by MET (80.4 ± 18.9) compared to no MET (261 ± 19.0) (P = 0.001). The interaction of OFS with MET (P = 0.016) affected the plasma NEFA following overnight feed deprivation, wherein the concentration in the OFS group (0.28 ± 0.03 mmol/L) was lower (P = 0.04) than in the C group (0.44 ± 0.04 mmol/L), but neither the OFS nor the C group differed from the MET (0.32 ± 0.04 mmol/L) and OFS+MET groups (0.35 ± 0.04 mmol/L).
FIGURE 2.
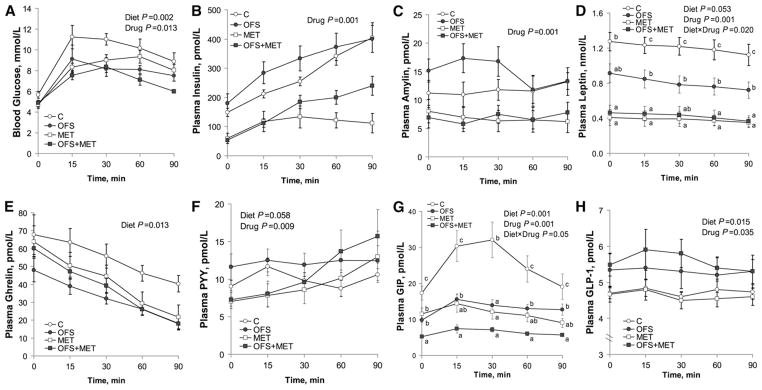
Blood glucose (A), insulin (B), amylin (C), leptin (D), ghrelin (E), PYY (F), GIP (G), and GLP-1 (H) concentrations of obese rats during an OGTT. Values are mean ± SEM, n = 10. Labeled means at a time without a common letter differ, P < 0.05. C, control; GIP, glucose-dependent insulinotropic polypeptide; GLP-1, glucagon-like peptide 1; MET, metformin; OFS, oligofructose; OGTT, oral glucose tolerance test; PYY, peptide tyrosine tyrosine.
TABLE 2.
Plasma AUC for glucose and satiety hormones of obese rats treated with OFS, MET, both, or neither for 7 wk1
| C | OFS | MET | OFS+MET | Diet | Drug | Diet × drug | |
|---|---|---|---|---|---|---|---|
| P value | |||||||
| Glucose, mmol/L × 90 min | 891 ± 49.2 | 707 ± 40.3 | 759 ± 35.5 | 637 ± 30.4 | 0.002 | 0.025 | 0.45 |
| Insulin, nmol/L × 90 min | 26.3 ± 1.94 | 30.3 ± 3.58 | 10.5 ± 2.29 | 15.8 ± 1.60 | 0.07 | 0.001 | 0.78 |
| Amylin, nmol/L × 90 min | 1.06 ± 0.17 | 1.30 ± 0.16 | 0.59 ± 0.14 | 0.62 ± 0.11 | 0.37 | 0.001 | 0.46 |
| Leptin, nmol/L × 90 min | 107 ± 9.22c | 70.5 ± 8.74b | 34.1 ± 6.34a | 37.4 ± 1.06a | 0.047 | 0.001 | 0.019 |
| Ghrelin, nmol/L × 90 min | 5.16 ± 0.47 | 2.97 ± 0.15 | 3.41 ± 0.59 | 3.06 ± 0.21 | 0.013 | 0.15 | 0.09 |
| PYY, nmol/L × 90 min | 0.79 ± 0.05 | 1.15 ± 0.13 | 0.70 ± 0.05 | 0.89 ± 0.07 | 0.006 | 0.06 | 0.34 |
| GIP, nmol/L × 90 min | 2.30 ± 0.29c | 1.20 ± 0.09b | 1.04 ± 0.16b | 0.57 ± 0.04a | 0.001 | 0.001 | 0.044 |
| GLP-1, nmol/L × 90 min | 0.41 ± 0.09 | 0.47 ± 0.04 | 0.41 ± 0.02 | 0.49 ± 0.04 | 0.012 | 0.024 | 0.16 |
Values are mean ± SEM, n = 8–10. Labeled means in a row without a common letter differ, P < 0.05. C, control; GIP, glucose-dependent insulinotropic polypeptide; GLP-1, glucagon-like peptide 1; MET, metformin; OFS, oligofructose; PYY, peptide tyrosine tyrosine.
Independent and interaction effects on satiety hormones
To determine if the combination therapy caused interaction effects on satiety hormone release, we measured their response to oral glucose. Both diet (P = 0.05) and drug (P < 0.001) and their interaction (P = 0.019) affected leptin during the OGTT and total AUC. At every time point during the OGTT, leptin was higher in C compared to all other treatments (P = 0.02) (Fig. 2D). Leptin tAUC was lower in OFS rats compared to C and lower in MET and OFS+MET rats compared to OFS and C rats (Table 2). Leptin AUC was correlated with fat mass (r = 0.89; P = 0.001). Ghrelin concentrations were reduced (P = 0.013) by OFS (Fig. 2E). OFS (P < 0.058) and MET (P < 0.009) affected PYY secretion over the course of the OGTT (Fig. 2F). Similarly, the PYY AUC was increased by OFS (P = 0.006) and showed a decreasing trend (P < 0.06) with MET (Table 2). GIP concentrations were affected by diet (P < 0.001), drug (P < 0.001), and their interaction (P < 0.05) (Fig. 2G). Rats treated with OFS +MET had a lower (P < 0.001) GIP AUC than all other groups. The MET and OFS groups also had a lower GIP AUC than C rats (Table 2). Both diet (P = 0.015) and drug (P = 0.035) affected plasma GLP-1, wherein OFS increased and MET decreased GLP-1 (Fig. 2H). Diet (P = 0.012) and drug (P = 0.024) also affected the GLP-1 AUC in a similar manner (Table 2).
Changes in DPP4 expression and plasma activity
To assess the ability of OFS and MET to modify the enzyme responsible for GLP-1 degradation, DPP4 expression and activity were measured. MET significantly reduced hepatic DPP4 mRNA levels (P = 0.048) compared to C (Fig. 3). The activity of DPP4, measured in the plasma, was lower in the group treated with OFS (P < 0.001).
FIGURE 3.
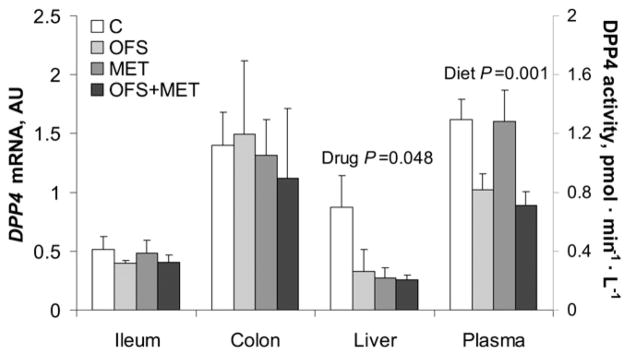
DPP4 mRNA levels and plasma activity of obese rats treated with OFS, MET, both, or neither for 7 wk. Values are mean ± SEM, n = 7–10. C, control; DPP4, dipeptidyl peptidase 4; MET, metformin; OFS, oligofructose.
Assessing the direct stimulation of GLP-1 secretion in vitro with MET and SCFA in enteroendocrine cells
In human NCI-H716 cells, GLP-1 release was affected by MET (P < 0.001), SCFA (P = 0.004), and their interaction (P = 0.044) (Fig. 4). GLP-1 secretion in the presence of 200 mmol/L SCFA + 300 mmol/L MET was higher than C, 100 mmol/L MET, 100 mmol/L SCFA, 100 mmol/L SCFA + 100 mmol/L MET, and 200 mmol/L SCFA + 100 mmol/L MET (all P < 0.004).
FIGURE 4.
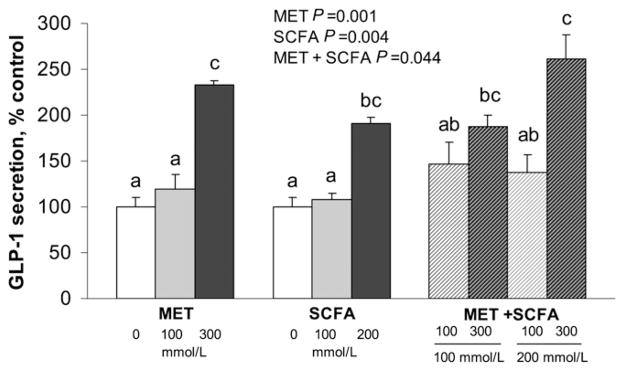
GLP-1 release by human enteroendocrine NCI-H716 cells in response to SCFA and MET. Values are mean ± SEM, n ≥ 3 independent experiments. Labeled means without a common letter differ, P < 0.05. C wells were treated with KRB buffer alone, without MET or SCFA. C, control; GLP-1, glucagon-like peptide 1; MET, metformin.
Enhanced effect of the combined therapy on hepatic AMPK and ACC
To examine the effect of OFS and MET on the master energy regulator, AMPK, protein and gene expression were examined in liver tissue. The pAMPK level was affected by diet (P = 0.05), drug (P = 0.002), and their interaction (P = 0.039) (Fig. 5A,C). The hepatic pAMPK level was lower in the C group compared to all other groups (P < 0.03). ACC, the downstream target of AMPK, which, once phosphorylated, increases oxidation and suppresses fatty acid synthesis, was affected by diet (P = 0.013), drug (P < 0.001), and their interaction (P = 0.047). The hepatic pACC level was higher in rats in the OFS+MET group compared to all other groups (P < 0.02) (Fig. 5B,D). There were no effects of OFS or MET on total AMPK or ACC level. The hepatic AMPKα1 mRNA level was upregulated with OFS (P < 0.008) (Fig. 5E), whereas AMPKα2 expression was affected by OFS (P = 0.006) and its interaction with MET (P = 0.014). Rats treated with OFS+MET had a higher hepatic AMPKα2 mRNA level than those in the C, OFS, and MET groups (P < 0.01) (Fig. 5E).
FIGURE 5.
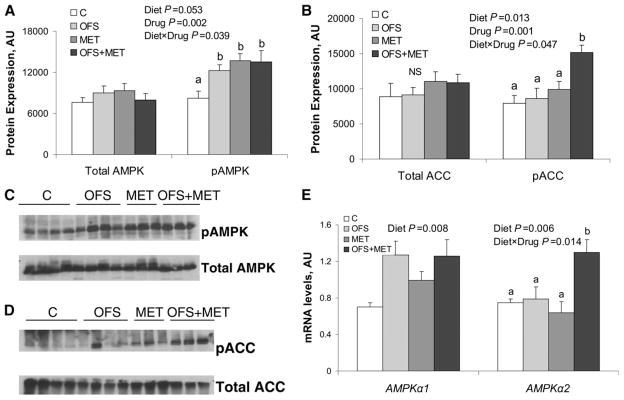
Hepatic phosphorylation of AMPK (A,C) and ACC (B,D), and AMPK mRNA levels (E) of obese rats treated with OFS, MET, both, or neither for 7 wk. Values are means ± SEM, n = 7–10. Labeled means at a time without a common letter differ, P < 0.05. A and B depict the densitometric quantification of the phosphospecific and nonphosphorylated form of hepatic AMPK and ACC. C and D show representative Western blots for pAMPK, total AMPK, pACC, and total ACC. E shows AMPKα1 and AMPKα2 mRNA levels in liver. ACC, acetyl CoA carboxylase; AMPK, AMP-activated protein kinase; OFS, oligofructose; pACC, phosphorylated acetyl CoA carboxylase; pAMPK, phosphorylated AMPK.
The composition of the gut microbiota changes with MET and OFS
Total bacteria were affected by diet (P = 0.009), wherein rats fed OFS had higher total bacteria than those not fed OFS (Table 3). There was a marked decrease in C. leptum with OFS (P < 0.001). Both diet (P < 0.001) and drug (P < 0.014) affected Bifidobacterium spp., wherein OFS increased and MET decreased Bifidobacterium spp. (P = 0.01). MET affected Enterobacteriacae (P < 0.008), with an increase seen in rats treated with MET.
TABLE 3.
| Population | C | OFS | MET | OFS+MET | Diet | Drug | Diet × drug |
|---|---|---|---|---|---|---|---|
| pg bacterial DNA/ng total genomic DNA | P value | ||||||
| Total bacteria | 1220 ± 194 | 1560 ± 180 | 1350 ± 137 | 1910 ± 139 | 0.009 | 0.15 | 0.48 |
| Bacteroides/Prevotella | 171 ± 61.6 | 239 ± 53.1 | 183 ± 19.5 | 254 ± 26.3 | 0.19 | 0.57 | 0.76 |
| Clostridium coccoides (group XIV) | 741 ± 74.0 | 807 ± 79.3 | 619 ± 85.3 | 855 ± 104 | 0.14 | 0.46 | 0.46 |
| Clostridium leptum (subgroup IV) | 77.2 ± 18.0 | 9.75 ± 1.93 | 105 ± 20.6 | 10.5 ± 3.48 | 0.001 | 0.57 | 0.63 |
| Lactobacillus spp. | 25.9 ± 8.69 | 25.3 ± 7.60 | 14.5 ± 1.72 | 22.7 ± 4.92 | 0.51 | 0.69 | 0.47 |
| Bifidobacterium spp. | 0.97 ± 0.42 | 97.8 ± 16.3 | 0.20 ± 0.05 | 61.2 ± 21.6 | 0.001 | 0.014 | 0.08 |
| Enterobacteriaceae | 1.12 ± 0.26 | 0.69 ± 0.17 | 57.6 ± 36.6 | 43.2 ± 13.8 | 0.68 | 0.008 | 0.69 |
Values are mean ± SEM, n = 8–10. C, control; MET, metformin; OFS, oligofructose.
Statistical analyses for C. leptum, Lactobacillus spp., Bifidobacterium spp., and Enterobacteriacae were performed on log-transformed data due to the identification of unequal variance.
Gut microbiota correlate with biomarkers of obesity
Bacteroides/Prevotella were negatively correlated with HOMA-IR (r = −0.35; P < 0.05) and liver TG (r = −0.37; P < 0.03). Bifidobacterium spp. were negatively associated with glucose and ghrelin AUC (r = −0.31, P < 0.01 and r = −0.37, P < 0.05 respectively). C. leptum was positively associated with glucose AUC (r = −0.34; P < 0.05) and plasma DPP4 activity (r = −0.43; P < 0.01). Total bacteria were negatively associated with fat mass, body weight, ghrelin AUC, HOMA-IR, and liver TG (all P < 0.05).
Discussion
Independently, OFS and MET have been shown to increase GLP-1 secretion and improve glycemic control (9,17). Our objective was to determine if combining the 2 therapies, one dietary and one pharmacological, could improve gut satiety hormone secretion and glucose homeostasis in obese rats. Individually, both OFS and MET decreased energy intake, percent body fat, and blood glucose. The combined therapy was associated with significant interaction effects for reductions in plasma GIP and increased hepatic pACC and AMPKα2 mRNA levels. Interestingly, OFS feeding mitigated the negative impact MET treatment had on BMD. From a physiological standpoint, the interaction effects of the combined therapy and overall improved biochemical status of the OFS+MET rats could represent a novel therapy with the potential to reduce metabolic abnormalities associated with obesity.
Reducing energy intake is crucial to the successful treatment of obesity. We observed a decrease in energy intake with both OFS and MET. Ghrelin was also reduced by OFS and may account in part for the observed reductions in energy intake. Although the higher PYY concentrations evident with OFS likely explain an additional contribution to reduced food intake with OFS, MET did not alter PYY secretion in a manner consistent with suppression of energy intake. Consuming OFS also increased the capacity for GLP-1 production via greater cecal mass and increased proglucagon mRNA levels (data not shown), but contrary to our hypothesis, there was no interaction effect of combining OFS with MET on GLP-1 secretion. The reduction in plasma DPP4 activity evident in the rats consuming OFS would support the increased GLP-1 levels observed in this group (26). In vitro measures of GLP-1 release in the NCI-H716 cells suggested that the human L cell responds directly to the presence of MET and that SCFA, the fermentation end products of OFS, may contribute to the enhanced GLP-1 secretion. In vitro, the combined actions of MET and SCFA, at their highest doses, increased GLP-1 release. However, at least in the context of this human cell line, the increase in GLP-1 observed when both SCFA and MET are present appears largely driven by MET.
The ability of MET to suppress energy intake is consistent with previous work in which MET restored the anorectic effects of leptin, especially after high-fat feeding in obese rats (18). MET potentiated leptin-induced proopiomelanocortin protein expression in the hypothalamus, which likely mediates some of the drug’s anorectic effect (18). In the current study, hyper-leptinemia was clearly demonstrated in the C rats and decreased after OFS supplementation. However, it is also clear that the MET treatment played an influential role in further reducing plasma leptin levels in both MET-treated groups compared to the OFS and C groups.
MET, whether administered alone or in combination with OFS, was an effective insulin sensitizer in this study, as noted by the marked lowering of HOMA-IR. He et al. (27) showed that both MET and insulin collectively circumvent insulin resistance via atypical protein kinase C, resulting in phosphorylation of CREB and inhibition of hepatic gluconeogenesis in obese, hyperglycemic, and insulin-resistant states. It is interesting that glycemic response to an oral glucose load in our rats was reduced by OFS and MET to a similar extent. The reduction in glucose following OFS consumption in this model is in keeping with previous work showing a distinct hypoglycemic effect of OFS (8,28).
In diabetes, a common pathology exacerbating glucose intolerance is increased endogenous production of glucose in the liver, whereas treatment with MET improves fasting blood glucose levels by decreasing gluconeogenesis (29). Activation of AMPK is the projected link for MET’s therapeutic effect in the liver, where it activates this metabolic switch to reduce excursions in blood glucose by suppressing de novo glucose production (14,15,29). In the present study, MET increased the hepatic pAMPK level while not affecting the total AMPK level. To our knowledge, the increase in hepatic pAMPK level associated with OFS intake has not previously been described and may represent a yet unidentified pathway through which prebiotics alter hepatic energy metabolism. ACC is the downstream target of AMPK and the committed step in fatty acid synthesis, catalyzing the carboxylation of acetyl-CoA to form malonyl CoA (30). Phosphorylation of ACC inhibits its activity and thereby decreases the available substrate for FAS and de novo fatty acid synthesis (30). Combining OFS with MET resulted in greater pACC abundance than either treatment alone, which is in direct agreement with the interaction effects of OFS and MET on the hepatic AMPKα2 mRNA level seen in our OFS+MET rats. Evidence from liver-specific AMPKα2(−/−) knockout mice show the AMPKα2 subunit is physiologically critical for blood glucose regulation. These mice have up to 50% greater glucose output alongside increased activity and expression of the gluconeogenic enzymes, phosphoenolpyruvate carboxykinase and G6Pase, promoting hyperglycemia in the feed-deprived and fed states (31).
High-fat diets increase GIP secretion in part via increased K cell transcription and proliferation and might represent the stimulus for insulin hypersecretion and insulin resistance (32). In human obesity, elevated basal and nutrient-stimulated GIP are associated with glucose intolerance and hyperinsulinemia (33). GIP receptor knockout(−/−) mice exhibit increased energy expenditure and are resistant to obesity and insulin resistance when fed a high-fat diet (34). GIP stimulates the release of resistin, an intermediate signaling adipokine that leads to increased activity of lipoprotein lipase and protein kinase B, with consequences on the activity of AMPK and its upstream regulator protein, LKB1 (35). Clinical studies show that elevated plasma GIP in obese and diabetic individuals following a saturated fat load is characteristic of nonalcoholic steatohepatitis and correlates with plasma adipokine imbalance and elevated resistin (36). In this study, the combined actions of OFS and MET support previous observations related to reduced fat intake and suggest that OFS+MET maximally attenuates GIP release. Suppressed GIP levels were in turn accompanied by a reduction in hepatic TG content and downregulation of a key transcription factor, SREBP1c, that controls genes involved in fatty acid synthesis wherein C was higher than all other groups that did not differ from each other [C (1.5 ± 0.3), OFS (0.8 ± 0.1), MET (0.7 ± 0.1), OFS+MET (0.6 ± 0.1) arbitrary units; P < 0.05].
In addition to disrupted gut endocrine function, differences in gut microbiota have also been shown in obesity and may contribute to the low-grade inflammatory state of obesity (37–39). Manipulation of gut microbiota in favor of a lean phenotype is a topic of intense interest. OFS consumption in our study was associated with the classical bifidogenic effect of prebiotics but also resulted in a significant reduction in C. leptum, which belongs to the Firmicutes phylum. Although both increases and decreases in total bacteria have been noted with high-fat diets, we found a significant increase in total bacteria with OFS. Importantly, total bacteria were negatively associated with fat mass, body weight, ghrelin AUC, HOMA-IR, and liver TG. There was an increase in Enterobacteriaceae with MET treatment. Although the importance of this increase is not clear, Santacruz et al. (40) showed that overweight women had higher Enterobacteriaceae than normal weight women and that increased numbers of Enterobacteriaceae correlated with excessive weight gain over pregnancy. As our understanding of the influence of gut microbiota on energy metabolism continues to grow, it will be critical to not only evaluate the effects of dietary factors known to alter gut microbiota but also the effects of pharmacological agents such as MET that are used to treat metabolic disease.
We acknowledge that the weight loss induced by the MET could confound the interpretation of some of the outcomes in the study. Although we did not anticipate the magnitude of weight reduction by MET, the inclusion of a weight-matched group would have provided valuable evidence for the effects of weight loss per se, independent of any dietary or pharmacological treatment. It is interesting, however, that weight loss induced by energy restriction alone has not been shown to alter GIP or DPP4 activity (41). Therefore, the marked reductions we saw in GIP with OFS, MET, and, most importantly, their combination may reflect weight loss-independent effects. We also acknowledge that measurement of satiety hormones under anesthesia could potentially influence the concentrations of these analytes in plasma, although Zardooz et al. (42) showed that isoflurane did not change plasma glucose and insulin in fed rats and decreased plasma insulin, but not glucose, in feed-deprived rats.
Taken together, the novel combination therapy of OFS and MET improved the metabolic status of diet-induced obese rats, a phenomenon associated with significantly augmented actions on suppressing GIP secretion and increasing hepatic pACC and AMPKα2 mRNA levels. Dietary fiber supplementation is a plausible therapeutic strategy for reducing energy intake, decreasing body fat stores, and enhancing endogenous GLP-1 and PYY secretion. In conjunction with the insulin-sensitizing agent MET, hepatic pACC level, a critical factor in energy metabolism, was enhanced and has the potential to contribute to physiologically meaningful reductions in glycemia and lipid accumulation. Given its possible clinical use, the greater reduction in GIP justifies the expanded investigation of other promising dietary and pharmacological adjunct therapies.
Acknowledgments
The authors thank Kristine Lee of the Faculty of Kinesiology, University of Calgary, for her extensive technical assistance with this work. K.A.P. and R.A.R. designed research and wrote the paper; K.A.P. and D.C.S. conducted the research and analyzed the data; and R.A.R. had primary responsibility for final content. All authors read and approved the final manuscript.
Footnotes
Supported by an unrestricted research grant from the Canadian Institutes of Health Research. K.A.P. was supported by the Frederick Banting and Charles Best Canada Graduate Scholarship, the Alberta Graduate Student Scholarship, the Queen Elizabeth II Graduate Master’s Scholarship, and the Faculty of Kinesiology Graduate Research Scholarship. D.C.S. is supported by fellowships from Alberta Innovates Health Solutions and the Alberta Children’s Hospital Research Institute for Maternal and Child Health CIHR Training Grant.
Author disclosures: K. A. Pyra and D. C. Saha, no conflicts of interest. R. A. Reimer holds a research grant from Beneo-Orafti Inc., manufacturer of Raftilose P95, for a project unrelated to the current work.
Abbreviations used: ACC, acetyl CoA carboxylase; AMPK, AMP-activated protein kinase; BMD, bone mineral density; DPP4, dipeptidyl peptidase 4; FAS, fatty acid synthase; GIP, glucose-dependent insulinotropic polypeptide; GLP-1, glucagon-like peptide 1; HFHS, high fat/high sucrose; MET, metformin; NEFA, nonesterified fatty acids; OFS, oligofructose; OGTT, oral glucose tolerance test; PYY, peptide tyrosine tyrosine.
Literature Cited
- 1.Walsh SJ, Dauser-Forrest D. Correlates of weight loss in persons with metabolic syndrome. Prev Med. 2009;49:396–401. doi: 10.1016/j.ypmed.2009.09.012. [DOI] [PubMed] [Google Scholar]
- 2.Ranganath LR, Beety JM, Morgan LM, Wright JW, Howland R, Marks V. Attenuated GLP-1 secretion in obesity: cause or consequence. Gut. 1996;38:916–9. doi: 10.1136/gut.38.6.916. [DOI] [PMC free article] [PubMed] [Google Scholar]
- 3.Verdich C, Toubro S, Buemann B, Madsen JL, Holst JJ, Astrup A. The role of postprandial releases of insulin and incretin hormones in meal-induced satiety: effect of obesity and weight reduction. Int J Obes Relat Metab Disord. 2001;25:1206–14. doi: 10.1038/sj.ijo.0801655. [DOI] [PubMed] [Google Scholar]
- 4.Vilsbøll T, Krarup T, Deacon CF, Madsbad S, Holst JJ. Reduced postprandial concentrations of intact biologically active glucagon-like peptide 1 in type 2 diabetic patients. Diabetes. 2001;50:609–13. doi: 10.2337/diabetes.50.3.609. [DOI] [PubMed] [Google Scholar]
- 5.Blundell JE, Levin F, King NA, Barkeling B, Gustafsson T, Hellstrom PM, Holst JJ, Naslund E. Overconsumption and obesity: peptides and susceptibility to weight gain. Regul Pept. 2008;149:32–8. doi: 10.1016/j.regpep.2007.10.009. [DOI] [PubMed] [Google Scholar]
- 6.Delzenne NM. Oligosaccharides: state of the art. Proc Nutr Soc. 2003;62:177–82. doi: 10.1079/pns2002225. [DOI] [PubMed] [Google Scholar]
- 7.Cani PD, Knauf C, Iglesias MA, Drucker DJ, Delzenne NM, Burcelin R. Improvement of glucose tolerance and hepatic insulin sensitivity by oligofructose requires a functional glucagon-like peptide-1 receptor. Diabetes. 2006;55:1484–90. doi: 10.2337/db05-1360. [DOI] [PubMed] [Google Scholar]
- 8.Parnell JA, Reimer RA. Weight loss during oligofructose supplementation is associated with decreased ghrelin and increased peptide YY in overweight and obese adults. Am J Clin Nutr. 2009;89:1751–9. doi: 10.3945/ajcn.2009.27465. [DOI] [PMC free article] [PubMed] [Google Scholar]
- 9.Delzenne NM, Cani PD, Neyrinck AM. Modulation of glucagon-like peptide 1 and energy metabolism by inulin and oligofructose: experimental data. J Nutr. 2007;137:S2547–51. doi: 10.1093/jn/137.11.2547S. [DOI] [PubMed] [Google Scholar]
- 10.Cani PD, Neyrinck AM, Maton N, Delzenne NM. Oligofructose promotes satiety in rats fed a high-fat diet: involvement of glucagon-like peptide-1. Obes Res. 2005;13:1000–7. doi: 10.1038/oby.2005.117. [DOI] [PubMed] [Google Scholar]
- 11.Zhou J, Martin RJ, Tulley RT, Raggio AM, McCutcheon KL, Shen L, Danna SC, Tripathy D, Hegsted M, Keenan MJ, et al. Dietary resistant starch upregulates total GLP-1 and PYY in a sustained day-long manner through fermentation in rodents. Am J Physiol Endocrinol Metab. 2008;295:E1160–6. doi: 10.1152/ajpendo.90637.2008. [DOI] [PMC free article] [PubMed] [Google Scholar]
- 12.Cani PD, Possemiers S, Van de Wiele T, Guiot Y, Everard A, Rottier O, Geurts L, Naslain D, Neyrinck A, Lambert DM, et al. Changes in gut microbiota control inflammation in obese mice through a mechanism involving GLP-2-driven improvement in gut permeability. Gut. 2009;58:1091–103. doi: 10.1136/gut.2008.165886. [DOI] [PMC free article] [PubMed] [Google Scholar]
- 13.Papanas N, Maltezos E, Mikhailidis D. Metformin: diamonds are forever. Expert Opin Pharmacother. 2009;10:2395–7. doi: 10.1517/14656560903176453. [DOI] [PubMed] [Google Scholar]
- 14.Zhou G, Myers R, Li Y, Chen Y, Shen X, Fenyk-Melody J, Wu M, Ventre J, Doebber T, Fujii N, et al. Role of AMP-activated protein kinase in mechanism of metformin action. J Clin Invest. 2001;108:1167–74. doi: 10.1172/JCI13505. [DOI] [PMC free article] [PubMed] [Google Scholar]
- 15.Viollet B, Guigas B, Leclerc J, Hebrard S, Lantier L, Mounier R, Andreelli F, Foretz M. AMP-activated protein kinase in the regulation of hepatic energy metabolism: from physiology to therapeutic perspectives. Acta Physiol (Oxf) 2009;196:81–98. doi: 10.1111/j.1748-1716.2009.01970.x. [DOI] [PMC free article] [PubMed] [Google Scholar]
- 16.Mannucci E, Ognibene A, Cremasco F, Bardini G, Mencucci A, Pierazzuoli E, Ciani S, Messeri G, Rotella CM. Effect of metformin on glucagon-like peptide 1 (GLP-1) and leptin levels in obese nondiabetic subjects. Diabetes Care. 2001;24:489–94. doi: 10.2337/diacare.24.3.489. [DOI] [PubMed] [Google Scholar]
- 17.Yasuda N, Inoue T, Nagakura T, Yamazaki K, Kira K, Saeki T, Tanaka H. Enhanced secretion of glucagon-like peptide 1 by biguanide compounds. Biochem Biophys Res Commun. 2002;298:779–84. doi: 10.1016/s0006-291x(02)02565-2. [DOI] [PubMed] [Google Scholar]
- 18.Kim Y-W, Kim J-Y, Park Y-H, Park S-Y, Won K-C, Choi K-H, Huh J-Y, Moon K-H. Metformin restores leptin sensitivity in high fat-fed obese rats with leptin resistance. Diabetes. 2006;55:716–24. doi: 10.2337/diabetes.55.03.06.db05-0917. [DOI] [PubMed] [Google Scholar]
- 19.Eller LK, Reimer RA. A high calcium, skim milk powder diet results in a lower fat mass in male, energy-restricted, obese rats more than a low calcium, casein or soy protein diet. J Nutr. 2010;140:1234–41. doi: 10.3945/jn.109.119008. [DOI] [PubMed] [Google Scholar]
- 20.Parnell JA, Reimer RA. Effect of prebiotic fiber supplementation on hepatic gene expression and serum lipids: a dose-response study in JCR: LA-cp rats. Br J Nutr. 2010;103:1577–84. doi: 10.1017/S0007114509993539. [DOI] [PMC free article] [PubMed] [Google Scholar]
- 21.Maurer AD, Chen Q, McPherson C, Reimer RA. Changes in satiety hormones and expression of genes involved in glucose and lipid metabolism in rats weaned onto diets high in fiber or protein reflect susceptibility to increased fat mass in adulthood. J Physiol. 2009;587:679–91. doi: 10.1113/jphysiol.2008.161844. [DOI] [PMC free article] [PubMed] [Google Scholar]
- 22.Kirino Y, Kamimoto T, Sata Y, Kawazoe K, Minakuchi K, Nakahori Y. Increased plasma dipeptidyl peptidase IV (DPP IV) activity and decreased DPP IV activity of visceral but not subcutaneous adipose tissue in impaired glucose tolerance rats induced by high-fat or high-sucrose diet. Biol Pharm Bull. 2009;32:463–7. doi: 10.1248/bpb.32.463. [DOI] [PubMed] [Google Scholar]
- 23.Reimer RA. Meat hydrolysate and essential amino acid-induced glucagon like peptide-1 secretion in the human enteroendocrine NCI-H716 cell line is regulated by extracellular signal-regulated kinase 1/2 and p38 mitogen-activated protein kinases. J Endocrinol. 2006;191:159–70. doi: 10.1677/joe.1.06557. [DOI] [PMC free article] [PubMed] [Google Scholar]
- 24.Parnell JA, Reimer RA. Prebiotic fibres dose-dependently increase satiety hormones and alter Bacteroidetes and Firmicutes in lean and obese JCR:LA cp rats. Br J Nutr. doi: 10.1017/S0007114511003163. Epub 2011 Jul 18. [DOI] [PMC free article] [PubMed] [Google Scholar]
- 25.Reimer RA, Darimont C, Nicolas-Metral V, Gremlich S, Rüegg UT, Macé K. A human cellular model for studying the regulation of glucagon-like peptide 1 secretion. Endocrinology. 2001;142:4522–8. doi: 10.1210/endo.142.10.8415. [DOI] [PubMed] [Google Scholar]
- 26.Mentlein R. Mechanisms underlying the rapid degradation and elimination of the incretin hormones GLP-1 and GIP. Best Pract Res Clin Endocrinol Metab. 2009;23:443–52. doi: 10.1016/j.beem.2009.03.005. [DOI] [PubMed] [Google Scholar]
- 27.He L, Sabet A, Djedjos S, Miller R, Sun X, Hussain MA, Radovick S, Wondisford FE. Meformin and insulin suppress hepatic gluconeogenesis through phosphorylation of CREB binding protein. Cell. 2009;137:635–46. doi: 10.1016/j.cell.2009.03.016. [DOI] [PMC free article] [PubMed] [Google Scholar]
- 28.Delmée E, Cani PD, Gual G, Knauf C, Burcelin R, Maton N, Delzenne NM. Relation between colonic proglucagon expression and metabolic response to oligofructose in high fat diet-fed mice. Life Sci. 2006;79:1007–13. doi: 10.1016/j.lfs.2006.05.013. [DOI] [PubMed] [Google Scholar]
- 29.Roden M, Petersen KF, Schulman G. Nuclear magnetic resonance studies of hepatic glucose metabolism in humans. Recent Prog Horm Res. 2001;56:219–37. doi: 10.1210/rp.56.1.219. [DOI] [PubMed] [Google Scholar]
- 30.Rector RS, Thyfault JP, Morris RT, Laye MJ, Borengasser SJ, Booth FW, Ibdah JA. Daily exercise increases hepatic fatty acid oxidation and prevents steatosis in Otsuka Long-Evans Tokushima fatty rats. Am J Physiol Gastrointest Liver Physiol. 2008;294:G619–26. doi: 10.1152/ajpgi.00428.2007. [DOI] [PubMed] [Google Scholar]
- 31.Andreelli F, Foretz M, Knauf C, Cani PD, Perrin C, Iglesias MA, Pillot B, Bado A, Tronche F, Mithieux G, et al. Liver adenosine mono-phosphate-activated kinase a2 catalytic subunit is a key target for the control of hepatic glucose production by adiponectin and leptin but no insulin. Endocrinology. 2006;147:2432–41. doi: 10.1210/en.2005-0898. [DOI] [PubMed] [Google Scholar]
- 32.Gniuli D, Calcagno A, Dalla Libera L, Calvani R, Leccesi L, Caristo ME, Vettor R, Castagneto M, Ghirlanda G, Mingrone G, et al. High-fat feeding stimulates endocrine, glucose-dependent insulinotropic poly-peptide (GIP)-expressing cell hyperplasia in the duodenum of Wistar rats. Diabetologia. 2010;53:2233–40. doi: 10.1007/s00125-010-1830-9. [DOI] [PubMed] [Google Scholar]
- 33.Mazzaferri EL, Starich GH, Lardinois CK, Bowen GD. Gastric inhibitory polypeptide responses to nutrients in Caucasians and American Indians with obesity and noninsulin-dependent diabetes mellitus. J Clin Endocrinol Metab. 1985;61:313–21. doi: 10.1210/jcem-61-2-313. [DOI] [PubMed] [Google Scholar]
- 34.Miyawaki K, Yamada Y, Ban N, Ihara T, Tsukiyama K, Zhou H, Fujimoto S, Oku A, Tsuda K, Toyokuni S, et al. Inhibition of gastric inhibitory polypeptide signaling prevents obesity. Nat Med. 2002;8:738–42. doi: 10.1038/nm727. [DOI] [PubMed] [Google Scholar]
- 35.Kim SJ, Nian C, McIntosh CH. Resistin is a key mediator of glucose-dependent insulinotropic polypeptide (GIP) stimulation of lipoprotein lipase (LPL) activity in adipocytes. J Biol Chem. 2007;282:34139–47. doi: 10.1074/jbc.M704896200. [DOI] [PubMed] [Google Scholar]
- 36.Musso G, Gambino R, Pacini G, De Michieli F, Cassader M. Prolonged saturated fat-induced, glucose-dependent insulinotropic polypeptide elevation is associated with adipokine imbalance and liver injury in nonalcoholic steatohepatitis: dysregulated enteroadipocyte axis as a novel feature of fatty liver. Am J Clin Nutr. 2009;89:558–67. doi: 10.3945/ajcn.2008.26720. [DOI] [PubMed] [Google Scholar]
- 37.Ley RE, Turnbaugh PJ, Klein S, Gordon JI. Human gut microbes associated with obesity. Nature. 2006;444:1022–3. doi: 10.1038/4441022a. [DOI] [PubMed] [Google Scholar]
- 38.Turnbaugh PJ, Ley RE, Mahowald MA, Magrini V, Mardis ER, Gordon JI. An obesity-associated gut microbiome with increased capacity for energy harvest. Nature. 2006;444:1027–31. doi: 10.1038/nature05414. [DOI] [PubMed] [Google Scholar]
- 39.Bäckhed F, Manchester JK, Semenkovich CF, Gordon JI. Mechanisms underlying the resistance to diet-induced obesity in germ-free mice. Proc Natl Acad Sci USA. 2007;104:979–84. doi: 10.1073/pnas.0605374104. [DOI] [PMC free article] [PubMed] [Google Scholar]
- 40.Santacruz A, Collado MC, Garcia-Valdes L, Segura MT, Martin-Lagos JA, Marti-Romero M, Lopez RM, Florido J, Campoy C, Sanz Y, et al. Gut microbiota composition is associated with body weight, weight gain and biochemical parameters in pregnant women. Br J Nutr. 2010;104:83–92. doi: 10.1017/S0007114510000176. [DOI] [PubMed] [Google Scholar]
- 41.Alam ML, Van der Schueren BJ, Ahren B, Wang GC, Swerdlow NJ, Arias S, Bose M, Gorroochurn P, Teixeira J, McGinty J, et al. Gastric bypass surgery, but not caloric restriction, decreases dipeptidyl peptidase-4 activity in obese patients with type 2 diabetes. Diabetes Obes Metab. 2011;13:378–81. doi: 10.1111/j.1463-1326.2011.01358.x. [DOI] [PMC free article] [PubMed] [Google Scholar]
- 42.Zardooz H, Rostamkhani F, Zaringhalam J, Faraji Shahrivar F. Plasma corticosterone, insulin and glucose changes induced by brief exposure to isoflurane, diethyl ether and CO2 in male rats. Physiol Res. 2010;59:973–8. doi: 10.33549/physiolres.931896. [DOI] [PubMed] [Google Scholar]