

Abstract
Obesity has been associated with cognitive decline in longitudinal studies of older individuals. We hypothesized that the cognitive sequelae of obesity may be detectable in the reproductive years. In addition, we explored the hypothesis that these associations may be mediated by the hormonal milieu.
In this study of 49 young healthy lean and overweight women aged 20–45, we investigated the association between performance on a battery of cognitive tests, body composition parameters (BMI, total fat, abdominal (visceral, subcutaneous and total) adipose tissue, and muscle), and hormone levels (insulin, adiponectin, leptin, IGF-1, estrogen, testosterone, and vitamin D). We found a significant negative association between both visceral adiposity and muscle, and performance in the domain of verbal learning and memory, after controlling for age and education. Other body composition parameters showed similar trends (0.05<p<0.10). Additionally, the degree of insulin resistance was negatively associated with executive function domain. None of the associations between the other hormones examined (adipokines, IGF-1, gonadal hormones and vitamin D) and cognitive function were significant.
These preliminary findings suggest a possible association between obesity and cognitive function in healthy young women of reproductive age. More research is warranted into the potential modulatory effect of insulin resistance on this association.
Introduction
Obesity is a growing epidemic in the United States, with considerable impact on health care expenditures, morbidity and mortality1. Over the past decade, obesity has been increasingly associated with cognitive decline, particularly in older individuals. In cross-sectional studies, elevated body mass index (BMI, kg/m2), as well as the metabolic syndrome, have been associated with deficits in memory, executive function, processing speed, semantic fluency, and overall cognitive function2–4. Detailed longitudinal studies have shown that elevated BMI is an independent risk factor for accelerated brain atrophy, and increased risk of cognitive decline, including Alzheimer’s disease 5–7.
In younger individuals, deficits in attention, executive function, verbal learning, verbal memory and manual coordination have been noted with increasing BMI8–14. However, most of these studies have focused either on adolescents14 or middle-aged adults (e.g. mean age 49 13), describe patients specifically presenting for treatment of their obesity 9,12, and use limited measures of either cognitive outcome (e.g. executive function 10) or body composition (e.g. BMI or waist-hip ratio 13).
The association between obesity and cognitive impairment may not result solely from such known risk factors as dyslipidemia, hypertension, and endothelial dysfunction13. Recent evidence suggests that the hormonal milieu associated with obesity may itself modulate cognitive changes. Insulin resistance has been most frequently proposed as a regulator of this process, likely because of the link between metabolic syndrome and cognitive dysfunction15,16. Cognitive domains implicated include executive function 2, verbal fluency17 and working memory18, 19. Similarly, the hormone insulin-like growth factor 1 (IGF-1) has been shown to exert neurophysiologic effects: it positively predicts cognitive development among children 20, and may be neuroprotective against cognitive decline in the middle and later years 21–23, but this has not been studied in premenopausal women. Studies of other hormones, including adiponectin2,24, leptin25, estrogen 26, testosterone 27,28 and vitamin D29 have shown more variable results, partially due to small sample sizes and variable study design.
To our knowledge, this study is the first to investigate in detail the association of cognitive function with weight and body composition in healthy 20–45 year old women, and to explore hormonal correlates of this effect. We obtained detailed measures of cognitive function, body composition variables, and hormonal profiles in overweight participants and normal-weight controls. Our first aim was to test the hypothesis that even in young healthy women, cognitive function is negatively associated with weight and body composition. Our second aim, based on the emerging evidence for endocrine mediation outlined above, was to explore associations between cognitive function and selected hormone levels.
Methods and Procedures
Subjects
Forty-nine eumenorrheic, healthy women were enrolled in the study. Thirty-seven of these women had BMI ≥ 25 kg/m2 and waist circumference >88 cm, of whom 34 were a subset of a cohort of 76 women entered in a longitudinal study examining the effects of growth hormone replacement on abdominal obesity30. Because the present study was initiated after the longitudinal one, only 34 of these women were enrolled, and they were enrolled consecutively. The remaining women (N=12) were of normal weight, with 18 < BMI < 25 kg/m2. Subjects were recruited by advertisement. Inclusion criteria included age 20–45 years, BMI >18 kg/m2, and a complete set of body composition parameters available at baseline. Exclusion criteria included English as a second language, color-blindness, smoking, pregnancy or breastfeeding, hypothalamic or pituitary disorders, diabetes mellitus or other chronic illnesses, estrogen or glucocorticoid use, use of statins or anti-hypertensives, and a score of moderate or major depression on the Beck Depression Inventory.
Protocol
The study was approved by the Partners Healthcare, Inc. Institutional Review Board, and written, informed consent was obtained prior to initiating any procedures. Each subject was admitted to the Clinical Research Center at Massachusetts General Hospital for outpatient testing. Fasting serum was drawn for insulin, glucose, gonadal hormones and adipokines (see Biochemical Analysis), followed by a 75-g, 2-hour oral glucose tolerance test (OGTT) to measure glucose and insulin at 30, 60, 90 and 120 minutes after glucose load. Cross-sectional computed tomography (CT) and dual-energy x-ray absorptiometry (DXA) were performed to measure body composition.
A detailed battery of cognitive tests was then administered. All cognitive scoring was performed at the Massachusetts General Hospital Psychology Assessment Center. Initial questions included age, years of education, and handedness. Additionally, participants completed the Beck Depression Inventory (BDI), a 21-item self-report rating inventory measuring characteristic attitudes and symptoms of depression. Then, subjects underwent the following battery of standardized neuropsychological tests, which have been reviewed in detail 31:
Wechsler Test of Adult Reading (WTAR): measures adult reading as an estimate of IQ
-
Trail-Making Tests A and B:
A: test of visual attention and tracking
B: test of executive function requiring set shifting, alternately connecting letters and numbers
California Verbal Learning Test, Second Edition (CVLT-II): test of verbal learning and memory
Stroop test (D-KEFS version): test of selective attention, response inhibition and set shifting
Rey Complex Figure (RCF): test of visual construction, organization and (nonverbal) memory
Digit Symbol Substitution Test (DSS): test of executive function and processing speed
Verbal Fluency (D-KEFS version): test of behavioral initiation, lexical access and set shifting
Biochemical Analyses
Serum samples were collected and stored at −80 °C. Serum total IGF-1 levels were measured using a solid-phase enzyme-labeled chemiluminescent immunometric assay on the Immulite 2000 automated immunoanalyzer (Siemens Medical Solutions Diagnostics, Los Angeles, CA) with an inter-assay coefficient of variation (cv) of 3.7–4.2%. Estradiol, glucose, insulin, and sex hormone binding globulin (SHBG) were measured by automated immunoassay (Architect; Abbott Diagnostics, Chicago, IL). The lower limit of detection of estradiol was 10 pg/ml, with an intra-assay cv of 1.4–6.4%. The lower limit of detection of insulin was 1.0 NU/ml, with an intra-assay cv of 1.9–5.2% and with an inter-assay cv of 2.0–9.6%. The lower limit of detection of SHBG was 0.01 nmol/l, with an intra-assay cv of 5.65–9.54%. Serum testosterone levels were measured by a solid-phase radioimmunoassay Coat-A-Count RIA kit (Siemens Medical Solutions Diagnostics, Los Angeles, CA) with a minimum detection limit of 2.2 pg/ml and an intra-assay cv of 0.5–1.9%. Free testosterone levels were calculated from total testosterone and SHBG using the laws of mass action32, and free estradiol levels were calculated from total estradiol and SHBG using the laws of mass action. Adiponectin (total and high molecular weight [HMW] forms) was measured by enzyme-linked immunosorbent assay (ALPCO Diagnostics, Inc., Salem, NH), with an intra-assay cv of less than 8%, and an inter-assay of less than 10%. Leptin was measured using an ELISA kit (Millipore, Milwaukee, WI), with a sensitivity of 0.5 ng/ml, an intra-assay cv of 2.6–4.6%, and an inter-assay cv of 2.6–6.2%. Vitamin D was measured by an IDS-iSYS Multi-Discipline Automated Analyzer based on chemiluminescence technology (Immunodiagnostic Systems, Inc., Fountain Hills, AZ), with a minimum detection limit of 3.6 ng/ml and a within-run cv of 5.5 to 12.1%.
Body Composition Analysis
Body fat mass was determined with dual energy x-ray absorptiometry (DXA) using a Hologic QDR 4500 scanner (Hologic Inc., Waltham, MA). Adipose tissue and muscle areas were measured with a LightSpeed CT scanner (General Electric, Milwaukee, WI). Scan parameters: 144 cm table height, 80kV (abdomen), 120 kV (thigh), 70 mA (abdomen), 170 mA (thigh), 1 cm slice thickness, scan time 2 seconds, 48 cm FOV. Single-slice cross-sectional CT of the abdomen at the level of L4 was obtained to determine abdominal subcutaneous adipose tissue (SAT), visceral adipose tissue (VAT), and total adipose tissue (TAT). Single-slice cross-sectional CT of the left mid-thigh was obtained to determine fat and muscle cross sectional areas (CSA). Analyses were performed using Alice software (version 4.3.9 Parexel, Waltham, MA).
Statistical Analysis
Data were analyzed using the SAS software program JMP, version 8.0.1 (Cary, N.C.). Raw cognitive test results were centered from the sample mean. Tests were then grouped into specific cognitive domains. Cognitive domain z scores for each subject were calculated by first summing the individual z scores for each of the test scores within the cognitive domain subscales and then subtracting each participant’s score from the sample mean and dividing by the standard deviation of the sample.
The cognitive domains are as follows:
Processing Speed: DSS, Stroop Color, Stroop Word
Executive function: Verbal Fluency Letter, Verbal Fluency Category
Verbal Learning and Memory: CVLT-II (Short Delay Free Recall; Short Delay Cued Recall; Long Delay Free Recall; Long Delay Cued Recall; Trials 1–5)
Visual Memory: RCF Immediate, RCF Delayed
Visuospatial skills: RCF Copy
Additional cognitive outcomes were not included because they did not add any unique explanatory power to the models.
Our primary analysis was to examine the association between BMI and other body composition parameters, and cognitive outcomes. Our secondary analysis was to explore the association between individual hormones and cognitive outcomes. Multivariate standard least squares regressions were constructed between each cognitive domain z-score and individual body composition (BMI, total adiposity (TAT), visceral adiposity (VAT), subcutaneous adiposity (SAT), total fat, and muscle CSA) and hormones ((1) glucose homeostasis, (2) IGF-1, (3) adipokines, (4) gonadal steroids, and (5) vitamin D), adjusting for age and education. It should be noted that because a limited number of subjects had adipokines drawn (adiponectin, N=30 and leptin, N=32), the N for these analyses was consequently reduced. For each body composition parameter, the association with cognitive scores was investigated both assuming a linear relationship and by categorizing the body composition parameter into three groups. For BMI, WHO criteria were used to categorize patients into overweight and obese categories, and for other parameters tertiles were used to categorize subjects. If the three groups were significantly different by overall ANOVA, pairwise comparisons were performed. When a cognitive domain yielded a significant result, then individual tests within those domains were examined using the same approach.
In addition to these primary analyses, three additional analyses were investigated to better understand the combined relationship of body compositions measures and hormones. First, given the effect of menstrual cycle on cognitive functioning 33, we completed all of the previous analyses also adjusting for estradiol. Second, to assess the independent effect of body composition measures on each cognitive measure with a significant association, the original models for the body composition were also fit controlling for BMI. Third, for hormones and body composition parameters revealing significant associations with cognitive outcomes, we then included each individual body composition parameter in turn, as well as each hormone, in the model to assess whether the body composition and endocrine effects were independent. Additional analyses of the combined effects and interactions among the hormones and body composition measures were not completed given our limited sample size.
Results
1. Subject characteristics (Table 1)
Table 1.
Subject characteristics.
| All Women | Overweight/Obese | Normal-Weight | |
|---|---|---|---|
|
| |||
| N | 49 | 37 | 12 |
|
| |||
| Mean (median; range; standard deviation) | |||
|
| |||
| Age (years) | 34.6 (35; 22–45; 7.0) | 35.5 (37; 22–45; 7.1) | 31.6 (30; 22–45; 6.4) |
| BMI (kg/m2) *** | 31.5 (32.5; 18.1–47.5; 7.4) | 34.7 (34.7; 25.1–47.5; 5.5) | 21.9 (22.3; 18.1–24.6; 2.2) |
| Education (years) | 16.1 (16; 12–24; 2.1) | 15.9 (16; 12–24; 2.3) | 16.6 (16.5; 14–19; 1.3) |
| Race | |||
| White | 78% | 76% | 83% |
| Black/African American | 14% | 19% | 0% |
| Asian/Asian American | 4% | 3% | 8% |
| Other | 4% | 3% | 8% |
| Handedness (% Right) | 90% | 92% | 83% |
| WTAR std score (μ=100, sd=15) | 113 (114; 87–127; 9) | 112 (114; 87–127; 9) | 117 (117; 106–127; 7) |
| Depression Scale (BDI) | |||
| Minimal | 98% | 97% | 100% |
| Mild | 2% | 3% | 0% |
|
| |||
| HORMONES | |||
|
| |||
| Glucose Homeostasis | |||
| Glucose OGTT AUC | 14932 (14580; 10530–24720; 3242) | 15735 (15615; 10605–24720; 3234) | 12455 (12210; 10602–14970; 1665) |
| Insulin AUC | 4922 (3344; 179–13152; 3455) | 5726 (4692; 941–13152; 3515) | 2219 (2256; 179–3649; 1094) |
| HOMA-IR | 1.413 (1.180; 0.082–4.317; 0.994) | 1.626 (1.517; 0.116–4.317; 1.018) | 0.69 (0.706; 0.082–1.489; 0.430) |
| Adipokines | |||
| Adiponectin, total (mcg/mL) | 5.65 (6.0; 2.1–9.5; 1.96) | 5.3 (5.9; 2.1–8.3; 2.0) | 6.3 (6.3; 3.2–9.5; 1.9) |
| Leptin (ng/mL) | 31.7 (26.0; 2.2–120.3; 25.7) | 43.2 (40.9; 9.6–120.3; 25.7) | 12.6 (9.7; 2.2–35.3; 9.1) |
| IGF1 | |||
| IGF-1 (ng/mL) | 131 (131; 46–329; 50.1) | 129 (130; 46–329; 55.2) | 136 (143; 86–185; 28.8) |
| Gonadal Steroids | |||
| Free Estradiol (pg/mL) | 74.6 (57.4; 12–358; 61.4) | 77.4 (57.6; 17.6–357.8; 64.8) | 66.0 (50.4; 12–150; 51.6) |
| Total Estradiol (pg/mL) | 116 (91; 6–440; 85.3) | 117.8 (94; 27–440; 87.2) | 82.5 (78; 6–238; 82.5) |
| Free Testosterone (ng/dL) | 0.53 (0.41; 0.11–2.64; 0.45) | 0.58 (0.42; 0.11–2.64; 0.49) | 0.37 (0.36; 0.13–0.90; 0.23) |
| Total Testosterone (ng/dL) | 38.0 (30; 9–121; 25.5) | 39 (31; 11–121; 26.9) | 35 (28; 9–79; 21.0) |
| Vitamin D metabolism | |||
| 25 OH-Vitamin D (ng/mL) | 25.3 (24; 5–69; 12.4) | 23.6 (21; 5–69; 12.6) | 31.1 (31; 13–46; 10.1) |
p < 0.0001
Subjects had a mean age of 35 years, a mean BMI of 31.5 kg/m2, and had completed on average at least 4 years of college education. Ninety percent were right-handed. All subjects were normotensive. Overweight/obese women were on average older, less educated and with lower WTAR scores than normal weight women; however none of these differences was statistically significant.
2. Association between body composition parameters and cognitive function
In linear regression models with parameters treated as continuous variables, we found a significant negative association between both VAT and muscle and performance in the domain of verbal learning and memory, after controlling for age and education (Table 2). All other markers of body composition examined also showed trends toward negative associations with performance in this domain (0.05<p<0.10). Of the individual tests examined, Trials 1–5 consistently revealed a statistically significant association with all body composition markers. In linear regression models with parameters treated as categorical, we found a significant negative association between SAT (p=0.010) and TAT (p=0.019) and verbal learning and memory, but not for muscle (p=0.114), BMI (p=0.087), VAT (p=0.143) or total fat (p=0.089). Figure 1 highlights these associations, with cognitive outcomes adjusted for age and education. The domains of executive function, processing speed, visuospatial skills and visual memory revealed no statistically significant associations with any body composition parameters (Supplementary Table 1).
Table 2.
Association between body composition markers and verbal learning and memory.
Multivariate regressions for cognitive scores by individual body composition markers, controlling for age and education (N = 48). Partial correlation coefficients and p-values are provided.
| BMI (kg/m2) | Total Abdominal Fat (mm2 ) | Visceral Abdominal Fat (mm2) | Subcutaneous Abdominal Fat (mm2) | Total Fat (g) | Muscle, Thigh (mm2) | |||||||
|---|---|---|---|---|---|---|---|---|---|---|---|---|
|
| ||||||||||||
| partial r | p | partial r | p | partial r | p | partial r | p | partial r | p | partial r | p | |
| Verbal Learning/Memory Composite Score | −0.25 | 0.093 | −0.28 | 0.055 | −0.33 | 0.024 | −0.25 | 0.099 | −0.25 | 0.094 | −0.38 | 0.012 |
| Short Delay Free Recall | −0.22 | 0.139 | −0.23 | 0.121 | −0.27 | 0.067 | −0.20 | 0.183 | −0.19 | 0.204 | −0.33 | 0.024 |
| Short Delay Cued Recall | −0.22 | 0.139 | −0.23 | 0.115 | −0.25 | 0.097 | −0.21 | 0.160 | −0.21 | 0.156 | −0.39 | 0.006 |
| Long Delay Free Recall | −0.15 | 0.331 | −0.19 | 0.204 | −0.28 | 0.054 | −0.15 | 0.325 | −0.13 | 0.382 | −0.25 | 0.105 |
| Long Delay Cued Recall | −0.19 | 0.206 | −0.21 | 0.155 | −0.26 | 0.075 | −0.18 | 0.231 | −0.18 | 0.226 | −0.33 | 0.028 |
| Trials 1–5 | −0.39 | 0.007 | −0.39 | 0.007 | −0.42 | 0.003 | −0.34 | 0.018 | −0.39 | 0.007 | −0.53 | 0.000 |
Figure 1.

Plots of mean z-scores for verbal learning and memory domain, adjusted for age and education, by body composition parameters.
Models for subcutaneous (SAT) and total (TAT) abdominal fat yielded significant associations with verbal learning and memory (p=0.010 and p=0.019 respectively, but not for BMI or muscle (p= 0.087 and p=0.114, respectively). For SAT and TAT, group differences significant by student’s t test to p<0.05 are indicated with a *.
A. Subjects were divided by BMI, into normal (18<BMI<25 kg/m2, N=12), overweight by WHO criteria (25 ≤ BMI<30 kg/m2, N=8) and obese by WHO criteria (BMI ≥ 30kg/m2, N=29).
B. Subjects were divided by subcutaneous abdominal fat, with 1st tertile ranging from 7250 to 29570 mm2 (N=16), 2nd tertile ranging from 32430 to 47680 mm2 (N=16), and 3rd tertile ranging from 47850 to 80010 mm2 (N=16).
C. Subjects were divided by total abdominal fat, with 1st tertile ranging from 10360 to 40220 mm2 (N=16), 2nd tertile ranging from 40750 to 59840 mm2 (N=16), and 3rd tertile ranging from 60640 to 97300 mm2 (N=16).
D. Subjects were divided by muscle cross-sectional area, with 1st tertile ranging from 7578 to 12276 mm2 (N=16), 2nd tertile ranging from 12312 to 14539 mm2 (N=16), and 3rd tertile ranging from 14743 to 18663 mm2 (N=16).
3. Association between endocrine markers and cognitive function
There was a statistically significant negative association between HOMA-IR and executive function, in multivariate regressions performed for cognitive domains and individual hormones, adjusting for age and education (r=0.322, p = 0.021, Figure 2). When the individual tests of the executive domain were investigated, a statistically significant negative association with DKEFS category was observed (partial r=−0.301, p=0.042), but not with DKEFS letter (p=0.062). None of the other hormones examined revealed any significant associations with cognitive outcomes after controlling for age and education (Supplementary Table 2).
Figure 2.
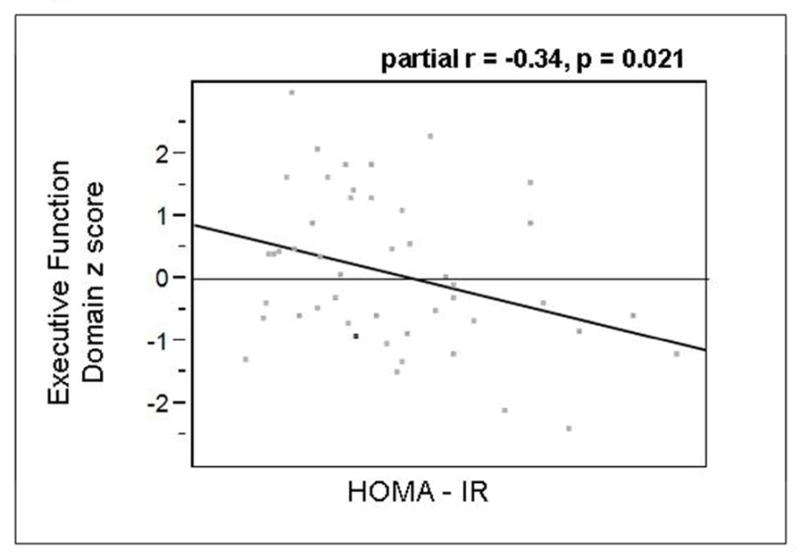
Partial regression plot for executive function domain z score by HOMA-IR, adjusted for age and education. Partial r = −0.34, p = 0.021.
4. Combined effects of body composition and hormone levels on cognitive function
Given the associations above, several additional multivariate models were fit to investigate the combined effect of the measures. First, all models were run with estradiol as an additional predictor. The inclusion of estradiol did not change which body composition or endocrine variables were found to be significantly associated with cognitive outcomes.
Given the considerable correlations between individual body composition parameters (Supplementary Table 3), additional models were run with individual body composition parameters adjusting for age, education and BMI to identify which measures had an independent effect on verbal learning and memory. These revealed that neither BMI nor any of the fat/muscle parameters (total fat, total muscle, TAT, SAT, VAT) was significant at p<0.05 when both BMI and individual fat/muscle parameters were included in the model, possibly reflecting colinearity between these measures.
Finally, given the correlation between HOMA-IR and individual body composition parameters (Supplementary Table 3), two sets of additional models were run to examine significant findings from Sections 2 and 3 above. In the first, in order to assess whether HOMA-IR was independently associated with executive functioning when controlling for the individual body composition measures, we fit separate regression models in each case. When individual body composition markers were added into the model in turn, the association between HOMA-IR and executive function domain remained significant when controlling for muscle (p=0.022) and SAT (p=0.045), was suggestive for VAT, TAT and BMI (0.05<p<0.06), and was not significant for total fat (p=0.103). When total testosterone was added to the model including HOMA-IR, age and education, this measure showed a trend toward an effect.
In the second, in order to assess whether body composition measures remained significantly associated with cognitive performance after controlling for HOMA-IR, we fit separate regression models in each case. In regression models with parameters treated as continuous, controlling HOMA-IR as well as age and education, we continued to find a significant negative association between performance in the verbal learning and memory domain for VAT (p=0.0057) and muscle (p=0.009); the association was now also significant for TAT (p=0.023) and remained suggestive for BMI, SAT and total fat (0.05<p<0.07). When parameters were treated as categorical, VAT (p=0.041), muscle (p=0.0465) and TAT (p=0.0061) remained significant; SAT (p=0.0022) and total fat (p=0.0363) were now significant, and BMI remained suggestive (p=0.067). When we performed these analyses controlling for HOMA-IR for all other cognitive function domains, only VAT when treated as categorical but not as continuous, showed a significant association with performance in the visual memory domain (p=0.020 and p=0.275, respectively).
Discussion
The major finding of this study is that in young, healthy, highly educated women of reproductive age without comorbidities, body composition parameters associated with obesity are negatively correlated with cognitive function in the domain of verbal learning and memory. These findings may support an emerging body of literature linking obesity with cognitive dysfunction not only in the elderly, who have comorbidities (hypertension, hyperlipidemia, diabetes mellitus, cerebral microvascular disease), but also in the young10. In this study, we administered a comprehensive battery of cognitive tests. Our subject recruitment, from a healthy population of female volunteers aged 20–45, differs from other small detailed studies of cognitive function in the young, either in (1) age group, where mostly adolescents 14 or adults with mean age late 40s 13 have been described; (2) subject recruitment from a healthy volunteer population rather than a clinic for obesity treatment 9,12, or (3) more detailed measures were used than prior measures of either cognitive outcome (e.g. executive function10 or psychomotor speed11 ) and body composition (e.g. BMI or waist-hip ratio13).
Additionally, we found a more significant association between detailed measurements of body composition (visceral adiposity and muscle) and relative deficits in cognitive function, than for BMI. These findings support the hypothesis that visceral adiposity may be a more important contributor to dementia than is BMI per se 34. Although in older adults muscle wasting is associated with cognitive decline35, in our study of younger women, muscle cross-sectional area was negatively associated with cognitive function. This probably reflects the fact that our subjects with higher BMIs also had higher amounts of muscle in addition to higher amounts of fat, either from the increased thigh muscle required to support increased weight, or from fatty infiltration of muscle. Supporting this hypothesis, we found no associations between thigh muscle and verbal learning and memory when controlling for BMI. To our knowledge no other studies have examined the relationship between muscle and cognitive function in young healthy women, and these findings require replication and further investigation.
While it is possible that even in young adults, cognitive function is affected by silent cerebrovascular sequelae of obesity, hormonal correlates of cognitive function may be important modulators. Insulin resistance in particular has been studied 15–17,19 and may mediate cognitive function through modulation of hippocampal synaptic plasticity 36, neuroinflammation and subsequent protein deposition 37, and may have gender-specific effects due to interactions with gonadal steroids 38. Insulin resistance has been implicated in cognitive dysfunction in neurologically normal older adults, even in the absence of silent microvascular disease on MRI2. In this study, we found that HOMA-IR levels were negatively correlated with executive function. Interestingly, when we controlled for HOMA-IR, the association between body composition parameters and verbal learning and memory remained, and for some parameters even became, significant, suggesting that several mechanisms are at play. Additionally, while prior studies have shown that high levels of serum IGF-1 appear to be both predictive of cognitive development among children 20 and protective against cognitive decline in the middle and later years23, we did not detect any association in this study.
In this exploratory analysis of endocrine markers of cognitive function, we investigated whether the adipokines adiponectin, which is associated with insulin regulation and fatty acid metabolism, and leptin, a hormone signaling appetite, were associated with cognitive function, but detected no effect. Prior studies of adipokines and cognitive function, primarily in the elderly, have yielded conflicting results2,24,25,39. The potential neuroprotective effects of vitamin D metabolism have generated considerable research interest, with potential positive effects of higher levels in the elderly29, but not definitively in adults aged 20–5940; in this study, no association was noted. Finally, there has been intense interest in the effect of sex hormones on cognition, especially with the decline in estrogen levels at menopause26. Testosterone may also be neuroprotective, with middle levels of testosterone associated with best cognitive functioning in the elderly 27, but studies in younger subjects have not shown correlation between testosterone levels and cognitive tasks 28. In this study of young individuals, gonadal hormones did not show any association with cognitive function independently of age and education.
There were two main study limitations. First, the cross-sectional nature of the data precluded inferring causality. Thus, we cannot ascertain whether relative cognitive dysfunction results in behaviors leading to weight gain, or whether obesity causes relative cognitive dysfunction. Second, there were small numbers overall in this exploratory study. We were likely underpowered to identify specific endocrine associations, albeit small, which in a larger sample, might be statistically significant after controlling for age and education. Effect sizes are provided in Supplementary Table 3 in order to facilitate power calculations for future studies. Further, our limited sample size precluded us from fully investigating the interactions among the hormones and body composition measures; future work with larger sample sizes should investigate these interactions to understand the relationships between these measures and cognitive functioning.
In summary, our exploratory analysis adds to an emerging understanding of the relationship between obesity and cognitive function, and suggests that BMI, body composition and possibly abnormalities in glucose and/or insulin homeostasis may contribute to decreased cognitive function, even in young, otherwise healthy, women. Further research is required to isolate the effects of individual hormones in the obesity milieu, from obesity itself. Additionally, longitudinal prospective studies are required to determine causality.
Supplementary Material
Acknowledgments
We thank the study participants for their participation in the study and the Clinical Research Staff for their contributions.
This research was supported by R01 HL-077674, K23 RR-23090 and UL1 RR-025758.
Footnotes
Disclosures
None of the manuscript authors have any conflicts of interest relative to this manuscript to declare.
References
- 1.Hedley AA, et al. Prevalence of overweight and obesity among US children, adolescents, and adults, 1999–2002. JAMA: the journal of the American Medical Association. 2004;291:2847–2850. doi: 10.1001/jama.291.23.2847. [DOI] [PubMed] [Google Scholar]
- 2.Schuur M, et al. Insulin-resistance and metabolic syndrome are related to executive function in women in a large family-based study. European journal of epidemiology. 2010;25:561–568. doi: 10.1007/s10654-010-9476-y. [DOI] [PMC free article] [PubMed] [Google Scholar]
- 3.Segura B, et al. Mental slowness and executive dysfunctions in patients with metabolic syndrome. Neuroscience letters. 2009;462:49–53. doi: 10.1016/j.neulet.2009.06.071. [DOI] [PubMed] [Google Scholar]
- 4.Hassenstab JJ, Sweat V, Bruehl H, Convit A. Metabolic syndrome is associated with learning and recall impairment in middle age. Dementia and geriatric cognitive disorders. 2010;29:356–362. doi: 10.1159/000296071. [DOI] [PMC free article] [PubMed] [Google Scholar]
- 5.Gunstad J, Lhotsky A, Wendell CR, Ferrucci L, Zonderman AB. Longitudinal examination of obesity and cognitive function: results from the Baltimore longitudinal study of aging. Neuroepidemiology. 2010;34:222–229. doi: 10.1159/000297742. [DOI] [PMC free article] [PubMed] [Google Scholar]
- 6.Gustafson D, Lissner L, Bengtsson C, Bjorkelund C, Skoog I. A 24-year follow-up of body mass index and cerebral atrophy. Neurology. 2004;63:1876–1881. doi: 10.1212/01.wnl.0000141850.47773.5f. [DOI] [PubMed] [Google Scholar]
- 7.Brooks SJ, et al. Late-life obesity is associated with smaller global and regional gray matter volumes: a voxel-based morphometric study. International journal of obesity. 2012 doi: 10.1038/ijo.2012.13. [DOI] [PMC free article] [PubMed] [Google Scholar]
- 8.Gunstad J, et al. Elevated body mass index is associated with executive dysfunction in otherwise healthy adults. Comprehensive psychiatry. 2007;48:57–61. doi: 10.1016/j.comppsych.2006.05.001. [DOI] [PubMed] [Google Scholar]
- 9.Boeka AG, Lokken KL. Neuropsychological performance of a clinical sample of extremely obese individuals. Archives of clinical neuropsychology: the official journal of the National Academy of Neuropsychologists. 2008;23:467–474. doi: 10.1016/j.acn.2008.03.003. [DOI] [PubMed] [Google Scholar]
- 10.Fergenbaum JH, et al. Obesity and lowered cognitive performance in a Canadian First Nations population. Obesity. 2009;17:1957–1963. doi: 10.1038/oby.2009.161. [DOI] [PubMed] [Google Scholar]
- 11.Etou H, et al. Characteristics of psychomotor performance and time cognition in moderately obese patients. Physiology & behavior. 1989;45:985–988. doi: 10.1016/0031-9384(89)90225-4. [DOI] [PubMed] [Google Scholar]
- 12.Lokken KL, Boeka AG, Yellumahanthi K, Wesley M, Clements RH. Cognitive performance of morbidly obese patients seeking bariatric surgery. The American surgeon. 2010;76:55–59. [PubMed] [Google Scholar]
- 13.Nilsson LG, Nilsson E. Overweight and cognition. Scandinavian journal of psychology. 2009;50:660–667. doi: 10.1111/j.1467-9450.2009.00777.x. [DOI] [PubMed] [Google Scholar]
- 14.Lokken KL, Boeka AG, Austin HM, Gunstad J, Harmon CM. Evidence of executive dysfunction in extremely obese adolescents: a pilot study. Surgery for obesity and related diseases: official journal of the American Society for Bariatric Surgery. 2009;5:547–552. doi: 10.1016/j.soard.2009.05.008. [DOI] [PubMed] [Google Scholar]
- 15.Cholerton B, Baker LD, Craft S. Insulin resistance and pathological brain ageing. Diabetic medicine: a journal of the British Diabetic Association. 2011 doi: 10.1111/j.1464-5491.2011.03464.x. [DOI] [PubMed] [Google Scholar]
- 16.Crichton GE, et al. Metabolic Syndrome, Cognitive Performance, and Dementia. Journal of Alzheimer’s disease: JAD. 2011 doi: 10.3233/JAD-2011-111022. [DOI] [PubMed] [Google Scholar]
- 17.Benedict C, et al. Impaired insulin sensitivity as indexed by the HOMA score is associated with deficits in verbal fluency and temporal lobe gray matter volume in the elderly. Diabetes care. 2012;35:488–494. doi: 10.2337/dc11-2075. [DOI] [PMC free article] [PubMed] [Google Scholar]
- 18.Gonzales MM, et al. Insulin sensitivity as a mediator of the relationship between BMI and working memory-related brain activation. Obesity. 2010;18:2131–2137. doi: 10.1038/oby.2010.183. [DOI] [PubMed] [Google Scholar]
- 19.Krug R, Benedict C, Born J, Hallschmid M. Comparable sensitivity of postmenopausal and young women to the effects of intranasal insulin on food intake and working memory. The Journal of clinical endocrinology and metabolism. 2010;95:E468–472. doi: 10.1210/jc.2010-0744. [DOI] [PubMed] [Google Scholar]
- 20.Gunnell D, Miller LL, Rogers I, Holly JM. Association of insulin-like growth factor I and insulin-like growth factor-binding protein-3 with intelligence quotient among 8- to 9-year-old children in the Avon Longitudinal Study of Parents and Children. Pediatrics. 2005;116:e681–686. doi: 10.1542/peds.2004-2390. [DOI] [PubMed] [Google Scholar]
- 21.Okereke O, et al. Plasma IGF-I levels and cognitive performance in older women. Neurobiology of aging. 2007;28:135–142. doi: 10.1016/j.neurobiolaging.2005.10.012. [DOI] [PubMed] [Google Scholar]
- 22.Arwert LI, Deijen JB, Drent ML. The relation between insulin-like growth factor I levels and cognition in healthy elderly: a meta-analysis. Growth hormone & IGF research: official journal of the Growth Hormone Research Society and the International IGF Research Society. 2005;15:416–422. doi: 10.1016/j.ghir.2005.09.001. [DOI] [PubMed] [Google Scholar]
- 23.Aleman A, Torres-Aleman I. Circulating insulin-like growth factor I and cognitive function: neuromodulation throughout the lifespan. Progress in neurobiology. 2009;89:256–265. doi: 10.1016/j.pneurobio.2009.07.008. [DOI] [PubMed] [Google Scholar]
- 24.Kamogawa K, et al. Abdominal fat, adipose-derived hormones and mild cognitive impairment: the J-SHIPP study. Dementia and geriatric cognitive disorders. 2010;30:432–439. doi: 10.1159/000321985. [DOI] [PubMed] [Google Scholar]
- 25.Gunstad J, et al. Serum leptin levels are associated with cognitive function in older adults. Brain research. 2008;1230:233–236. doi: 10.1016/j.brainres.2008.07.045. [DOI] [PubMed] [Google Scholar]
- 26.Dumas JA, Kutz AM, Naylor MR, Johnson JV, Newhouse PA. Increased memory load-related frontal activation after estradiol treatment in postmenopausal women. Hormones and behavior. 2010;58:929–935. doi: 10.1016/j.yhbeh.2010.09.003. [DOI] [PMC free article] [PubMed] [Google Scholar]
- 27.Holland J, Bandelow S, Hogervorst E. Testosterone levels and cognition in elderly men: A review. Maturitas. 2011;69:322–337. doi: 10.1016/j.maturitas.2011.05.012. [DOI] [PubMed] [Google Scholar]
- 28.Young LA, Neiss MB, Samuels MH, Roselli CE, Janowsky JS. Cognition is not modified by large but temporary changes in sex hormones in men. The Journal of clinical endocrinology and metabolism. 2010;95:280–288. doi: 10.1210/jc.2009-1346. [DOI] [PMC free article] [PubMed] [Google Scholar]
- 29.Annweiler C, et al. Dietary intake of vitamin D and cognition in older women: a large population-based study. Neurology. 2010;75:1810–1816. doi: 10.1212/WNL.0b013e3181fd6352. [DOI] [PubMed] [Google Scholar]
- 30.Bredella MA, et al. Effects of growth hormone in women with abdominal obesity: a 6-month randomized, double-blind, placebo-controlled trial. Eur J Endocrinol. 2012 doi: 10.1530/EJE-11-1068. [DOI] [PMC free article] [PubMed] [Google Scholar]
- 31.Strauss E, Sherman EMS, Spreen O. A Compendium of Neuropsychological Tests: Administration, Norms and Commentary. 3. Oxford University Press; 2006. [Google Scholar]
- 32.Miller KK, et al. Measurement of free testosterone in normal women and women with androgen deficiency: comparison of methods. The Journal of clinical endocrinology and metabolism. 2004;89:525–533. doi: 10.1210/jc.2003-030680. [DOI] [PubMed] [Google Scholar]
- 33.Hampson E. Variations in sex-related cognitive abilities across the menstrual cycle. Brain and cognition. 1990;14:26–43. doi: 10.1016/0278-2626(90)90058-v. [DOI] [PubMed] [Google Scholar]
- 34.Cereda E, Sansone V, Meola G, Malavazos AE. Increased visceral adipose tissue rather than BMI as a risk factor for dementia. Age and ageing. 2007;36:488–491. doi: 10.1093/ageing/afm096. [DOI] [PubMed] [Google Scholar]
- 35.Burns JM, Johnson DK, Watts A, Swerdlow RH, Brooks WM. Reduced lean mass in early Alzheimer disease and its association with brain atrophy. Archives of neurology. 2010;67:428–433. doi: 10.1001/archneurol.2010.38. [DOI] [PMC free article] [PubMed] [Google Scholar]
- 36.Porter DW, Irwin N, Flatt PR, Holscher C, Gault VA. Prolonged GIP receptor activation improves cognitive function, hippocampal synaptic plasticity and glucose homeostasis in high-fat fed mice. European journal of pharmacology. 2011;650:688–693. doi: 10.1016/j.ejphar.2010.10.059. [DOI] [PubMed] [Google Scholar]
- 37.Frisardi V, et al. Is insulin resistant brain state a central feature of the metabolic-cognitive syndrome? Journal of Alzheimer’s disease: JAD. 2010;21:57–63. doi: 10.3233/JAD-2010-100015. [DOI] [PubMed] [Google Scholar]
- 38.Sakata A, et al. Female exhibited severe cognitive impairment in type 2 diabetes mellitus mice. Life sciences. 2010;86:638–645. doi: 10.1016/j.lfs.2010.03.003. [DOI] [PubMed] [Google Scholar]
- 39.Holden KF, et al. Serum leptin level and cognition in the elderly: Findings from the Health ABC Study. Neurobiology of aging. 2009;30:1483–1489. doi: 10.1016/j.neurobiolaging.2007.11.024. [DOI] [PMC free article] [PubMed] [Google Scholar]
- 40.Tolppanen AM, Williams DM, Lawlor DA. The association of serum ionized calcium and vitamin D with adult cognitive performance. Epidemiology. 2011;22:113–117. doi: 10.1097/EDE.0b013e3181f74683. [DOI] [PMC free article] [PubMed] [Google Scholar]
Associated Data
This section collects any data citations, data availability statements, or supplementary materials included in this article.