

Abstract
Negative interactions with healthcare providers may lead patients to switch physicians or “doctor shop.” We hypothesized that overweight and obese patients would be more likely to doctor shop, and as a result, have increased rates of emergency department (ED) visits and hospitalizations as compared to normal weight non-shoppers. We combined claims data from a health plan in one state with information from beneficiaries’ health risk assessments. The primary outcome was “doctor shopping,” which we defined as having outpatient claims with ≥5 different primary care physicians (PCPs) during a 24-month period. The independent variable was standard NIH categories of weight by BMI. We performed multivariate logistic regression to evaluate the association between weight categories and doctor shopping. We conducted multivariate zero-inflated negative binominal regression to evaluate the association between weight-doctor shopping categories with counts of ED visits and hospitalizations. Of the 20,726 beneficiaries, the mean BMI was 26.3 kg/m2 (SD 5.1), mean age was 44.4 years (SD 11.1) and 53% were female. As compared to normal weight beneficiaries, overweight beneficiaries had 23% greater adjusted odds of doctor shopping (OR 1.23, 95%CI 1.04–1.46) and obese beneficiaries had 52% greater adjusted odds of doctor shopping (OR 1.52, 95%CI 1.26–1.82). As compared to normal weight non-shoppers, overweight and obese shoppers had higher rates of ED visits (IRR 1.85, 95%CI 1.37–2.45; IRR 1.83, 95%CI 1.34–2.50, respectively), which persisted during within weight group comparisons (Overweight IRR 1.50, 95%CI 1.10–2.03; Obese IRR 1.54, 95%CI 1.12–2.11). Frequently changing PCPs may impair continuity and result in increased healthcare utilization.
Introduction
Stereotyping of obese individuals has been associated with social, educational and employment discrimination (1–2). In addition to the negative attitudes found in the general population, bias towards obese patients has been documented among healthcare providers (3–5). Obese patients identify physicians as a primary source of stigma (6) and many report having had negative experiences with physicians (7).
Negative interactions with healthcare providers have been associated with switching providers or “doctor shopping” in general patient populations (8–10), adversely affecting continuity of care. Care continuity has been associated with decreased hospitalizations and emergency department visits, improved receipt of preventive services, and reduced healthcare costs (11–12). Therefore, patients who do not consistently see the same healthcare provider may experience reduced quality of care and increased costs.
Although studies have documented obese patients’ negative experiences with healthcare providers, no studies have examined the frequency of doctor shopping in this population. Available evidence from the qualitative literature supports the existence of doctor shopping among obese patients. In one focus group study, obese women reported seeking a healthcare provider who is comfortable, experienced and skilled in treating obese patients, and furthermore, doctor shopping until such an “obese friendly” provider was found (13).
The primary objective of this study was to examine the relationship between patient weight and doctor shopping for a primary care provider (PCP). We hypothesized that obese patients would have a greater number of outpatient visits to different PCPs than patients with a normal body mass index (BMI) within a 24-month period. Our secondary objective was to evaluate the relationship between doctor shopping and healthcare utilization by patient weight category. We hypothesized that obese patients who engaged in doctor shopping would have higher rates of hospitalizations and emergency department (ED) visits as compared to other BMI groups.
Methods
Data source
We used de-identified data from a large health plan in one state. Claims data from 2002–2005 were linked to information from either in-person or self-reported health risk assessments (HRA) that also occurred during 2002–2005. The claims data included enrollment, inpatient, outpatient, professional, and pharmacy claims records. The HRA data included height and body weight, which was either measured during an in-person preventive health screening or self-reported via a direct mail health risk survey to plan members. Of the 252,277 health plan members, 54,342 participated in the HRA (22%). The Johns Hopkins Bloomberg School of Public Health Institutional Review Board (IRB) classified this study as exempt from review.
Selection of study sample
The insured cohort who completed an HRA included 54,342 beneficiaries. We included members who reported both height and body weight in the HRA, were aged 20–64 years, and had at least 12 months of continuous coverage. We excluded beneficiaries who received care at a multi-specialty group, as we were unable to determine the specialty of the different physicians seen at those practices. We used the Johns Hopkins University Adjusted Clinical Groups (ACG) system (14–15) to identify and exclude any members who were pregnant or had a diagnosis of malignancy during the 24-month study period, given the likelihood of significant weight change with these conditions. We used the ACG system to identify and exclude members with a substance abuse diagnosis and we used pharmacy claims to identify and exclude members at risk of prescription drug abuse, defined as receiving 4 or more prescriptions for opiates, barbiturates or benzodiazepines in a 24-month period. We excluded these members as previous studies have found that patients with prescription drug or other substance use disorders are more likely to doctor shop (16–19). Finally, we excluded underweight beneficiaries (BMI<18.5 kg/m2), given a relatively small sample size.
Primary outcome
We defined our primary outcome of “doctor shopping” as seeing ≥5 different PCPs over a 24-month period, which was modeled after the definition from the substance use literature. This literature defines clinically significant doctor shopping when patients obtain prescriptions for controlled substances from ≥5 different physicians over a 12-month period (17–19). We modified this definition by using claims for initial outpatient visits and extending the time period from 12-months to 24-months, because our beneficiaries’ timeframe would likely differ from patients with substance abuse or addiction problems. Drug addiction results in a loss of control and need for drugs (16). As a result, patients with addiction are motivated to see many providers to obtain prescriptions for these drugs. In contrast, patients without addiction would likely doctor shop over a longer period, as seeking primary care is a controlled behavior. Even with the above modifications to the substance abuse literature’s definition of doctor shopping, we were concerned that our criteria of ≥5 different PCPs over a 24-month period may be conservative given national shortages of PCPs (20). Therefore, we created a liberal definition of doctor shopping as seeking care from ≥3 different PCPs in a 24-month period.
To evaluate doctor shopping, we identified primary care physicians by linking the individual physician numbers with specialty type, which were both assigned by the health plan. We defined PCPs if they were any one of the following specialties: general practice, family practice, pediatrics, internal medicine, medicine-pediatrics, geriatrics, or adolescent medicine. We used Current Procedural Terminology (CPT) codes to identify outpatient initial visits: 99201–99205, 99385–99387 or 90000–90020. We distinguished visits to urgent care centers by linking these CPT codes with the place of service code for urgent care or urgent care S codes (S9088 or S9083). Because beneficiaries who were enrolled prior to 2002 may already have had an established PCP, we labeled the first primary care provider visit associated with an outpatient established visit CPT code (99212–99215, 99395–99397, or 90030–90080) as the first provider in their count of unique PCPs seen. Thereafter, we identified a change in providers only when these beneficiaries had a claim for an initial outpatient visit from a different physician.
Independent variable and covariates
The independent variable of interest was category of weight, which was derived from BMI calculated from height and body weight from the HRA. Weight was categorized per NIH definitions as follows: normal range (18.5–24.9 kg/m2), overweight (25.0–29.9 kg/m2), and obese (≥30 kg/m2) (21). Additional patient covariates of interest included: age, gender, and HRA survey year. We identified new health plan members as those beneficiaries who joined the plan after 2002, as we suspected that doctor shopping might vary between old and new health plan members. We also identified co-morbid disease severity and mental health diagnosis using the Johns Hopkins University Adjusted Clinical Groups (ACG) system (http://www.acg.jhsph.org/). The ACG system creates a case-mix classification score that enables adjustment for overall morbidity burden for each individual beneficiary (14–15). We used these ACG scores to adjust for co-morbid disease severity over the 24-month period. The ACG system also groups subsets of similar diagnosis codes into Expanded Diagnosis Clusters (EDCs). We used the three mental health EDCs to identify beneficiaries with any mental health diagnoses in the 24-month period. This variable was dichotomized as absence or presence of any mental health diagnosis. We adjusted for mental health diagnosis as it has been previously associated with doctor shopping (22).
Primary analysis using conservative definition of doctor shopping
We conducted descriptive analyses of all variables. We compared differences in beneficiary characteristics by weight category using Pearson’s χ2 for categorical variables and adjusted Wald tests for continuous variables. We compared differences in beneficiary characteristics between shoppers and non-shoppers using Pearson’s χ2 for categorical variables and t-tests for continuous variables. To evaluate the association between beneficiary weight and doctor shopping, we used multivariate logistic regression analyses adjusting for patient age, gender, survey year, mental health diagnosis, and co-morbid disease severity. We conducted all analyses with Stata 11/IC (College Station, TX).
Secondary analyses using conservative definition of doctor shopping
Our secondary outcomes were healthcare services utilization, which included counts of hospitalizations over a 24-month period and counts of ED visits over a 24-month period. Hospitalizations were identified by the following CPT codes: 99221–99223, 99218–99220, 99234–99236, and 90200–90220. ED visits were identified by the following CPT codes: 99281–99285, 90500–90510. We cross-tabulated the weight and doctor shopping categories to create our independent variable in the following categorizations: normal weight-non-shoppers, normal weight-shoppers, overweight-non-shoppers, overweight-shoppers, obese-non-shoppers, and obese-shoppers. We designated normal weight-non-shoppers as the reference group.
To evaluate the association between healthcare service utilization and doctor shopping by weight, we used multivariate zero-inflated negative binominal regression analyses adjusting for patient age, gender, survey year, mental health diagnosis, and co-morbid disease severity. We selected this model due to overdispersion of variance and excessive number of zero responses in the count data for both healthcare utilization variables (23). Finally, to evaluate whether the healthcare utilization was attributable to doctor shopping rather than weight, we used multivariate zero-inflated negative binominal regression analyses to compare differences in rates of healthcare service utilization between shoppers and non-shoppers of the same body weight category (e.g. overweight non-shoppers vs. overweight shoppers, and obese non-shoppers vs. obese shoppers). These regression models were adjusted for all the same covariates listed above. We also performed a subgroup analysis examining these utilization outcomes in two groups at higher risk of hospitalization: older patients (age 50–64) and diabetics.
Sensitivity analyses using liberal definition of doctor shopping
Using our liberal definition of doctor shopping, we compared differences in beneficiary characteristics between shoppers and non-shoppers using Pearson’s χ2 for categorical variables and t-tests for continuous variables. We repeated our primary analysis with our liberal definition of doctor shopping using the same logistic regression model and covariates. With our liberal definition, we also repeated our secondary analysis evaluating the association between healthcare service utilization and doctor shopping by using multivariate zero-inflated negative binominal regression adjusted for the same covariates.
Results
Figure 1 illustrates how we created our final study sample, which included 20,726 health plan members. In the study sample, the mean BMI was 26.3 kg/m2 (SD 5.1), mean age was 44.4 years (SD 11.1), and 53% were women. The majority of beneficiaries were enrolled prior to or during 2002 (96%). Table 1 displays differences in beneficiary characteristics by weight category. Obese beneficiaries were older, more commonly male, and had greater co-morbid disease severity as compared to normal weight beneficiaries. Overall, 4% of beneficiaries met our conservative criteria for doctor shopping (n=792). Per the conservative definition, doctor shoppers saw a median of 5 PCPs over 24 months (IQR 4–6), while non-shoppers saw a median of 2 PCPs over 24 months (IQR 1–3). Few outpatient visits occurred in an urgent care center (n=15).
Figure 1.
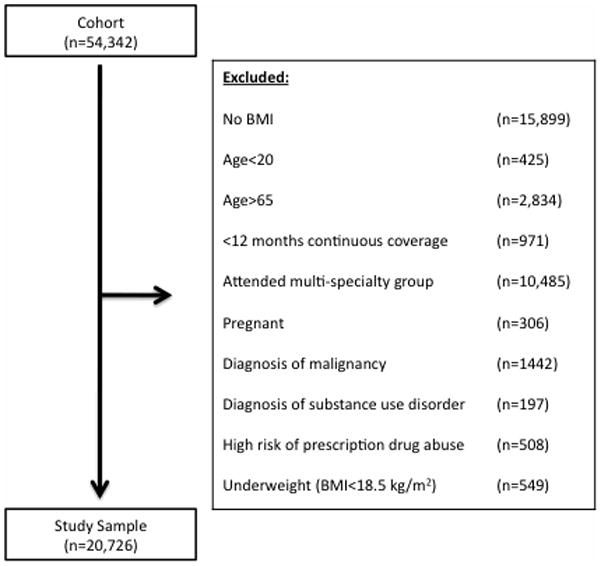
Illustration of how the study sampled was selected from the entire cohort.
Table 1.
Beneficiary characteristics by weight category
| Normal Weight | Overweight | Obese | p-valuea | |
|---|---|---|---|---|
| BMI 18.5–24.9 kg/m2 (n=9,488) | BMI 25–29.9 kg/m2 (n=7,322) | BMI ≥ 30 kg/m2 (n=3,916) | ||
| Mean Age (SD) | 43.8 (11.5) | 45.4 (10.7) | 44.1 (10.8) | <0.01 |
|
| ||||
| % Female | 66% | 39% | 46% | <0.01 |
|
| ||||
| % Scoring top 5% in comorbid disease severity b | 2% | 3% | 5% | <0.01 |
|
| ||||
| % Mental health diagnosis c | 22% | 20% | 24% | <0.01 |
|
| ||||
| % Diabetes mellitus diagnosis d | 3% | 8% | 15% | <0.01 |
|
| ||||
| Mean number PCPs visited (SD) | 1.74 | 1.89 | 2.05 | <0.01 |
|
| ||||
| % New health plan members e | 5% | 3% | 4% | <0.01 |
|
| ||||
| % Doctor shoppers by conservative definition f | 3% | 4% | 5% | <0.01 |
|
| ||||
| % Doctor shoppers by liberal definition g | 21% | 23% | 28% | <0.01 |
Calculated using Pearson’s χ2 tests for categorical variables and Wald tests for continuous variables.
Comorbid disease severity calculated using ACG case-mix classification.
Mental health diagnosis determined using EDC tool in ACG system to identify claims for any mental health diagnosis in the 24-month period.
Diabetes mellitus diagnosis determined using EDC tool in the ACG system to identify claims for any diagnosis of diabetes mellitus in the 24-month period.
New health plan members defined as beneficiaries who joined that plan after 2002.
Doctor shoppers defined as ≥5 different primary care providers seen for new patient visit in 24-month period.
Doctor shoppers defined as ≥3 different primary care providers seen for new patient visit in 24-month period.
Table 2 compares the characteristics of shoppers to non-shoppers. In general, shoppers were more commonly female, had greater BMI, had greater co-morbid disease severity, and more commonly had a mental health diagnosis. More non-shoppers were new members to the health plan; however, the overall prevalence of new health plan members in our cohort was low (4%).
Table 2.
Comparison of characteristics between shoppers and non-shoppers
| Conservative Definition | |||
|---|---|---|---|
| Shoppers | Non-Shoppers | p-value a | |
| ≥5 different PCPs in 24 months (n=792) | <5 different PCPs in 24 months (n=19,013) | ||
| Mean age (SD) | 44.1 (10.9) | 44.4 (11.1) | 0.35 |
|
| |||
| % Female | 65% | 52% | <0.01 |
|
| |||
| Mean BMI (SD) | 27.2 (5.7) | 26.3 (5.0) | <0.01 |
|
| |||
| % Scoring top 5% in comorbid disease severity b | 9% | 3% | <0.01 |
|
| |||
| % Mental health diagnosis c | 42% | 21% | <0.01 |
|
| |||
| % Diabetes mellitus diagnosis d | 12% | 7% | <0.01 |
|
| |||
| % New health plan members e | 0% | 4% | <0.01 |
|
| |||
| Liberal Definition | |||
| Shoppers | Non-Shoppers | p-value a | |
| ≥3 different PCPs in 24 months (n=4,816) | <3 different PCPs in 24 months (n=14,989) | ||
|
| |||
| Mean age (SD) | 44.8 (10.9) | 44.3 (11.2) | 0.01 |
|
| |||
| % Female | 58% | 51% | <0.01 |
|
| |||
| Mean BMI (SD) | 26.8 | 26.1 | <0.01 |
|
| |||
| % Scoring top 5% in comorbid disease severity b | 5% | 2% | <0.01 |
|
| |||
| % Mental health diagnosis c | 33% | 18% | <0.01 |
|
| |||
| % Diabetes mellitus diagnosis d | 9% | 6% | <0.01 |
|
| |||
| % New health plan members e | 0.1% | 5% | <0.01 |
Calculated using Pearson’s χ2 tests for categorical and t-tests for continuous variables.
Comorbid disease severity calculated using ACG case-mix classification.
Mental health diagnosis determined using EDC tool in ACG system to identify claims for any mental health diagnosis in the 24-month period.
Diabetes mellitus diagnosis determined using EDC tool in the ACG system to identify claims for any diagnosis of diabetes mellitus in the 24-month period.
New health plan members defined as beneficiaries who joined that plan after 2002.
Primary analysis results using conservative definition of doctor shopping
We found that the unadjusted odds of doctor shopping were 7% greater for overweight [OR 1.07, 95%CI 0.90–1.25, p=0.44] and 52% greater for obese beneficiaries [OR 1.52, 95%CI 1.27–1.82, p<0.01] as compared to those of normal weight. After adjustment, we found that the odds of doctor shopping increased by 23% for overweight [AOR 1.23, 95%CI 1.04–1.46, p=0.02] and 52% for obese beneficiaries as compared to those of normal weight [AOR 1.52, 95%CI 1.26–1.82, p<0.01].
Secondary analyses using conservative definition of doctor shopping
Our secondary analyses evaluated the association between healthcare utilization and doctor shopping by weight category. Over a 24-month period, all beneficiaries had a median of 0 ED visits (range 0–9 visits) and 0 hospitalizations (range 0–4 admissions). Tables 3 and 4 show the differences in emergency department visits and hospitalizations, respectively, by weight-doctor shopping categories in comparison to a normal weight, non-shopper reference group. We found that overweight [IRR 1.85, 95%CI 1.37–2.45, p<0.01] and obese shoppers [IRR 1.83, 95%CI 1.34–2.50, p<0.01] had significantly greater adjusted incidence of ED visits as compared to normal weight non-shoppers. In addition, we found that overweight [IRR 1.72, 95%CI 0.82–3.62, p=0.15] and obese shoppers [IRR 1.92, 95%CI 0.93–3.96, p=0.08] had greater adjusted incidence of hospitalizations as compared to normal weight non-shoppers, although not statistically significant.
Table 3.
Rate of emergency department visits over a 24-month period by weight-doctor shopping categories
| n | IRR a | 95% CI | p-value | |
|---|---|---|---|---|
| Conservative Definitionb | ||||
|
| ||||
| Normal weight non-shoppers | 9,163 | 1.00 | -- | -- |
| Overweight non-shoppers | 7,055 | 1.23 | 1.09–1.38 | <0.01 |
| Obese non-shoppers | 3,716 | 1.26 | 1.10–1.44 | <0.01 |
| Normal weight shoppers | 325 | 1.67 | 1.25–2.22 | <0.01 |
| Overweight shoppers | 267 | 1.85 | 1.37–2.45 | <0.01 |
| Obese shoppers | 200 | 1.83 | 1.34–2.50 | <0.01 |
|
| ||||
| Liberal Definition c | ||||
|
| ||||
| Normal weight non-shoppers | 6,997 | 1.00 | -- | -- |
| Overweight non-shoppers | 5,303 | 1.30 | 1.12–1.50 | <0.01 |
| Obese non-shoppers | 2,689 | 1.38 | 1.17–1.63 | <0.01 |
| Normal weight shoppers | 2,027 | 1.61 | 1.37–1.90 | <0.01 |
| Overweight shoppers | 1,702 | 1.73 | 1.46–2.05 | <0.01 |
| Obese shoppers | 1,087 | 1.68 | 1.39–2.03 | <0.01 |
IRR = incidence rate ratio.
Zero-inflated negative binominal regression model adjusted for age, sex, survey year, mental health diagnosis, and co-morbidity disease severity.
Doctor shopping defined as seeking care from ≥5 primary care physicians in a 24-month period.
Doctor shopping defined as seeking care from ≥3 primary care physicians in a 24-month period.
Table 4.
Rate of hospitalizations over a 24-month period by weight-doctor shopping categories
| n | IRR a | 95% CI | p-value | |
|---|---|---|---|---|
| Conservative Definitionb | ||||
|
| ||||
| Normal weight non-shoppers | 9,163 | 1.00 | -- | -- |
| Overweight non-shoppers | 7,055 | 1.28 | 0.92–1.78 | 0.15 |
| Obese non-shoppers | 3,716 | 1.13 | 0.78–1.64 | 0.52 |
| Normal weight shoppers | 325 | 1.18 | 0.49–2.81 | 0.72 |
| Overweight shoppers | 267 | 1.72 | 0.82–3.62 | 0.15 |
| Obese shoppers | 200 | 1.92 | 0.93–3.96 | 0.08 |
|
| ||||
| Liberal Definitionc | ||||
|
| ||||
| Normal weight non-shoppers | 6,997 | 1.00 | -- | -- |
| Overweight non-shoppers | 5,303 | 1.15 | 0.77–1.71 | 0.50 |
| Obese non-shoppers | 2,689 | 1.16 | 0.75–1.80 | 0.50 |
| Normal weight shoppers | 2,027 | 0.98 | 0.60–1.60 | 0.92 |
| Overweight shoppers | 1,702 | 1.55 | 1.00–2.40 | 0.05 |
| Obese shoppers | 1,087 | 1.21 | 0.74–2.00 | 0.45 |
IRR = incidence rate ratio.
Zero-inflated negative binominal regression model adjusted for age, sex, survey year, mental health diagnosis, and co-morbidity disease severity.
Doctor shopping defined as seeking care from ≥5 primary care physicians in a 24-month period.
Doctor shopping defined as seeking care from ≥3 primary care physicians in a 24-month period.
We observed a significantly greater incidence of ED visits [IRR 1.50, 95%CI 1.10–2.03, p=0.01] and hospitalizations [IRR 1.38, 95%CI 0.68–2.81, p=0.37] in overweight shoppers compared to overweight non-shoppers, although the incidence of hospitalizations did not reach statistical significance. We observed a significantly greater incidence of ED visits [IRR 1.54, 95%CI 1.12–2.11, p=0.01] and hospitalizations [IRR 1.73, 95%CI 0.78–3.84, p=0.18] in obese shoppers compared to obese non-shoppers, although the incidence of hospitalizations did not reach statistical significance. We also observed a significantly greater incidence of ED visits [IRR 1.64, 95%CI 1.24–2.18, p<0.01] in normal weight shoppers compared to normal weight non-shoppers, but the incidence of hospitalizations [IRR 1.19, 95%CI 0.49–2.87, p=0.70] did not reach statistical significance.
In a subgroup analysis of older patients, the findings with respect to utilization were similar to the entire cohort (Supplementary Table 1). Our sample size among diabetic patients was small, especially among normal weight diabetic shoppers, overweight diabetic shoppers, and obese diabetic shoppers (n=19, 31, and 44, respectively). We did not proceed with additional analyses in this subgroup due to the limited power, as our confidence in any inferences made from these results would be low.
Sensitivity analyses using liberal definition of doctor shopping
Our liberal definition of doctor shopping was defined as seeking care from ≥3 different PCPs over a 24-month period. Using this definition, 23% of beneficiaries met our criteria for doctor shopping (n=4,816). Table 2 displays the characteristics of these shoppers and non-shoppers. The differences between these two groups were similar, irrespective of the definition used. Similar to the results in our primary analysis, we found that the adjusted odds of doctor shopping increased by 19% for overweight [AOR 1.19, 95%CI 1.10–1.28, p<0.01] and 37% for obese beneficiaries as compared to those of normal weight [AOR 1.37, 95%CI 1.26–1.50, p<0.01]. We found that overweight [IRR 1.73, 95%CI 1.46–2.05, p<0.01] and obese shoppers [IRR 1.68, 95%CI 1.39–2.03, p<0.01] had significantly greater adjusted incidence of ED visits as compared to normal weight non-shoppers (Table 3). There were no significant differences in rates of hospitalization between any weight-doctor shopping categories using this definition (Table 4).
Discussion
We found that overweight and obese beneficiaries had more visits with different PCPs over a 24-month period than those of normal weight, irrespective of whether we used the conservative or liberal definitions of doctor shopping. While the overall prevalence of doctor shopping using our conservative definition was only 4%, this behavior was relatively common when using our liberal definition (23%) suggesting that a substantial number of overweight and obese patients engage in doctor shopping and lack care continuity. Overweight and obese members who engaged in doctor shopping had significantly more ED visits as compared to normal weight members who did not doctor shop. These findings persisted when using the liberal definition of doctor shopping. We also found that these overweight and obese doctor shoppers had more hospitalizations; however, these differences were not statistically significant. The association between increased ED utilization for overweight and obese doctor shoppers persisted even when we compared the rates of these services among beneficiaries of the same body weight category. Previous studies have shown that continuity of care has been associated with decreased hospitalizations, ED visits, and healthcare costs (11–12, 24). Our results add to this literature as they demonstrate that a lack of care continuity is associated with increased healthcare utilization, especially ED visits.
In general populations, patients tend to doctor shop when they are dissatisfied with care (8–10). While we are unable to assess beneficiaries’ motivations for switching providers in our study, this doctor shopping could be a result of negative interactions with healthcare providers or staff given the extensive literature documenting weight bias in the medical field (3–5). In a prior study, obese women identified several factors that negatively impacted their quality of care including negative provider attitudes, disparaging comments by providers or office staff, unsolicited weight loss advice, and improperly sized medical equipment and office furniture (13). These same women also suggested several strategies to improve their quality of care including having a positive self-image, being assertive and proactive during office visits, as well as shopping around and interviewing providers (13). Patients may benefit from doctor shopping in this scenario, as we hope that they would find providers that better meet their needs. In prior studies, positive patient-physician relationships have been associated with increased patient activation and improved medication adherence (26–27). Therefore, some degree of doctor shopping may be acceptable, especially if this behavior enables all patients to experience the benefits of a positive relationship with their provider.
We found that doctor shopping was associated with increased healthcare utilization specifically increased ED visits, and the magnitude of effect was greater for overweight and obese shoppers as compared normal weight shoppers. In general populations, continuity of care with a PCP has been associated with reduced healthcare utilization and reduced healthcare costs (24). Another study found that patients who engaged in doctor shopping during periods of acute illness incurred significantly greater costs than non-shoppers, which was due to higher medication charges and doctors’ fees (25). We did not examine whether doctor shopping led to increased healthcare costs in our study. However, since we found an association between ED utilization and doctor shopping, it is possible that overweight and obese doctor shoppers would also have increased costs. Future studies should evaluate whether doctor shopping by these patients truly leads to increased healthcare costs. If doctor shopping is found to be associated with both higher healthcare utilization and higher costs, then this behavior could be targeted for intervention.
While we need to better understand the phenomenon of doctor shopping and its implications with respect to healthcare utilization and costs, novel care systems such as the patient-centered medical home (PCMH) may be uniquely suited to improve the care patterns of overweight and obese patients. The most commonly used definitions of PCMH emphasize continuity of care with a primary care provider (28–29). Patients enrolled in PCMH have significantly decreased their utilization of outpatient, inpatient and emergency department care along with associated decreases in costs (30–31).
By changing providers, overweight and obese doctor shoppers may also be negatively affected in other domains such as preventive care services. The evidence is mixed regarding disparities in preventive services for patients with obesity. While previous research has found associations between obesity and decreased rates of breast, cervical and colorectal cancer screenings(13, 32–34), a recent study examining quality of care process-based measures found no differences in rates of cancer screening (35). Continuity of care with the same PCP has previously been associated with increased receipt of preventive services (36). In contrast, overweight and obese shoppers may then be less likely to receive referrals for cancer screening due to the lack of care continuity with a PCP. If future studies confirm this hypothesis, perhaps these prior studies’ conflicting results could be partially explained by differential rates of doctor shopping in the populations examined. Additional research is needed to evaluate the extent to which doctor shopping influences whether overweight and obese patients receive timely preventive services.
This study has several limitations. First, our results are based on a cohort of insured patients from a large health plan in one state, and therefore, may not generalize to an uninsured population or beneficiaries in other health plans. There may be differences in doctor shopping based on plan type (e.g. PPO or HMO) or based on geographic location, as some areas have more physicians than others. In addition, the patients in our cohort elected to participate in an HRA. Patients who participate in an HRA are not necessarily representative of insured patients in general. Previous studies have found that HRA responders are younger and healthier than non-responders, and may be more likely to file health claims and incur greater healthcare costs (37–38). Second, we were unable to account for some potential factors such as race, socioeconomic status and total duration of membership in the health plan, as they were not available in our data. It is unclear whether these variables have an effect on doctor shopping, as no previous studies have reported rates of doctor shopping by these variables. We wanted doctor shopping to capture patients switching PCPs, rather than visiting urgent care centers. We found that use of urgent care codes was very low in our data. These findings likely reflect the lack of local urgent care facilities available to beneficiaries during the study period, rather than misclassification of urgent care visits as outpatient or ED visits due to physicians’ billing practices. We may have still misclassified some urgent care visits as PCP switches, although we suspect this to be low. Third, some beneficiaries self-reported their height and body weight. Self-reported of these measures is biased, yet reasonably accurate (39). For example, weight is under-reported and height over-reported. Fourth, the overall rate of hospitalizations in our sample was low, and may have limited our ability to detect significant differences in hospitalizations. Finally, we relied on physician identification numbers and specialty designation by the health plan to differentiate unique PCPs. We were unable to use Unique Physician Identification Numbers (UPIN) to identify physicians, as they were not available in our data. However, the median number of unique providers in our study was the same as the median number of providers reported in a different study that used UPIN (40). Despite this reassurance, we may have misclassified some providers as PCPs who may have been sub-specialists.
Despite these limitations, this is the first study to examine whether overweight and obese patients are more likely to doctor shop, and furthermore, link doctor shopping with differences in important aspects of healthcare utilization for these patients. Since doctor shopping influences ED visits and may influence hospitalizations, these results suggest that doctor shopping may be an important target for improving quality of care. Additional studies are needed to characterize patients’ motivation for doctor shopping, in order to develop effective, tailored interventions to reduce this behavior and its subsequent outcomes. For example, future interventions could target health plan beneficiaries to educate them on the benefits of continuity of care and assist them in finding and maintaining a relationship with a single primary care physician. Interventions targeting doctor-shopping behavior could decrease inappropriate use of high cost services such as ED visits and hospitalizations.
Supplementary Material
Acknowledgments
KAG was supported by a training grant from the Health Resources and Service Administration (T32HP10025-16-00). SNB was supported by a grant from the National Heart, Lung, and Blood Institute (1K01HL096409). KAG and TMR had full access to study data and take responsibility for the accuracy of the analysis.
Initial development of this data source was funded by in-kind support from the Blue Cross and Blue Shield association as well as seven Blue Cross and Blue Shield plans. For this analysis, we used data from one of these health plans. We shared preliminary results with this plan and included them in drafting the manuscript. They did not have a direct role in study design, data management, or analysis. We thank the Blue Cross and Blue Shield plans and their staff members. In addition, unrestricted research grants from Ethicon Endo-Surgery, Inc, Pfizer, Inc, and GlaxoSmithKline were also provided to help fund the initial database development. None of these entities had a direct role in study design, data management, or analysis.
Footnotes
Description of Supplementary Information
Supplementary Material is available at www.nature.com/obesity. Supplementary Table 1 displays the results of the subgroup analysis among older patients.
Disclosure
The authors declare no conflicts of interest.
References
- 1.Puhl R, Brownell KD. Bias, discrimination, and obesity. Obes Res. 2001;9:788–805. doi: 10.1038/oby.2001.108. [DOI] [PubMed] [Google Scholar]
- 2.Puhl RM, Heuer CA. The stigma of obesity: a review and update. Obesity (Silver Spring) 2009;17:941–964. doi: 10.1038/oby.2008.636. [DOI] [PubMed] [Google Scholar]
- 3.Teachman BA, Brownell KD. Implicit anti-fat bias among health professionals: is anyone immune? Int J Obes Relat Metab Disord. 2001;25:1525–1531. doi: 10.1038/sj.ijo.0801745. [DOI] [PubMed] [Google Scholar]
- 4.Schwartz MB, Chambliss HO, Brownell KD, Blair SN, Billington C. Weight bias among health professionals specializing in obesity. Obes Res. 2003;11:1033–1039. doi: 10.1038/oby.2003.142. [DOI] [PubMed] [Google Scholar]
- 5.Huizinga MM, Cooper LA, Bleich SN, Clark JM, Beach MC. Physician respect for patients with obesity. J Gen Intern Med. 2009;24:1236–1239. doi: 10.1007/s11606-009-1104-8. [DOI] [PMC free article] [PubMed] [Google Scholar]
- 6.Puhl RM, Brownell KD. Confronting and coping with weight stigma: an investigation of overweight and obese adults. Obesity (Silver Spring) 2006;14:1802–1815. doi: 10.1038/oby.2006.208. [DOI] [PubMed] [Google Scholar]
- 7.Wadden TA, Anderson DA, Foster GD, Bennett A, Steinberg C, Sarwer DB. Obese women’s perceptions of their physicians’ weight management attitudes and practices. Arch Fam Med. 2000;9:854–860. doi: 10.1001/archfami.9.9.854. [DOI] [PubMed] [Google Scholar]
- 8.Kasteler J, Kane RL, Olsen DM, Thetford C. Issues underlying prevalence of ‘doctor-shopping’ behavior. J Health Soc Behav. 1976;17:329–39. [PubMed] [Google Scholar]
- 9.Gray PG, Cartwright A. Choosing and changing doctors. Lancet. 1953;265:1308–1309. doi: 10.1016/s0140-6736(53)91377-4. [DOI] [PubMed] [Google Scholar]
- 10.Marquis MS, Davies AR, Ware JE. Patient satisfaction and change in medical care provider: a longitudinal study. Med Care. 1983;21:821–829. doi: 10.1097/00005650-198308000-00006. [DOI] [PubMed] [Google Scholar]
- 11.Cabana MD, Jee SH. Does continuity of care improve patient outcomes? J Fam Pract. 2004;53:974–80. [PubMed] [Google Scholar]
- 12.Saultz JW, Lochner J. Interpersonal continuity of care and care outcomes: a critical review. Ann Fam Med. 2005;3:159–66. doi: 10.1370/afm.285. [DOI] [PMC free article] [PubMed] [Google Scholar]
- 13.Amy NK, Aalborg A, Lyons P, Keranen L. Barriers to routine gynecological cancer screening for White and African-American obese women. Int J Obes (Lond) 2006;30:147–155. doi: 10.1038/sj.ijo.0803105. [DOI] [PubMed] [Google Scholar]
- 14.Starfield B, Weiner J, Mumford L, Steinwachs D. Ambulatory care groups: a categorization of diagnoses for research and management. Health Serv Res. 1991;26:53–74. [PMC free article] [PubMed] [Google Scholar]
- 15.Weiner JP, Starfield BH, Steinwachs DM, Mumford LM. Development and application of a population-oriented measure of ambulatory care case-mix. Med Care. 1991;29:452–472. doi: 10.1097/00005650-199105000-00006. [DOI] [PubMed] [Google Scholar]
- 16.Longo LP, Parran T, Jr, Johnson B, Kinsey W. Addiction: part II. Identification and management of the drug-seeking patient. Am Fam Physician. 2000;61:2401–8. [PubMed] [Google Scholar]
- 17.Hall AJ, Logan JE, Toblin RL, et al. Patterns of abuse among unintentional pharmaceutical overdose fatalities. JAMA. 2008;300:2613–2620. doi: 10.1001/jama.2008.802. [DOI] [PubMed] [Google Scholar]
- 18.Parente ST, Kim SS, Finch MD, et al. Identifying controlled substance patterns of utilization requiring evaluation using administrative claims data. Am J Manag Care. 2004;10:783–90. [PubMed] [Google Scholar]
- 19.Wilsey BL, Fishman SM, Gilson AM, et al. An analysis of the number of multiple prescribers for opioids utilizing data from the California Prescription Monitoring Program. Pharmacoepidemiol Drug Saf. 2011;20:1262–8. doi: 10.1002/pds.2129. [DOI] [PMC free article] [PubMed] [Google Scholar]
- 20.Brotherton SE, Rockey PH, Etzel SI. US graduate medical education, 2004–2005: trends in primary care specialties. JAMA. 2005;294:1075–82. doi: 10.1001/jama.294.9.1075. [DOI] [PubMed] [Google Scholar]
- 21.NHLBI Obesity education initiative expert panel. Clinical guidelines on the identification, evaluation, and treatment of overweight and obesity in adults: the evidence report. [accessed October 24, 2011];NIH publication No 98-4083. 1998 Sep; http://www.nhlbi.nih.gov/guidelines/obesity/ob_gdlns.pdf.
- 22.Norton J, de Roquefeuil G, David M, Boulenger JP, Ritchie K, Mann A. The mental health of doctor-shoppers: Experience from a patient-led fee-for-service primary care setting. J Affect Disord. 2011;131:428–32. doi: 10.1016/j.jad.2010.12.009. [DOI] [PubMed] [Google Scholar]
- 23.Annotated Stata output: zero-inflated negative binominal regression. UCLA: Academic Technology Services, Statistical Consulting Group; [accessed October 24, 2011]. From http://www.ats.ucla.edu/stat/stata/output/Stata_ZINB.htm. [Google Scholar]
- 24.Raddish M, Horn SD, Sharkey PD. Continuity of care: is it cost effective? Am J Manag Care. 1999;5:727–34. [PubMed] [Google Scholar]
- 25.Wang MJ, Lin SP. Study on doctor shopping behavior: insight from patients with upper respiratory tract infection in Taiwan. HealthPolicy. 2010;94:61–7. doi: 10.1016/j.healthpol.2009.08.009. [DOI] [PubMed] [Google Scholar]
- 26.Alexander JA, Hearld LR, Mittler JN, Harvey J. Patient-physician role relationships and patient activation among individuals with chronic illness. Health Serv Res. 2012;47:1201–23. doi: 10.1111/j.1475-6773.2011.01354.x. [DOI] [PMC free article] [PubMed] [Google Scholar]
- 27.Kerse N, Buetwo S, Mainous AG, Young G, Coster G, Arroll B. Physician-patient relationship and medication compliance: a primary care investigation. Ann Fam Med. 2004;2:455–61. doi: 10.1370/afm.139. [DOI] [PMC free article] [PubMed] [Google Scholar]
- 28.National Committee for Quality Assurance. Standards and Guidelines for Physician Practice Connections Patient Centered Medical Home(PPC-PCMH) Washington, DC: National Committee for Quality Assurance; 2008. [Google Scholar]
- 29.Beal AC, Doty MM, Hernandez SE, et al. Closing the Divide: How Medical Homes Promote Equity in Health Care: Results From The Commonwealth Fund 2006 Health Care Quality Survey. NewYork, NY: The Commonwealth Fund; 2007. [Google Scholar]
- 30.Fontaine P, Flottemesch TJ, Solberg LI, Asche SE. Is consistent primary care within a patient-centered medical home related to utilization patterns and costs? J Ambul Care Manage. 2011;34:10–9. doi: 10.1097/JAC.0b013e3181ff7019. [DOI] [PubMed] [Google Scholar]
- 31.Reid RJ, Coleman K, Johnson EA, et al. The group health medical home at year two: cost savings, higher patient satisfaction, and less burnout for providers. Health Aff (Millwood) 2010;29:835–43. doi: 10.1377/hlthaff.2010.0158. [DOI] [PubMed] [Google Scholar]
- 32.Heo M, Allison DB, Fontaine KR. Overweight, obesity, and colorectal cancer screening: disparity beween men and women. BMC Public Health. 2004;4:53. doi: 10.1186/1471-2458-4-53. [DOI] [PMC free article] [PubMed] [Google Scholar]
- 33.Maruthur NM, Bolen S, Brancati FL, Clark JM. Obesity and mammography: a systematic review and meta-analysis. J Gen Intern Med. 2009;24:665–77. doi: 10.1007/s11606-009-0939-3. [DOI] [PMC free article] [PubMed] [Google Scholar]
- 34.Maruthur NM, Bolen SD, Brancati FL, Clark JM. The association of obesity and cervical cancer screening: a systematic review and meta-analysis. Obesity (Silver Spring) 2009;17:375–81. doi: 10.1038/oby.2008.480. [DOI] [PMC free article] [PubMed] [Google Scholar]
- 35.Chang VW, Asch DA, Werner RM. Quality of care among obese patients. JAMA. 2010;303:1274–81. doi: 10.1001/jama.2010.339. [DOI] [PubMed] [Google Scholar]
- 36.Ferrante JM, Balasubramanian BA, Hudson SV, Crabtree BF. Principles of the patient-centered medical home and preventive services delivery. Ann Fam Med. 2010;8:108–16. doi: 10.1370/afm.1080. [DOI] [PMC free article] [PubMed] [Google Scholar]
- 37.Lynch WD, Golaszewski TJ, Clearie A, Vickery DM. Characteristics of self-selected responders to a health risk appraisal: generalizability of corporate health assessments. Am J Public Health. 1989;79:887–8. doi: 10.2105/ajph.79.7.887. [DOI] [PMC free article] [PubMed] [Google Scholar]
- 38.Lynch WD, Gilfillan LA, Jennett C, McGloin J. Health risks and health insurances claims costs. Results for health hazard appraisal responders and nonresponders. J Occup Med. 1993;35:28–33. [PubMed] [Google Scholar]
- 39.Gorber SC, Tremblay M, Moher D, Gorber B. A comparison of direct vs. self-report measures for assessing height, weight and body mass index: a systematic review. Obes Rev. 2007;8:307–326. doi: 10.1111/j.1467-789X.2007.00347.x. [DOI] [PubMed] [Google Scholar]
- 40.Pham HH, Schrag D, O’Malley AS, Wu B, Bach PB. Care patterns in Medicare and their implications for pay for performance. N Engl J Med. 2007;356:1130–9. doi: 10.1056/NEJMsa063979. [DOI] [PubMed] [Google Scholar]
Associated Data
This section collects any data citations, data availability statements, or supplementary materials included in this article.