

Abstract
Introduction
Fibrinogen is a key component of the blood coagulation system and plays important, diverse roles in several relevant pathologies such as thrombosis, hemorrhage, and cancer. It is a large glycoprotein whose three-dimensional molecular structure is not fully known. Furthermore, circulating fibrinogen is highly heterogeneous, mainly due to proteolytic degradation and alternative mRNA processing. Recombinant production of human fibrinogen allows investigating the impact on the three-dimensional structure of specific changes in the primary structure.
Methods
We performed analytical ultracentrifugation analyses of a full-length recombinant human fibrinogen, its counterpart purified from human plasma, and a recombinant human fibrinogen with both Aα chains truncated at amino acid 251, thus missing their last 359 amino acid residues.
Results
We have accurately determined the translational diffusion and sedimentation coefficients (, ) of all three species. This was confirmed by derived molecular weights within 1% for the full length species, and 5% for the truncated species, as assessed by comparison with SDS-PAGE/Western blot analyses and primary structure data. No significant differences in the values of and were found between the recombinant and purified full length human fibrinogens, while slightly lower and higher values, respectively, resulted for the recombinant truncated human fibrinogen compared to a previously characterized purified human fibrinogen fragment X obtained by plasmin digestion.
Conclusions
Full-length recombinant fibrinogen is less polydisperse but hydrodynamically indistinguishable from its counterpart purified from human plasma. Recombinant Aα251-truncated human fibrinogen instead behaves differently from fragment X, suggesting a role for the Bβ residues 1–52 in inter-molecular interactions. Overall, these new hydrodynamic data will constitute a reliable benchmark against which models of fibrinogen species could be compared.
Keywords: Recombinant Fibrinogen, Blood Coagulation, Analytical Ultracentrifugation, Hydrodynamics
INTRODUCTION
Fibrinogen (FG) is a high molecular weight (~340,000), very elongated (length ~45 nm) plasma glycoprotein playing a central role in the blood coagulation system of vertebrates. FG is also implicated in various pathologies like thrombosis, hemorrhage, and cancer [1–3]. In plasma, FG is a heterogeneous mixture of several variants that differ mainly in primary amino acid structure. At the basic level, all variants are composed of two pairs each of three different chains (Aα, Bβ and γ) whose N-termini reside in a central globular domain (“E” region), from which they symmetrically depart forming two triple coiled-coil connectors held in register by two “disulfide rings” [4–7]. At the end of each connector, after the second disulfide ring, the Bβ and γ chains C-terminals fold separately forming two outer globular domains (“D” regions), while the Aα chains revert their direction forming a fourth coiled helix at least up to residue Aα200 and Aα219 in the human and chicken species, respectively, as determined by X-ray crystallography [7–9]. The structure and location of the remaining 411 C-terminal residues (human numbering) of the Aα chains (AαC regions) is still undetermined, and has been alternatively proposed to behave as a free-swimming appendage [4, 8–9], or to form a fourth globular domain on top of the E region [10–14]. Only a small portion of the bovine species C-terminus (corresponding to residues Aα425–502 in the human species) has been proved to be at least partially structured by NMR and other biophysical methods [15–18]. An additional unique feature of the AαC regions is the presence among species of a variable number (e.g., eleven in the human, none in the chicken) of 13-amino acids repeats [19–21], located between the end of the fourth coiled helix and the partially structured region. Furthermore, the AαC region is also highly susceptible to proteolytic degradation (in 25 % of the plasma FG the C-terminus of the Aα chain is degraded on one side of the molecule, and in 5% both Aα chains are degraded), which, coupled with other post-transcriptional and post-translational modifications like partial AαSer3 and other Ser/Thr residues phosphorylation [22], renders circulating FG highly polydisperse [23]. The N-terminal 16 and 14 amino acid residues of the Aα and Bβ chains, respectively, are cleaved off by thrombin during FG enzymatic activation yielding fibrin monomer (α2β2γ2) [1,2]. The released peptides are known as fibrinopeptides A and B, respectively (FpA and FpB).
Hydrodynamic parameters, such as the infinite-dilution translational diffusion and sedimentation coefficients ( and ), can be effectively used in multi-resolution modeling of biomacromolecules, helping to discriminate between alternative conformations (e.g., [24]; see also [25]). In a previous publication, we have reported the hydrodynamic and mass spectrometric characterization of a highly purified, nearly intact human plasma FG fraction (hpHMW-FG), of a controlled plasmin proteolysis human FG product lacking the AαC regions, termed fragment X (hpFrX-FG), and of chicken plasma FG (cpFG) [26]. We present here the results of new analytical ultracentrifugation sedimentation velocity (AUC-SV) experiments on a similar hpHMW-FG preparation, and on two human FG recombinant species, full-length (hrHMW-FG, from the commercial source ProFibrix), and with the Aα chain truncated after residue 251 (hrα251-FG, prepared in our laboratories). We were able to determine and accurately, and complemented them with Aα chain polydispersity and Fp content analyses. Together these results establish benchmark data that are a reliable basis for further structural analyses of human natural and recombinant fibrinogen species.
MATERIALS AND METHODS
General
All chemicals were reagent grade from Merck (VWR International, Milano, Italy; http://www.merck-chemicals.com/) or from Sigma-Aldrich (St. Louis, MO; http://www.sigmaaldrich.com/united-states.html), unless otherwise stated, and double-distilled water was used in the preparation of all the solutions. DU640 and DU800 spectrophotometers (Beckman Coulter, Fullerton, CA; http://www.beckmancoulter.com) were used for all spectrophotometric operations. Quality control and characterization of the samples by polyacrylamide (PAA) gel electrophoresis in the presence of sodium dodecyl sulphate (SDS–PAGE) and Western blotting, followed by densitometric analyses, was done as previously extensively reported [26].
Human plasma high molecular weight fibrinogen purification
hpHMW-FG was purified by (NH4)2SO4 fractional precipitation from lyophilized human fibrinogen (hFG; plasminogen depleted, type FIB1 from Enzyme Research Laboratories, South Bend, IN; http://www.enzymeresearch.com/), after reconstitution and dialysis into an appropriate buffer, as previously described in detail [26].
Human recombinant high molecular weight fibrinogen preparation and purification
hrHMW-PG was obtained from ProFibrix, Leiden, The Netherlands (http://www.profibrix.com/), and was prepared and purified as previously described [27].
Human recombinant Aα251 truncated fibrinogen preparation and purification
Media with recombinant hrα251-FG, having intact Bβ and γ chains and the Aα chain truncated after residue 251 [28], were purchased from the National Cell Culture Center (Biovest International, Minneapolis, MN, USA; http://www.biovest.com/) and purified by salt precipitation and immunoaffinity chromatography using the calcium-dependent FG-specific monoclonal antibody IF-1 (Kamiya Biomedical, Seattle, WA, USA; http://www.kamiyabiomedical.com/) as described [29,30].
Briefly, hrα251-FG was precipitated from the medium overnight at 4 °C with 33% saturated (NH4)2SO4. After centrifugation, the pellet was dissolved in loading buffer (Tris (tris(hydroxymethyl)aminomethane) 20 mM, NaCl 0.3 M, pH 7.4) with 10 mM CaCl2 and loaded onto the pre-equilibrated IF-1 column. After washing steps with Tris 20 mM, NaCl 1 M, CaCl2 10 mM, pH 7.4, and CH3COONa 50 mM, NaCl 0.3 M, CaCl2 10 mM, pH 6.0, hrα251-FG was eluted with Tris 20 mM, NaCl 0.3 M, EDTA-Na2 5 mM, pH 7.4, dialyzed once against loading buffer with 1 mM CaCl2 and then twice against Tris Buffered Saline (TBS; Tris 50 mM, NaCl 104 mM, aprotinin 10 KIU/ml, pH 7.4). Several batches were purified. Each was tested by SDS-PAGE under reducing and non reducing conditions. Subsequently, Western blotting was performed using rabbit polyclonal antibodies to human FG (Dako Corp, code N A0080, Carpinteria, CA; http://www.dako.com/) and the monoclonal antibody Y18 (a gift from Dr. Nieuwenhuizen, Leiden, The Netherlands) specific for the N-terminus of the Aα-chain [31]. All batches were found to be > 97% clottable.
Different hrα251-FG batches were pooled together, concentrated by ultrafiltration (Amicon Ultra-15, MWCO 100, Millipore, Billerica, MA; http://www.millipore.com) to 10 mg/ml (concentration above which hrα251-FG tends to precipitate), added with 1 mM AESBF (4-(2-aminoethyl) benzenesulfonyl fluoride hydrochloride, Sigma–Aldrich) and stored at −80 °C until use.
Fibrinopeptides analysis
Fibrinopeptides release and analysis by RP-HPLC was done essentially as previously reported [32], with some modifications. In short, 140 μL of reaction mixture contained FG species at 0.5 mg/ml and thrombin (Sigma-Aldrich) at 0.25 nominal NIH units/ml in TBS. After 2 h of incubation at 25 °C, the reaction was stopped by immersion in boiling water for 1 min, followed by centrifugation at 16,000g for 15 min. The supernatant was filtered on polyethylene sulfone 0.45 μm pore-size filters (Millipore) and 40 μL were injected on a 1.0 × 150 mm, 300 Å pore size, 3.5 μm particle size Symmetry 300 C18 column, protected by a Symmetry 300 C18 2.1 × 10 mm pre-column (Waters Corp., Milford, MA, USA; http://www.waters.com). The HPLC set-up consisted of an Agilent 1200 series system, equipped with G1379B degasser, G1376A capillary pump, G1377A micro autosampler, G1316A thermostatted column holder, and G1315B diode array detector. It was equilibrated in 97% 25 mM CH3COONH4, brought to pH 6 with diluted H3PO4 (buffer A), and 3% 50 mM CH3COONH4, brought to pH 6 with diluted H3PO4 and then diluted 1:1 with CH3CN (buffer B). CH3COONH4 was from Fluka (Sigma-Aldrich) and CH3CN was LiChroSolv from Merck. The flow rate was 50 μl/min, and the elution was performed in this sequence: isocratic 97% A - 3% B for 8 min, then three linear gradients, the first in 5 min to 12% B, the second in 45 min to 27% B, and the third in 6 min to 100% B, and finally maintained at 100% B for 5 min. The elution was monitored at 211 nm, and the columns were thermostatted at 30 °C.
Analytical Ultracentrifugation
AUC-SV experiments were performed using a Beckman Coulter (Palo Alto, CA, USA) Optima XLI Analytical Ultracentrifuge. In each experiment, sample solutions (400 μl) of various concentrations (~0.1–1.6 mg/ml) and TBS buffer (410 μl) were loaded into the sample and reference channels, respectively, of seven double sector, 12 mm optical pathlength Epon centerpiece cells. After loading, the samples were spun for a few minutes at 3000 rpm to check for leaks and to record an absorbance scan (200–340 nm) used to calculate the actual sample concentration in each cell. Samples were then centrifuged at 40,000 rpm at a constant temperature of 20.0 °C. Concentration profiles and the movement of the sedimenting boundary in the AUC cell were recorded using the Rayleigh interference optical system. AUC-SV data were analyzed by continuous size distribution analysis c(s) using Sedfit 12.0 [33] (available at http://www.analyticalultracentrifugation.com). All the c(s) distributions were calculated with a fitted frictional ratio f/f0 and a maximum entropy regularization procedure with a confidence level of 0.68. All the diffusion values were calculated from the fitted sedimentation coefficient and frictional ratio, as well as the deduced molecular mass from these parameters. Standard deviation on fitted f/f0 measurement was calculated using confidence interval search in Sedphat 10.40 [33]. Theory is described in previously published work [26].
RESULTS AND DISCUSSION
The molecular characterization and quality control of the samples are illustrated in Figs. 1–3. In Fig. 1, panels A and B, SDS-PAGE analyses of non reduced and reduced samples, respectively, of hpHMW-FG, hrHMW-FG, and hrα251-FG are shown. As can be seen, mainly single bands are visible in the non reduced samples, with a slight trace of higher molecular weight species only in hpHMW-FG. As for the reduced samples, hrHMW-FG has a single top band, corresponding to the Aα chain, while hpHMW-FG shows the characteristic doublet indicating a certain degree of size polydispersity. In the hrα251-FG samples, the Aα chain is the last visible band migrating just above the 31 kD marker. The Bβ and γ chains appear to be indistinguishable in all samples. Since the major source of polydispersity resides in the Aα chain, with C-terminal degradation products that can migrate together with the Bβ and γ chains, Western blot analyses using the Y-18 mAb specific for the N-terminal end of the Aα chain [31] was done. The results are shown in Fig. 1, panel C, where the lesser amount of C-terminally degraded Aα chains in the hrHMW-FG sample compared to hpHMW-FG samples is already evident in the two leftmost lanes (both were loaded with roughly the same total amount of protein). This is confirmed by the densitometric analyses shown in Fig. 2, where the better homogeneity of the hrHMW-FG sample (panel A) in respect to the hpHMW-FG sample (panel B) can be fully appreciated. Note that, due to the absence of the doublet in the hrHMW-FG sample, the densitometry was performed on a lane loaded with half the total amount of the other lanes (rightmost lane in Fig. 1, panel C), to avoid saturation of the main band.
Figure 1.
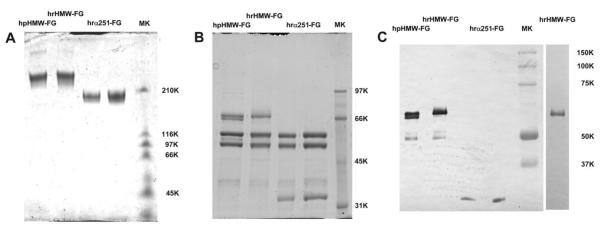
SDS-PAGE and Western blot analyses of the hrα251-FG, hrHMW-FG, and hpHMW-FG samples. Panel A, non-reduced samples (3.75 μg/lane) run on a 3.2% PAA/8.5 M urea gel, stained with Coomassie blue (due to the non-reducing conditions of the samples, the molecular weight markers are just indicative). Panel B, reduced samples (7.5 μg/lane) run on a 7.5% PAA gel, stained with Coomassie blue. Panel C, Western blot of the samples in panel B (0.5 μg/lane) stained with the Y-18 mAb (pre-stained molecular weight markers on the rightmost lane); the additional lane on the right side was loaded with 0.25 μg of hrHMW-FG.
Figure 3.

RP-HPLC analysis of fibrinopeptide content of hrα251-FG (panel A), hrHMW-FG (panel B), and hpHMW-FG (panel C). The various Fps peaks are identified in panel C (FpAP, phosphorylated FpA; FpAY, FpA lacking the N-terminal Ala residue; desArgB, FpB lacking the C-terminal Arg residue; FpBY2, FpB lacking the N-terminal pyroGlu and Gly residues; N→D, deamidated forms of all FpBs; the first “peak” in panel A is a spurious signal not corresponding to any Fp species).
Figure 2.

Densitometry traces of the mAb Y18-stained Western blots of hrHMW-FG (panel A; rightmost lane of Fig. 1, panel C) and hpHMW-FG (panel B; leftmost lane of Fig. 1, panel C). In both panels the y-axis data were vertically shifted by subtracting a baseline value (no rescaling was applied). The x-axis values of the panel B data where horizontally shifted to find the best alignment between the main peaks in both panels. The corresponding deconvolution results are shown in panels C and D, respectively. The color coding relates the resulting EMG-GMG peaks to the data in Table 1: black, original curve; red, reconstructed curve; blue, peak 1; green, peak 2; magenta, peak 3; grey, peak 4; cyan, peak 5; orange, peak 6; wine, peak 7; violet, peak 8; pink, peak 9.
The densitometry traces were then deconvolved using the EMG-GMG (exponentially modified Gaussian plus half-Gaussian modified Gaussian) chromatography function available in PeakFit v.4 (Jandel Scientific, now distributed by Systat Software Inc., Richmond, CA; http://www.sigmaplot.com/) [26], with a quadratic or a non-parametric baseline to account for the non-uniform background and avoid overestimation of the smaller peaks areas (tolerance ~1%). Typical results are shown in Fig. 2, panels C and D, but given the relatively minor effect of the smaller peaks on global computer parameters (see below), a rigorous quantization using multiple gels at different loading ratios was not attempted. For the traces examined, although many solutions could fit them almost equally well, a consensus emerged in which the main peak in hrHMW-FG (Fig. 2, panel C) derives from the contribution of a relatively small front component (blue), two main components (green and magenta, with a predominance of the slower migrating one), plus a very small trailing component (gray). The corresponding analysis for hpHMW-FG showed that the main twin peaks have a reduced amount or even lacked the front component (a small bump is observed in a compatible position), while the main components included also the small trailing component seen in hrHMW-FG, all three now in similar proportions (Fig. 2, panel D; see also Table 1). By comparison with the results of mass-spectrometry and SDS-PAGE/Western blot analyses on similar FG samples previously carried out in our labs [26,34], we could assign the two main peaks in hrHMW-FG and hpHMW-FG to Aα1-610 and Aα1-601, while the very small trailing peak in hrHMW-FG, becoming the third main peak in hpHMW-FG, is likely Aα1-583. As for the front component in hrHMW-FG, it could correspond to the 66,942 mass that we previously found in small amounts when analyzing hpHMW-FG [26], and in both cases it might represent a mixture of the Aα1-610 O-glycosylated forms (plus phosphorylated serines in hpHMW-FG, see below) recently shown to represent 1–13% of human plasma FG [35]. Its near absence in the current hpHMW-FG preparation likely results from purification variability. The other peaks corresponding to C-terminally degraded forms of Aα chains where found to be positioned at the same locations in both samples, and were assigned, again by comparison with our previous results and for hrHMW-FG with densitometry of lanes loaded with more material (data not shown), to Aα chains species down to Aα1-424. The final results of these analyses are reported in Table 1, together with the molecular masses, extinction coefficients (E280) and partial specific volumes (v̄) calculated from the composition of the polypeptides using PROMOLP [36]. No densitometric analyses were conducted on the hrα251-FG sample, as a single Aα chain band was evident. Note that the computed values for the hrHMW-FG and hpHMW-FG Aα chain species differ slightly because, as will be shown next, the hrHMW-FG apparently completely lacks the phosphorylation on the FpA which is normally present in ~20% of the chains [37]. Note also that the Aα chain C-terminally degraded species are likely to be overestimated due to non-linearity effects in the Western blots staining, and for the confounding effect of baseline noise on the smaller peaks. With these considerations in mind, and assuming totally undegraded Bβ and γ chains, we report the global molecular parameters computed for our three FG species in Table 2.
Table 1.
Identification of the Aα-chain species in hrHMW-FG and hpHMW-FG, their calculated molecular parameters, and relative % abundances derived from the densitometric analysis of Western blots.
| Peak # | Tentative identification | Mass from composition | E280 (ml mg−1 cm−1) |
|
Relative % (from gels)a | |
|---|---|---|---|---|---|---|
|
| ||||||
| hrHMW-FG | ||||||
|
| ||||||
| 1 | Aα1-610 (O-Gly) | 66,751 | 1.03 | 0.710 | 3.5 | |
| 2 | Aα1-610 | 66,094 | 1.04 | 0.711 | 68.7 | |
| 3 | Aα1-601 | 65,105 | 1.06 | 0.711 | 21.1 | |
| 4 | Aα1-583 | 63,250 | 1.09 | 0.712 | 0.8 | |
| 5 | Aα1-554 | 60,022 | 1.07 | 0.713 | 0.7 | |
| 6 | Aα1-528 | 57,281 | 1.12 | 0.713 | 1.7 | |
| 7 | Aα1-508 | 55,033 | 1.17 | 0.713 | 1.2 | |
| 8 | Aα-461 | 50,111 | 1.28 | 0.713 | 1.9 | |
| 9 | Aα1-424 | 46,223 | 1.39 | 0.712 | 0.5 | |
|
| ||||||
| hpHMW-FG | ||||||
|
| ||||||
| 1 | Aα1-610 (O-Gly) | 66,782 | 1.03 | 0.710 | 0.7 | |
| 2 | Aα1-610 | 66,125 | 1.04 | 0.711 | 28.8 | |
| 3 | Aα1-601 | 65,137 | 1.06 | 0.711 | 29.3 | |
| 4 | Aα1-583 | 63,282 | 1.09 | 0.712 | 23.8 | |
| 5 | Aα1-554 | 60,054 | 1.07 | 0.713 | 1.2 | |
| 6 | Aα1-528 | 57,313 | 1.12 | 0.713 | 0.5 | |
| 7 | Aα1-508 | 55,065 | 1.17 | 0.713 | 3.5 | |
| 8 | Aα1-461 | 50,143 | 1.28 | 0.713 | 11.2 | |
| 9 | Aα1-424 | 46,255 | 1.39 | 0.712 | 1.0 | |
The amounts for peaks below ~2% should be considered just as an estimate.
Table 2.
Calculated molecular properties of the hrα251-FG, hrHMW-FG, and hpHMW-FG species.
| Species | Molecular weight (g mol−1) |
|
E280 (ml mg−1 cm−1) | |
|---|---|---|---|---|
|
| ||||
| hrα251-FG | 264,410a | 0.720a | 1.60a | |
| hrHMW-FG | 336,694 | 0.715 | 1.53 | |
| hpHMW-FG | 331,683 | 0.715 | 1.55 | |
Values derived from the theoretical composition only.
To further characterize our samples, we have studied the thrombin-induced fibrinopeptides release. The results are shown in Fig. 3, with the peaks identified in panel C. Very similar elution patterns were observed for hrα251-FG (panel A), hrHMW-FG (panel B), and hpHMW-FG (panel C), with the two main forms present in the expected amounts. However, some relevant differences were found in both the degraded and post-translational modified forms of FpA, such as the absence of the FpAY form lacking the N-terminal alanine residue in both the recombinant proteins, and of the phosphorylated FpAP form in the hrHMW-FG sample alone. Instead, the degraded (desArgB lacking the C-terminal arginine residue, FpBY2 lacking the N-terminal pyroglutamic acid and glycine residues) and deamidated (N→D) forms of FpB [32] appears to be present in similar amounts in all species. While the absence of FpAP in hrHMW-FG could be due to the particular expression system used [27], the lack of FpAY in both recombinant species is likely due to in vivo processes of potential physiological significance [37].
The results of the sedimentation velocity analyses are globally reported in Fig. 4 as concentration-dependence plots of 1/s(20,w) (panel A) and (1 + ksc) × Dt(20,w) (panel B), respectively, and the derived values are reported in Table 3. As can be seen in Fig. 4, most of the samples yielded very good results, as indicated by the relatively small error bars; only the Dt(20,w) data for hrα251-FG had greater uncertainties. The 1/s(20,w) vs. c plots of hrHMW-FG and hpHMW-FG are practically superimposable, while a slight difference is noticeable in the (1 + ksc) × Dt(20,w) vs. c plots for the same two species. The extrapolated and are thus very similar for hrHMW-FG and hpHMW-FG (Table 3), and in excellent agreement with literature values for unfractionated FG [5, 38–41]. As a result, the weight-average molecular weights <M>w computed from the and values via the Svedberg equation using the calculated of Table 2, are also in excellent agreement (within 1%) with those computed from the putative composition of the hrHMW-FG and hpHMW-FG samples. As for hrα251-FG, the and values are ~4% higher and ~12% lower, respectively, than those we previously found for hpFrX-FG [26]. Comparing the new data with literature values for fragment X, the value matches well [42], while the value is lower [43]. The slopes of the 1/s(20,w) vs. c plots are also very similar for all the three species, leading to apparent sedimentation concentration dependence “Grálen” coefficients ks of the same magnitude. The positive ks value for hrα251-FG is in contrast with the slight negative value we previously found for hpFrX-FG [26], and could reflect different thermodynamic behaviors of the two species. Furthermore, practically identical negative values for the second virial coefficient term BM1 were derived from the (1 + ksc) × Dt(20,w) vs. c plots for hrHMW-FG and hpHMW-FG, indicating preferential interaction between the macromolecules, while only a very slight concentration dependence was apparent for hrα251-FG, again in contrast with what we reported for hpFrX-FG [26]. In any case, we preferred to average all the individual Dt(20,w) values to estimate for this species. The resulting <M>w for hrα251-FG is ~5% higher than the one calculated from its putative composition, which is still satisfactory, given the uncertainty in the value.
Figure 4.

Concentration-dependence plots of the reciprocal of the sedimentation coefficients (panel A) and of the diffusion coefficients (panel B) derived from the SedFit analysis of sedimentation velocity runs for hrα251-FG (open squares), hpHMW-FG (open circles), and hrHMW-FG (open triangles). The straight lines are their respective weighted linear regressions (dashed, hpHMW-FG).
Table 3.
Parameters derived from the analysis of the sedimentation velocity data.
| Sample |
|
|
r 2 |
|
BM1 (ml g−1) | r 2 | <M>w (% diff)a (g mol−1) | |||
|---|---|---|---|---|---|---|---|---|---|---|
|
| ||||||||||
| hrα251-FG | 7.09 ± 0.02 | 15.6 ± 4.9 | 0.6685 | 2.21 ± 0.05b | ~0 | NA | 277,976 ± 6,287 (+5.1%) | |||
|
| ||||||||||
| hrHMW-FG | 7.89 ± 0.02 | 13.3 ± 3.7 | 0.7228 | 1.98 ± 0.02 | −92.7 ± −8.1 | 0.9705 | 339,164 ± 3,737 (+0.7%) | |||
|
| ||||||||||
| hpHMW-FG | 7.84 ± 0.02 | 7.9 ± 5.1 | 0.3206 | 2.00 ± 0.01 | −84.1 ± −10.0 | 0.9342 | 333,346 ± 1,032 (+0.5%) | |||
In conclusion, we have accurately determined the sedimentation and diffusion coefficients of a well-characterized full length, intact recombinant human fibrinogen, and of its counterpart purified from human plasma. No significant differences were found between the recombinant and the plasma derived HMW-FGs, indicating a substantial overall structural identity between the two samples. In addition, the recombinant full-length fibrinogen had a better sample homogeneity. All these findings further confirm the suitability of recombinant full-length fibrinogen species for structural studies, and they are of relevance for their potential biotechnological/biomedical applications. We also determined the hydrodynamic parameters for a recombinant fibrinogen with a truncated Aα chain (hrα251-FG) and compared them with those of hpFrX-FG [26]. Although less accurately determined, the observed differences in the and ks values could stem from differences at the molecular level, like the lack of both Bβ 1–52 segments in hpFrX-FG. This suggests a role for these regions in FG-FG inter-molecular interactions. In any case, given the difficulties in obtaining complete atomic-level structures of fibrinogen, these new hydrodynamic data will constitute a reliable benchmark against which multi-resolution models could be compared.
ACKNOWLEDGEMENTS
We thank J. Koopman (ProFibrix, The Netherlands) for reviewing the manuscript. Work partially supported by a grant from MIUR, Italy (PRIN 2008HAFF7X), and by NIH grant HL031048 (to S.T.L.).
Abbreviations
- FG
fibrinogen
- FpA
fibrinopeptide A
- FpB
fibrinopeptide B
- AUC-SV
analytical ultracentrifugation sedimentation velocity
- hpHMW-FG
human plasma high molecular weight FG
- hpFrX-FG
human plasma FG fragment X
- cpFG
chicken plasma FG
- hrHMW-FG
human recombinant high molecular weight FG
- hrα251-FG
human recombinant FG with Aα chains truncated after residue 251
Footnotes
Publisher's Disclaimer: This is a PDF file of an unedited manuscript that has been accepted for publication. As a service to our customers we are providing this early version of the manuscript. The manuscript will undergo copyediting, typesetting, and review of the resulting proof before it is published in its final citable form. Please note that during the production process errors may be discovered which could affect the content, and all legal disclaimers that apply to the journal pertain.
Conflict of interest: J. Grimbergen and S.T. Lord have a financial interest in ProFibrix BV. The other authors state that they have no conflict of interest.
REFERENCES
- [1].Doolittle RF. The molecular biology of fibrin. In: Stamatoyannopoulos G, Majerus PW, Perlmutter RM, Varmus H, editors. The Molecular Basis of Blood Diseases. third ed. Saunders; Philadelphia: 2000. pp. 719–39. [Google Scholar]
- [2].Blombäck B. Fibrinogen and fibrin--proteins with complex roles in hemostasis and thrombosis. Thromb Res. 1996;83:1–75. doi: 10.1016/0049-3848(96)00111-9. [DOI] [PubMed] [Google Scholar]
- [3].Boccaccio C, Medico E. Cancer and blood coagulation. Cell Mol Life Sci. 2006;63:1024–27. doi: 10.1007/s00018-005-5570-9. [DOI] [PMC free article] [PubMed] [Google Scholar]
- [4].Doolittle RF. Fibrinogen and fibrin. Annu Rev Biochem. 1984;53:195–229. doi: 10.1146/annurev.bi.53.070184.001211. [DOI] [PubMed] [Google Scholar]
- [5].Weisel JW. Fibrinogen and fibrin. Adv Protein Chem. 2005;70:247–99. doi: 10.1016/S0065-3233(05)70008-5. [DOI] [PubMed] [Google Scholar]
- [6].Doolittle RF, Goldbaum DM, Doolittle LR. Designation of sequences involved in the “coiled-coil” interdomainal connections in fibrinogen: constructions of an atomic scale model. J Mol Biol. 1978;120:311–25. doi: 10.1016/0022-2836(78)90070-0. [DOI] [PubMed] [Google Scholar]
- [7].Spraggon G, Everse SJ, Doolittle RF. Crystal structures of fragment D from human fibrinogen and its crosslinked counterpart from fibrin. Nature. 1997;389:455–62. doi: 10.1038/38947. [DOI] [PubMed] [Google Scholar]
- [8].Yang Z, Kollman JM, Pandi L, Doolittle RF. Crystal structure of native chicken fibrinogen at 2.7 Å resolution. Biochemistry. 2001;40:12515–23. doi: 10.1021/bi011394p. [DOI] [PubMed] [Google Scholar]
- [9].Kollman JM, Pandi L, Sawaya MR, Riley M, Doolittle RF. Crystal structure of human fibrinogen. Biochemistry. 2009;48:3877–86. doi: 10.1021/bi802205g. [DOI] [PubMed] [Google Scholar]
- [10].Mosesson MW, Hainfeld J, Wall J, Haschemeyer RH. Identification and mass analysis of human fibrinogen molecules and their domains by scanning transmission electron microscopy. J Mol Biol. 1981;153:695–718. doi: 10.1016/0022-2836(81)90414-9. [DOI] [PubMed] [Google Scholar]
- [11].Medved' LV, Gorkun OV, Privalov PL. Structural organization of C-terminal parts of fibrinogen Aα-chains. FEBS Lett. 1983;160:291–95. doi: 10.1016/0014-5793(83)80985-5. [DOI] [PubMed] [Google Scholar]
- [12].Erickson HP, Fowler WE. Electron microscopy of fibrinogen, its plasmic fragments and small polymers. In: Mosesson MW, Doolittle RF, editors. Molecular Biology of Fibrinogen and Fibrin. vol. 408. Annals of the New York Academy of Sciences; New York: 1983. pp. 146–63. New York Academy of Sciences. [DOI] [PubMed] [Google Scholar]
- [13].Weisel JW, Stauffacher CV, Bullit TE, Cohen C. A model for fibrinogen: domains and sequence. Science. 1985;230:1388–91. doi: 10.1126/science.4071058. [DOI] [PubMed] [Google Scholar]
- [14].Litvinov RI, Yakovlev S, Tsurupa G, Gorkun OV, Medved L, Weisel JW. Direct evidence for specific interactions of the fibrinogen αC-domains with the central E region and with each other. Biochemistry. 2007;46:9133–42. doi: 10.1021/bi700944j. [DOI] [PMC free article] [PubMed] [Google Scholar]
- [15].Tsurupa G, Tsonev L, Medved L. Structural organization of the fibrin(ogen) αC-domain. Biochemistry. 2002;41:6449–59. doi: 10.1021/bi025584r. [DOI] [PubMed] [Google Scholar]
- [16].Burton RA, Tsurupa G, Medved L, Tjandra N. Identification of an ordered compact structure within the recombinant bovine fibrinogen αC-domain fragment by NMR. Biochemistry. 2006;45:2257–66. doi: 10.1021/bi052380c. [DOI] [PMC free article] [PubMed] [Google Scholar]
- [17].Burton RA, Tsurupa G, Hantgan RR, Tjandra N, Medved L. NMR solution structure, stability, and interaction of the recombinant bovine fibrinogen αC-domain fragment. Biochemistry. 2007;46:8550–60. doi: 10.1021/bi700606v. [DOI] [PMC free article] [PubMed] [Google Scholar]
- [18].Tsurupa G, Hantgan RR, Burton RA, Pechik I, Tjandra N, Medved L. Structure, stability, and interaction of the fibrin(ogen) αC-domains. Biochemistry. 2009;48:12191–201. doi: 10.1021/bi901640e. [DOI] [PMC free article] [PubMed] [Google Scholar]
- [19].Doolittle RF, Watt KWK, Cottrell BA, Strong DD, Riley M. The amino acid sequence of the α-chain of human fibrinogen. Nature. 1979;280:464–8. doi: 10.1038/280464a0. [DOI] [PubMed] [Google Scholar]
- [20].Henschen A, Lottspeich F, Kehl M, Southan C. Covalent structure of fibrinogen. In: Mosesson MW, Doolittle RF, editors. Molecular Biology of Fibrinogen and Fibrin. vol. 408. Annals of the New York Academy of Sciences; New York: 1983. pp. 28–43. New York Academy of Sciences. [DOI] [PubMed] [Google Scholar]
- [21].Weissbach L, Grieninger G. Bipartite mRNA for chicken α-fibrinogen potentially encodes an amino acid sequence homologous to β- and γ-fibrinogens. Proc Natl Acad Sci USA. 1990;87:5198–202. doi: 10.1073/pnas.87.13.5198. [DOI] [PMC free article] [PubMed] [Google Scholar]
- [22].Zahedi RP, Lewandrowski U, Wiesner J, Wortelkamp S, Moebius J, Schütz C, Walter U, Gambaryan S, Sickmann A. Phosphoproteome of resting human platelets. J Proteome Res. 2008;7:526–34. doi: 10.1021/pr0704130. [DOI] [PubMed] [Google Scholar]
- [23].Mosesson MW. Fibrinogen heterogeneity. In: Mosesson MW, Doolittle RF, editors. Molecular Biology of Fibrinogen and Fibrin. vol. 408. Annals of the New York Academy of Sciences; New York: 1983. pp. 97–113. New York Academy of Sciences. [DOI] [PubMed] [Google Scholar]
- [24].Rosano C, Rocco M. Solution properties of full-length integrin αIIbβ3 refined models suggest environment-dependent induction of alternative bent⁄extended resting states. FEBS J. 2010;277:3190–202. doi: 10.1111/j.1742-4658.2010.07724.x. [DOI] [PubMed] [Google Scholar]
- [25].Byron O. Hydrodynamic modeling: the solution conformation of macromolecules and their complexes. Methods Cell Biol. 2008;84:327–73. doi: 10.1016/S0091-679X(07)84012-X. [DOI] [PubMed] [Google Scholar]
- [26].Cardinali B, Profumo A, Aprile A, Byron O, Morris G, Harding SE, Stafford WF, Rocco M. Hydrodynamic and mass spectrometry analysis of nearly-intact human fibrinogen, chicken fibrinogen, and of a substantially monodisperse human fibrinogen fragment X. Arch Biochem Biophys. 2010;493:157–68. doi: 10.1016/j.abb.2009.10.008. [DOI] [PubMed] [Google Scholar]
- [27].Radulovic V, Baghaei F, Blixter IF, Samuelsson S, Jeppsson A. Comparable effect of recombinant and plasma-derived human fibrinogen concentrate on ex vivo clot formation after cardiac surgery. J Thromb Haemost. 2012;10:1696–98. doi: 10.1111/j.1538-7836.2012.04823.x. [DOI] [PubMed] [Google Scholar]
- [28].Gorkun OV, Henschen-Edman AH, Ping LF, Lord ST. Analysis of Aα251 fibrinogen: the αC domain has a role in polymerization, albeit more subtle than anticipated from the analogous proteolytic fragment X. Biochemistry. 1998;37:5434–41. doi: 10.1021/bi981551t. [DOI] [PubMed] [Google Scholar]
- [29].Okumura N, Gorkun OV, Lord ST. Severely impaired polymerization of recombinant fibrinogen γ-364 Asp → His, the substitution discovered in a heterozygous individual. J Biol Chem. 1997;272:29596–601. doi: 10.1074/jbc.272.47.29596. [DOI] [PubMed] [Google Scholar]
- [30].Gorkun OV, Veklich YI, Weisel JW, Lord ST. The conversion of fibrinogen to fibrin: recombinant fibrinogen typifies plasma fibrinogen. Blood. 1997;89:4407–14. [PubMed] [Google Scholar]
- [31].Koppert PW, Huijsmans CMG, Nieuwenhuizen W. A monoclonal antibody, specific for human fibrinogen, fibrinopeptide A-containing fragments and not reacting with free fibrinopeptide A. Blood. 1985;66:503–07. [PubMed] [Google Scholar]
- [32].Cardinali B, Damonte G, Melone L, Salis A, Tosetti F, Rocco M, Profumo A. Identification of a new truncated form and deamidation products of fibrinopeptide B released by thrombin from human fibrinogen. Thromb Haemost. 2006;96:302–08. doi: 10.1160/TH06-03-0138. [DOI] [PubMed] [Google Scholar]
- [33].Brown PH, Schuck P. Macromolecular size-and-shape distributions by sedimentation velocity analytical ultracentrifugation. Biophys J. 2006;90:4651–61. doi: 10.1529/biophysj.106.081372. [DOI] [PMC free article] [PubMed] [Google Scholar]
- [34].Profumo A, Turci M, Damonte G, Ferri F, Magatti D, Cardinali B, Cuniberti C, Rocco M. Kinetics of fibrinopeptide release by thrombin as a function of CaCl2 concentration: different susceptibility of FPA and FPB and evidence for a fibrinogen isoform-specific effect at physiological Ca2+ concentration. Biochemistry. 2003;42:12335–48. doi: 10.1021/bi034411e. [DOI] [PubMed] [Google Scholar]
- [35].Zauner G, Hoffmann M, Rapp E, Koeleman CA, Dragan I, Deelder AM, Wuhrer M, Hensbergen PJ. Glycoproteomic analysis of human fibrinogen reveals novel regions of O-glycosylation. J Proteome Res. 2012;11:5804–14. doi: 10.1021/pr3005937. [DOI] [PubMed] [Google Scholar]
- [36].Spotorno B, Piccinini L, Tassara G, Ruggiero C, Nardini M, Molina F, Rocco M. BEAMS (BEAds Modelling System): a set of computer programs for the generation, the visualization and the computation of the hydrodynamic and conformational properties of bead models of proteins. Eur Biophys J. 1997;25:373–84. Erratum 1997;26:417. [Google Scholar]
- [37].Southan C, Thompson E, Lane DA. Direct analysis of plasma fibrinogen-derived fibrinopeptides by high performance liquid chromatography: investigation of Aα-chain N-terminal heterogeneity. Thromb Haemost. 1986;56:193–97. [PubMed] [Google Scholar]
- [38].Doolittle RF. Structural aspects of the fibrinogen to fibrin conversion. Adv Prot Chem. 1973;27:1–109. doi: 10.1016/s0065-3233(08)60446-5. [DOI] [PubMed] [Google Scholar]
- [39].Scheraga HA, Laskowski M., Jr. The fibrinogen-fibrin conversion. Adv Prot Chem. 1957;12:1–131. [Google Scholar]
- [40].Palmer GR, Fritz OG, Hallett FR. Quasielastic light-scattering studies on human fibrinogen and fibrin. I. Fibrinogen. Biopolymers. 1979;18:1647–58. [Google Scholar]
- [41].Mosesson MW, Alkjaersing N, Sweet B, Sherry S. Human fibrinogen of relatively high solubility. Comparative biophysical, biochemical, and biological studies with fibrinogen of lower solubility. Biochemistry. 1967;6:3279–87. doi: 10.1021/bi00862a038. [DOI] [PubMed] [Google Scholar]
- [42].Marder VJ, Shulman NR, Carroll WR. High molecular weight derivatives of human fibrinogen produced by plasmin. I. Physicochemical and immunological characterization. J Biol Chem. 1969;244:2111–9. [PubMed] [Google Scholar]
- [43].Dietler G, Wiltzius P, Grolimund P, Kanzig W, Haberli A, Straub PW. Fibrinogen – Structure, Functional Aspects, Metabolism. vol. 2. Walter de Gruyter & Co.; Berlin–New York: 1983. Early plasmin digestion of fibrinogen: light scattering data; pp. 19–23. [Google Scholar]