

Abstract
Purpose
Magnetic resonance imaging (MRI) is widely used in human brain research to evaluate the effects of healthy aging and development, as well as neurological disorders. Although standardized methods for quality assurance of human MRI instruments have been established, such approaches have typically not been translated to small animal imaging. We present a method for the generation and analysis of customized phantoms for small animal MRI systems that allows rapid and accurate system stability monitoring.
Methods
Computer-aided design software was used to produce a customized phantom using a rapid prototyping printer. Automated registration algorithms were used on three dimensional images of the phantom to allow system stability to be easily monitored over time.
Results
The design of the custom phantom allowed reliable placement relative to the imaging g coil. Automated registration showed superior ability to detect gradient changes reflected in the images than with manual measurements. Registering images acquired over time allowed monitoring of gradient drifts of less than one percent.
Conclusion
A low cost, MRI compatible phantom was successfully designed using computer-aided design software and a 3D printer. Registering phantom images acquired over time allows monitoring of gradient stability of the MRI system.
Keywords: MRI, phantom, quality control
Introduction
Magnetic Resonance Imaging (MRI) is a powerful research tool for the study of human brain development and neurological disorders. To ensure the quality of data collected over time and at different sites, specialized phantoms can be used for longitudinal and cross sectional calibration and monitoring of MRI systems. Imaging of such phantoms allow monitoring of scanner stability in terms of gradient and RF performance (1). Such system monitoring is important not only from a quality assurance stand point, but also to differentiate subtle neuroanatomical changes detected in the images from changes induced by system variations (2).
MRI is also an excellent method for non-invasively imaging rodent brains, where normal aging as well as many human neurodegenerative diseases have been modeled. Recent studies have used high-resolution MRI to measure changes in the brain through the progression of aging in rats and neurodegenerative diseases in mice (3-6). Studies of brain volume and morphology with MRI have begun to be increasingly performed in rodents with the potential to develop non-human biomarkers of disease progression for several prominent neurodegenerative diseases (4,7,8). Nonetheless, quality assurance procedures, such as those carried out in human studies (1), are less frequently reported in research utilizing small animal MRI systems. The small magnet bore and RF coil sizes associated with such systems makes it difficult to use complex phantoms. In this note, we present a simple phantom and a standardized image processing method that allows rapid and reliable monitoring of small bore MRI systems. The devices and procedures presented herein can be easily incorporated into MRI studies at very low cost in terms of money and time. While the phantom described in this note is designed specifically for rodent brain imaging, the methods are generally applicable to all types of MRI.
Methods
Phantom Design and Fabrication
The custom phantom was designed in the SolidWorks (DSS Corp, Concord, MA) computer aided design (CAD) software to fit directly onto a rat brain phased array RF surface coil (Bruker Biospin, Billerica, MA). The geometry of the phantom restricts placement of the phantom on the coil housing to a single orientation and location relative to the RF coils. The custom phantom was printed using Object Connex 350 3D rapid prototyping (RP) system (Objet Inc., Billerica, MA) using Fullcure 720 polymer. The 3D RP system allows for objects designed using CAD programs to be materialized in MRI compatible polymers at high resolution (600 × 600 × 1600 dpi) and tolerance (between 20-85 μm for objects less than 50 mm in size) (9), low cost and within hours after being designed.
MRI
Imaging of the phantom was performed on a Bruker Biospec 7T 20 cm bore MRI system with maximum gradient strengths of 600 mT/m. A 72 mm ID birdcage coil was used for excitation and a four channel phased array rat-brain surface coil was used for reception. The phantom assembly was attached to the surface coil, placed on an animal cradle and positioned in the isocenter of the gradient coils.
A 3D fast spin-echo sequence was used to rapidly acquire images of the phantom at 400 μm isotropic voxel resolution (TR = 1000 ms, TEeff = 150 ms, echo spacing = 10 ms, ETL = 32, matrix size = 256 × 128 × 64, scan time = 3 min 12 sec). For all imaging, the z-gradient was used for the readout direction and the x- and y-gradients were used for the two phase encode directions. The phantom was consecutively imaged five times over 20 minutes on a single day. These images were averaged to create a baseline image, which was used as a standard to which subsequent data sets were compared to monitor the change in the gradients. The phantom was scanned on three additional occasions with varying days in between each imaging session. Additional phantom images were collected with gradient strengths intentionally scaled to 85% and 99% of their calibrated value.
The temperature of the phantom was monitored throughout an imaging session by an MR compatible optical temperature probe attached to the outer holder. The temperature was monitored over a 20 minute scanning period.
Image Analysis
Manual measurements of the phantom image dimensions were made using ParaVision 5.1 Image Processing Toolbox available on the MRI console. The distance between cursor points positioned on the perceived edges of the phantom block was used as the manual measurement of the orthogonal dimensions of the phantom block. These simple manual measurements were compared to results from affine registration analysis of the 3D images performed using SPM8 software (10). The affine transformation matrix provides scaling parameters that register a source image to a template image. Five images of the phantom that were acquired on a single day of imaging were averaged to create a baseline image which was consistently used as the template image. Images obtained at future time points were used as source images. The processing was performed using the SPM8 linear affine registration, where the nonlinear parameters were set to zero and only the rotation, translation, and dilation parameters were used. Since the phantom was placed in the same location relative to the coil and in the outer holder for each scanning session, the only transformation parameter expected to change with the gradients is the dilation.
The affine transformation matrix only provides information on relative dimensions of two images and not absolute distances. Thus, to compare the manual measurements with the automatic affine transformation matrix, the manual measurements were converted to a relative scale by dividing the measured value by the ‘true’ size of the phantom. The ‘true’ size was determined by measuring the geometry phantom used for imaging with digital calipers (TRACEABLE® Digital Calipers).
The effect of the smoothing kernel size used in the affine registration was evaluated by varying source and template image smoothing kernels between 1 × 1 × 1 voxel to 10 × 10 × 10 voxels. Phantom images from a single day (n = 8) were registered to a standard image collected on the same day with varied kernel size and the change in scaling parameters of the affine matrix as well as computation times were evaluated.
The intra-day precision of the automated processing was estimated by the standard deviation of the results of affine transformation from each image used to make the baseline image to the averaged baseline image. Inter-day gradient stability was evaluated by registering phantom images taken on three different days to the baseline image. To investigate the ability of the technique to determine variations in the gradient strengths, images collected with gradients strengths altered to known levels (85 and 99% of template values) were registered to the template images. The scaling values of the registration should relate directly to the known change in the gradient scaling.
Results
The geometry phantom used to monitor the gradient stability is shown in Figure 1. The phantom consists of three main parts: an outer holder which attaches directly and snugly onto the surface coil, an inner geometry block consisting of uniform channels in three orthogonal directions perpendicular to the faces of the block, and an end cap. The inner geometry block provides structure to allow monitoring of gradient performance and has the dimension of 24 mm in length and 12 mm in width and height. The cylindrical channels in the block are 1.2 mm in diameter and are separated by 1.8 mm. The block also has four pegs that are used as spacers to allow proper positioning of the phantom within the holder, which is filled with degassed and deionized water (Figure 1a, b). The end cap fits securely in the outer holder and seals the water within the phantom. The outer holder attaches directly onto the phased array coil allowing reliable positioning of the assembly relative to the surface coil for each imaging session (Figure 1c). Representative T2-weighted images of the phantom are shown in Figure 2 where the orthogonal grid pattern of the block is readily seen. Throughout a 20 minute imaging session, the temperature of the phantom was constant at of 21.9 ± 0.1 °C.
Figure 1.
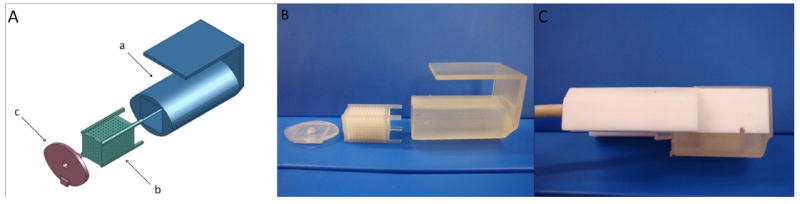
(A) SolidWorks 3D CAD program was used to design the custom phantom to fit onto a four channel phased array surface coil. The outer casing (a)attaches directly to the surface coil and houses the geometry phantom (b). An end cap fits snugly onto the outer casing to seal in water (c). (B) The phantom was designed in SolidWorks and was printed using the Objet Connex 350 rapid prototyping printing system. (C) The assembled phantom attached to the surface coil used to monitor gradient stability.
Figure 2.
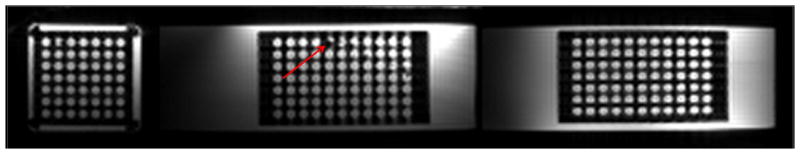
3D fast-spin echo image of the phantom. The positioning of the inner geometry block is important when performing MI based image registration. A small air bubble can be observed in the sagittal direction (indicated by arrow). The presence of the small air bubble did not add any appreciable error in the results of the affine registration.
A comparison of the manual measurements of the phantom image dimensions (n=12) with the results of affine transformation analysis of the same set of images is shown in Figure 3. The results from the affine transformation analysis show a tight distribution of values where as the manual measurements provide only discrete values separated by the dimensions of the imaging pixel.
Figure 3.
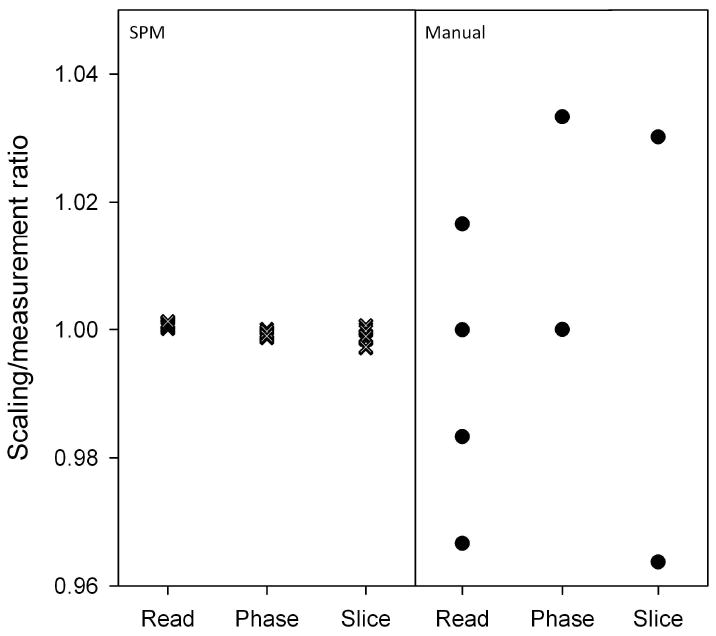
Multiple images were collected in one imaging session (n = 12) and manual measurements made by using PV 5.1 are compared to affine registration. Because of partial volume artifacts, the manual measurements can easily show a large difference greatly reducing precision and accuracy.
To evaluate the effect of affine registration parameters, the source and template image smoothing kernels were varied in size from 1×1×1 voxel (1 voxel kernel, no smoothing) to 10×10×10 voxels (10 voxel kernel). Registration using a 1 voxel kernel will not introduce errors due to smoothing, but requires relatively more computational time than registration using larger smoothing kernels. Phantom images were registered to a baseline image with different smoothing kernels and variations in the resulting affine matrix scaling factors were recorded (Figure 4) as well as the computation times required for registration. No significant differences were observed between kernel sizes of 1, 2, and 4 in all three directions using ANOVA (n = 8). As the size of the smoothing kernel was increased, differences were first observed in the read direction between kernel sizes of 1×1×1, 2×2×2 and 6×6×6 (p < 0.05). Additional differences were detected at larger kernel seizes (8×8×8 and 10×10×10 voxels) in phase and slice directions. Although the computation time required is reduced with larger smoothing kernels, the overall computation time is relatively small. On the computer used in this study, registration using a smoothing kernel size of 1 voxel took approximately 330 seconds while the registration with kernel sizes of 4 and 10 took 300 and 20 seconds, respectively. Because of the combination of lower computation time and high precision, a kernel size of 4×4×4 voxels was used in all subsequent analyses.
Figure 4.
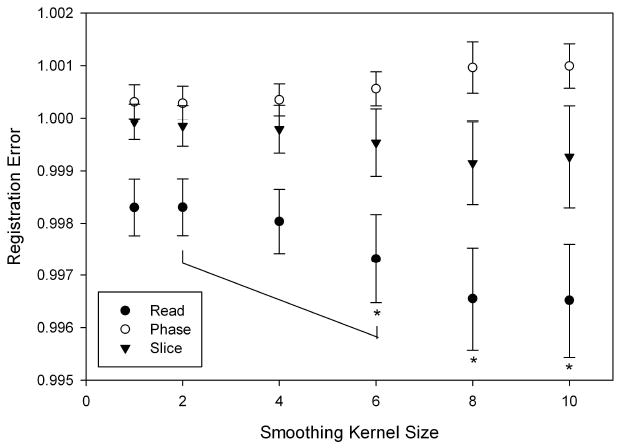
Source and template image smoothing kernels sizes were varied from 1×1×1 to 10×10×10 voxels for a given data set (n = 8) and the output affine matrix values of the registration with the baseline image were compared using ANOVA. As can be clearly seen, the standard deviation of the registration increases with a larger smoothing kernel. In all three directions, no significant differences were detected between 1×1×1, 2×2×2 and 4×4×4, but a difference was detected between 2×2×2 and 6×6×6 in the read direction using ANOVA (p < 0.05).
Images acquired with intentionally reduced gradient strengths were also registered to the baseline image. The affine registration was shown to be able to accurately detect both small and large gradient deviations. The registration with gradient strengths set to 0.99 of their baseline value in the x, y and z directions reported scaling factors of 0.990, 0.989 and 0.989, with standard deviations of 0.64×10⁻³, 1.0×10⁻³ and 1.1×10⁻³, respectively. Registration of images collected with gradients scaled to 0.85 of the baseline value reported scaling factors of 0.850, 0.849 and 0.849 for the x, y and z directions, with standard deviations of 0.62×10⁻³, 1.2×10⁻³, and 1.2×10⁻³, respectively.
Using images collected on 4 days over a three month timespan, gradient stability was monitored using affine registration (Figure 5). The small intraday standard deviation of the baseline images are within the symbol size. The largest deviation from the baseline image was observed in the phase direction where a 0.8% change from baseline. The overall average difference from baseline was 0.37%.
Figure 5.
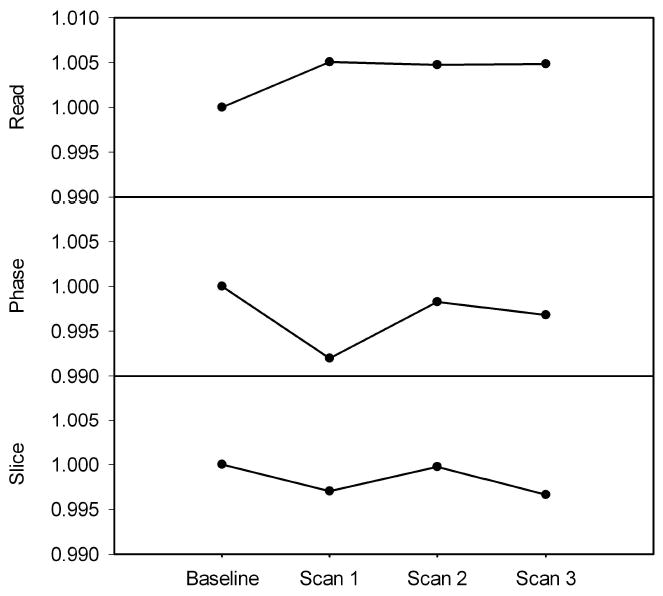
Variation in gradients over time derived from SPM8 affine matrix. The baseline point is made by averaging five images collected on the same day. The error bars on the baseline data are within the symbol size. The data shows that there is small interday variation in the gradient strengths of our system where the largest variation is detected was 0.8% (phase direction, second time point).
Discussion
When performing longitudinal MRI studies to observe subtle changes in anatomy, it is important to separate system variation from actual physiological change. A simple method to monitor system stability is to periodically image a phantom, which can be registered to an image taken at an earlier time point to observe changes in the images over time (2). Ideally, phantoms would be specifically designed for the MRI hardware being used and the imaging and analysis tools would allow rapid and accurate measurements of important system parameters.
In this note, a simple geometry phantom is described and is used in combination with rapid imaging and automatic affine transformation analysis. The process described could be used to produce a phantom that could fit on virtually any RF coil.
FullCure 720 polymer (Objet Inc., Billerica, MA) was used for the construction of the phantom. This material has minimal water absorption (1.5 – 2.2 %) over a 24 hr period, which has a negligible effect over the imaging period of 20 minutes. However, to maintain the integrity of the phantom assembly, water was removed in between each scanning session to allow the polymer to fully dry. Additionally, FullCure 720 has a heat deflection temperature of 45-50 °C at both 0.45 and 1.82 MPa; the temperature of the phantom was stable throughout the imaging session at 21.9 ± 0.1 °C. Under these imaging conditions, the phantom was thermally and mechanically stable.
An important criterion of quality assurance monitoring techniques is that they do not take a significant amount of time, either during data collection or for analysis. The image acquisitions and analyses described herein are extremely fast and simple to implement. Setup and imaging can take place in less than 10 minutes and the analysis can be carried out within a few minutes on a standard computer. While the measurements reported herein are limited to gradient scaling, phantom described here can be used to evaluate system linearity as previously described (1,11).
Low-resolution 3D images were sufficient to assess gradient stability in all three directions from a single data set. Automatic affine registration using a 4×4×4 image smoothing kernel allowed for fast registration of phantom images and provided a more detailed evaluation of the gradients compared to manual measurements. The manual measurements are vulnerable to partial volume artifacts, making it difficult to accurately determine the edges of the phantom. The measurements are limited by voxel size resulting in discretized values and a potential for large deviation from the actual size of the phantom (Figure 3). Manually measured images with intentionally varied gradient strengths were insensitive to gradient changes of 1% but could detect a change of 5%. A 5% difference in the gradient strength in all three orthogonal directions will result in phantom dimensions of 22.8 mm in length and 11.4 mm in both width and height. In both cases, the difference from the original dimension is larger than the voxel resolution of 400 μm (1.2 mm and 0.6 mm respectively), and this difference was readily detected by manually measuring the image dimension with ParaVision 5.1 Image Processing Toolbox. However, a 1% difference in gradient strength results in a dimensional difference of less than 400 μm, and thus was not detected by manual measurements. In contrast, the automatic affine registration was able to reliably detect a 1% change in gradient change (p < 0.01, data not shown).
To establish a standard protocol for the automated affine registration, the standard deviation of image registration with varying smoothing kernel sizes as well as the times for the registrations were evaluated. The overall trend showed an increase in the standard deviation and a decrease in computation times associated with the increase in smoothing kernel size (Figure 4). The computation time is clearly dependent on the computing system being used for the registration; however, the time for image processing was also a key factor for making the analysis practical so it was taken into account for the protocol evaluation. Since no significant differences were detected using ANOVA between 1, 2, and 4 kernel smoothing in all three directions (p = 0.05), and due to faster computation time, a smoothing kernel of 4 voxels was used in subsequent affine registration.
It is worth noting that the presence of residual air bubbles had little effect on the results of registration. In the process of assembling the geometry phantom it is very difficult to eliminate all air bubbles, even when using degassed water. The images shown in Figure 2 are representative of the amount of residual air contained within the small cavities of the phantom. The mutual information based registration used in the analysis appears to be insensitive to the presence of small air bubbles and did not appear to negatively impact the affine registration results; images with bubbles were able to be registered to images without bubbles and no noticeable error was observed (Figure 5). This is likely because the amount of information from the water within the structured phantom is much greater than the signal change caused by a small air bubble. Air bubbles, however, would most likely have an effect if the phantom is used to monitor the local field homogeneity.
The simple method presented here is able to accurately detect both small and large deviations in the gradient strengths as indicated by the small standard deviations when registering images using 99% and 85% of maximum gradient strengths. This indicates that the method will be able to accommodate a wide range of variations in gradient values.
We employed a widely used brain imaging registration algorithm to illustrate the potential and ease of use for the customized phantom processing and analysis (10,11). Other registration algorithms (12) with varied applications may offer the potential for improved precision in optimizing the detection of system variations over time that are distinct from anatomical differences.
Combining CAD and RP printing, custom MRI phantoms can be generated to suit virtually any anatomy and RF coil geometry. Automated affine registration of phantom images obtained periodically can be a powerful and low cost tool in monitoring gradient stability providing a simple method for quality assurance of small animal MRI systems. The use of such standardized phantoms and analysis protocols may help to enhance the quality control and monitoring of small animal MRI instruments.
Acknowledgments
The authors would like to acknowledge support by the National Institute of Biomedical Imaging and Bioengineering (EB000343), National Institute on Aging (AG037806, AG025526, AG19610), the state of Arizona and Arizona Department of Health Services and the Evelyn F. McKnight Brain Institute.
References
- 1.Gunter JL, Bernstein MA, Borowski BJ, Ward CP, Britson PJ, Felmlee JP, Schuff N, Weiner M, Jack CR. Measurement of MRI scanner performance with the ADNI phantom. Medical Physics. 2009;36(6):2193–2205. doi: 10.1118/1.3116776. [DOI] [PMC free article] [PubMed] [Google Scholar]
- 2.Clarkson MJ, Ourselin S, Nielsen C, Leung KK, Barnes J, Whitwell JL, Gunter JL, Hill DL, Weiner MW, Jack CR, Jr, Fox NC. Comparison of phantom and registration scaling corrections using the ADNI cohort. Neuroimage. 2009;47(4):1506–1513. doi: 10.1016/j.neuroimage.2009.05.045. [DOI] [PMC free article] [PubMed] [Google Scholar]
- 3.Delatour B, Guegan M, Volk A, Dhenain M. In vivo MRI and histological evaluation of brain atrophy in APP/PS1 transgenic mice. Neurobiol Aging. 2006;27(6):835–847. doi: 10.1016/j.neurobiolaging.2005.04.011. [DOI] [PubMed] [Google Scholar]
- 4.Lau JC, Lerch JP, Sled JG, Henkelman RM, Evans AC, Bedell BJ. Longitudinal neuroanatomical changes determined by deformation-based morphometry in a mouse model of Alzheimer’s disease. Neuroimage. 2008;42(1):19–27. doi: 10.1016/j.neuroimage.2008.04.252. [DOI] [PubMed] [Google Scholar]
- 5.Lerch JP, Carroll JB, Spring S, Bertram LN, Schwab C, Hayden MR, Henkelman RM. Automated deformation analysis in the YAC128 Huntington disease mouse model. Neuroimage. 2008;39(1):32–39. doi: 10.1016/j.neuroimage.2007.08.033. [DOI] [PubMed] [Google Scholar]
- 6.Sullivan EV, Adalsteinsson E, Sood R, Mayer D, Bell R, McBride W, Li TK, Pfefferbaum A. Longitudinal brain magnetic resonance imaging study of the alcohol-preferring rat. Part I: adult brain growth. Alcohol Clin Exp Res. 2006;30(7):1234–1247. doi: 10.1111/j.1530-0277.2006.00145.x. [DOI] [PubMed] [Google Scholar]
- 7.Plant C, Teipel SJ, Oswald A, Bohm C, Meindl T, Mourao-Miranda J, Bokde AW, Hampel H, Ewers M. Automated detection of brain atrophy patterns based on MRI for the prediction of Alzheimer’s disease. Neuroimage. 2010;50(1):162–174. doi: 10.1016/j.neuroimage.2009.11.046. [DOI] [PMC free article] [PubMed] [Google Scholar]
- 8.Cheng Y, Peng Q, Hou Z, Aggarwal M, Zhang J, Mori S, Ross CA, Duan W. Structural MRI detects progressive regional brain atrophy and neuroprotective effects in N171-82Q Huntington’s disease mouse model. Neuroimage. 2011;56(3):1027–1034. doi: 10.1016/j.neuroimage.2011.02.022. [DOI] [PMC free article] [PubMed] [Google Scholar]
- 9.Ltd O Connex 350. 2009;2011 Technical Specifications. [Google Scholar]
- 10.Friston KJ, Holmes AP, Ashburner J, Poline JB. SPM. 2011 [Google Scholar]
- 11.Moon SY, Hornak JP. A volume resolution phantom for MRI. Magn Reson Imaging. 2010;28(2):286–289. doi: 10.1016/j.mri.2009.07.002. [DOI] [PubMed] [Google Scholar]
- 12.Reuter M, Rosas HD, Fischl B. Highly accurate inverse consistent registration: a robust approach. Neuroimage. 53(4):1181–1196. doi: 10.1016/j.neuroimage.2010.07.020. [DOI] [PMC free article] [PubMed] [Google Scholar]